Archive for Astros

Prospect Watch: 5 Future All-Stars No One Is Talking About

I chose to stick with hitters in this article, because pitching prospects are extremely difficult to predict, and I think the pitchers who do get the hype are typically deserving. However, I do see a trend of some unnoticed hitting prospects turning out great careers in the majors. Let’s get right to it.

1. Travis Demeritte – 2B – ATL

In 2016, Demeritte went from the Rangers’ to the Braves’ system and spent the entire year in high-A ball, where he dominated at the plate. A 2B with power like Cano, good speed and the ability to get on base is such a rarity.

In my opinion, Demeritte has the highest chance of being a perennial All-Star out of these five prospects. The middle infield in Atlanta has an extremely bright future. I’m predicting that Demeritte will make his splash in 2018, and make his first ASG appearance by 2020 (age 25). Let’s look at his numbers from a season ago:


Name Age G AB PA H 2B 3B HR BB SO SB CS BB% K% OPS ISO wOBA wRC+
Travis Demeritte 21 145 547 635 145 33 13 32 78 200 20 4 12.3% 31.5% 0.905 0.283 0.393 139


Let’s compare these to the four All-Star 2B in 2016 and Brian Dozier.

Name G AB PA H 2B 3B HR BB SO SB CS BB% K% OPS ISO wOBA wRC+
Jose Altuve 161 640 717 216 42 5 24 60 70 30 10 8.4% 9.8% 0.928 0.194 0.391 150
Robinson Cano 161 655 715 195 33 2 39 47 100 0 1 6.6% 14.0% 0.882 0.235 0.37 138
Brian Dozier 155 615 691 165 35 5 42 61 138 18 2 8.8% 20.0% 0.886 0.278 0.37 132
Dustin Pedroia 154 633 698 201 36 1 15 61 73 7 4 8.7% 10.5% 0.825 0.131 0.358 120
Ian Kinsler 153 618 679 178 29 4 28 45 115 14 6 6.6% 16.9% 0.831 0.196 0.356 123


Some things to keep in mind as we compare these players: Demeritte was playing in A+ ball, but he did play an average of 12 less games than these major-leaguers. As you can see, it’s basically a two-man race (other than Dozier’s 42 HRs) between Altuve and Demeritte here. While we cannot expect these A+ ball numbers to translate directly against ML pitching, Demeritte definitely deserves more attention in top-prospect lists. While he’s not quite as speedy as Altuve, he has more power, and he walks at a far higher rate. The one glaring weakness is the K numbers for Demeritte. However, some of the top players in the league K at very high rates. As long as the OPS stays high, it doesn’t really matter how a guy makes outs anymore.

I should note that 2016 was a breakout year for Demeritte; in years past he didn’t quite live up to his potential, and also served an 80-game PED suspension. These could be the main reasons why he hasn’t garnered much attention yet. He still has to prove himself to most. However, I’m sold. I’d pencil him in for the majority of the 2020s’ ASGs right now.


2. Ramon Laureano – OF – HOU

Laureano has all the tools: he can play any OF spot well, he has speed and pop, and he gets on base. Houston’s farm has taken a bit of a hit due to some trades in the last two years, but that’s because they knew they had guys like Laureano who don’t have super high trade value, but have a chance to be great ML players like the guys they traded. Let’s look at Laureano’s 2016 numbers.

Name Age G AB PA H 2B 3B HR BB SO SB CS BB% K% OPS ISO wOBA wRC+
Ramon Laureano 21 128 461 555 146 32 9 15 73 128 48 15 13.2% 23.1% 0.943 0.206 0.418 159


The numbers speak for themselves. This is the making of a star; where is the hype? I know it’s not a huge sample size, and we don’t have much to go off from the previous year either, but in A+ and AA last year he put up those phenomenal numbers you see above.

If those aren’t All-Star numbers, then I don’t know what are. Laureano’s ability to play all three OF spots will keep him in the lineup everyday and help his chances of making it to the ASG. When he does get the call-up, if his numbers stay relatively close to this, there’s no way he doesn’t make three to four All-Star Games. As of now, he’s more of a speed threat, but as he develops, the speed/power combo will even out and he will be an Andrew McCutchen-type player. Keep tabs on this guy.


3. Christin Stewart – OF – DET

While researching Stewart, I couldn’t find an article more recent than September of 2015. There’s no one talking about him…why? As we know, Detroit is aging and looking to deal top players. So, I’m assuming we will be seeing a lot of opportunities for young guys to step up and prove themselves. Detroit’s system isn’t super deep, but that could change anytime if they do decide to move some key pieces. Regardless, I see Stewart as the prospect to watch moving forward; he has the tools to be an All-Star. Let’s check out his numbers from 2016.

Name Age G AB PA H 2B 3B HR BB SO SB CS BB% K% OPS ISO wOBA wRC+
Christin Stewart 22 147 514 622 132 29 2 31 93 154 4 2 15.0% 24.8% 0.883 0.245 0.407 156


The power is impressive, and by this chart he looks even a bit better than the two previous guys I mentioned. However, with the K numbers pretty high up there, and not a whole lot of speed, Stewart is a player that could fall into slumps. Often times, adjusting to the majors can be challenging, and some top prospects never quite figure it out. While Stewart’s MiLB numbers are pretty insane, his slump potential makes him a pretty risky pick here. However, I do believe that if he does indeed figure it out, he will make it to a few ASG and serve as an everyday player in this league for a decade. HRs and BBs get it done. Keep an eye on Stewart.


4. Jason Martin – OF – HOU

Another Houston OF prospect…another future All-Star? I think so. The future is certainly bright over at Minute Maid Park: Altuve is a cornerstone, Correa is a centerpiece, Springer is a baller, and they have prospects for days. If they can just figure out how to pitch, they could be a WS contender for the next eight years.

Why Martin, though? Let’s check out his 2016 numbers from high-A ball.

Name Age G AB PA H 2B 3B HR BB SO SB CS BB% K% OPS ISO wOBA wRC+
Jason Martin 20 121 431 502 114 25 7 23 63 112 22 12 12.5% 22.3% 0.874 0.251 0.382 131


Impressive, to say the least. At just 20 years old, he pumped out 23 homers in 121 games. He walks every eight at-bats, and he also grabbed 22 bags on the season. The ability to walk and run (lol) will typically keep guys out of major slumps. While Martin is not a highly-touted prospect at this point, I think he will be a household name by 2022. I expect him to get the call-up in 2019 and play a significant role during a pennant race that year. In 2020, he will burst onto the scene and prove his worth to this franchise.

With Houston’s current build, this might be a guy we see dealt if they are trying to add talent at the deadline this year. That doesn’t change my prediction, however. I see Martin suiting up for the ASG a few times throughout his career. Stay posted.


5. Tom Murphy – C – COL

You can’t keep putting Yadier Molina in there every year. And with Buster Posey most likely making that change to 1B full-time within three years, Jonathan Lucroy getting dealt to the AL, Kyle Schwarber playing OF, etc, pathways for guys like Tommy Murphy open up. Making the All-Star Game as a C is not saying as much as other positions, in my opinion. A decent hot streak in the first half will inflate your hitting numbers. For example, Derek Norris in 2014. It may seem like he was the best catcher in the league at the halfway point, but, as usual, it evened out by season’s end.

With that being said, Murphy has proven he has pop, and playing in Colorado is a huge advantage for him. While I don’t think he will be a Hall-of-Fame catcher, I do think he’s flying under the radar right now and will probably open some eyes in 2017. I’d say he makes two appearances in the ASG before 2022. However, once he gets up near 30 and he’s no longer playing in Colorado, I think he will have trouble keeping a job.

I have him on the list, first of all, because he meets the criteria, and also because I think people should pay attention to him, and lastly because he’s ML-ready, unlike the rest of these guys. Trevor Story didn’t have a whole lot of hype; most people didn’t expect him to make the team out of spring, but with the Jose Reyes situation, the kid got a shot and as we all know, he ran with it. I’m not saying Murphy will make a cannonball-esque splash like Story, but I think he will turn some heads and maybe even get some ASG votes this year. Anything can happen, especially in Colorado. Keep tabs on him.

Honorable Mentions

Dylan Cozens – OF – PHI

There’s not a lot of buzz surrounding Cozens, which is surprising to me, because usually when we see 40 HR in 134 games, we really perk up. In his age-22 season, he played all 134 games at the AA level for the Phillies affiliate, Reading Fightin’ Phils, a place where most Phillies prospects prosper. The reason why Cozens doesn’t quite make the cut here is because of the words, “future All-Star.” He is one of those lefties that mash in the right ballpark and against RHP, but usually career platoon hitters, even if they are highly effective, don’t make the ASG.

Rhys Hoskins – 1B – PHI

Hoskins is another AA player in the Phillies system. He probably has a little bit more of a well-rounded hitting ability than does Cozens, but he’s a 1B, and that’s an overloaded position. You have to be incredible to crack that ASG squad, and I just don’t think Hoskins will ever be quite at that level. I do believe he will pan out to be an everyday guy for a good amount of time in this league. He has really good power and he gets on base, two things that will keep you in the lineup more often than not.

Bobby Bradley – 1B – CLE

Bradley is another guy I would keep an eye on; I’m just not sold on him yet. He has a a lot of raw power, but a really high K rate in the low levels of the minors. Also, he’s a 1B, so once again, really hard to make the ASG at that position.


Buying or Selling Carlos Gomez

What are you to do with a former fantasy superstar who hasn’t lived up to expectations? For some, the answer’s easy; Carlos Gomez has already been dropped in over 25% of leagues on both ESPN and Yahoo.

Now that I’ve driven half my audience away with my use of a semicolon, let’s start the real analysis. Gomez certainly disappointed his owners through the first month and change of the season, sporting a minuscule .486 OPS through May 15 before being placed on the DL. For reference, out of 324 batters with at least 100 plate appearances, just two (2) have a lower OPS as of June 24. Both are on the Braves (one hit fifth in the lineup as recently as June 21, while the other has batted second 13 times this season).

So yes, one could see why owners would have lost patience with Gomez. But this was also a player who hit 66 home runs and stole 111 bases while hitting .277 between 2012 and 2014. If anyone deserved patience, it was him.

So when he hit two home runs in his first six games back from the DL, it was hard to be too surprised. Since then, he’s put together five multi-hit performances, and has brought his season line back up to at least non-Atlanta-ish numbers.

While it’s obviously a small sample size, Gomez’s 76 plate appearances in 19 games since his return have shown immense improvement over his horrendous start to the season. To demonstrate this, take a look at each of the different areas in which he’s bounced back:

Plate Discipline
2012-2014 April 5 – May 15 May 31 – June 24
BB% 6.2% 5.3% 10.5%
K% 22.8% 34.8% 30.3%
BB/K .27 .15 .35
SwStr% 13.9% 19.4% 16.7%
O-Contact% 59.5% 42.4% 45.9%
Z-Contact% 84.4% 74.4% 80.5%
O-Swing% 37.4% 32.1% 35.7%
Z-Swing% 79.3% 79.9% 65.8%

I could bring up more player comparisons and show you just how bad the Atlanta Braves are this year, but that’s not the point of this article. Instead, let’s just focus on Gomez’s numbers and how they compare to earlier in the year and during his prime years. He’s nearly doubled his walk rate while striking out more than 10% less often than before, leading to a BB/K that is no longer painful to look at. He’s missing less frequently on pitches he swings at, both in and out of the zone, and has fewer swings-and-misses as a result. The one worrisome spot here is his swing rates, where the trend is the opposite of what we’d generally expect when we see favorable results. However, his O-Swing% is still lower than it was between 2012 and 2014, and it seems as though swinging less at pitches in the zone is leading to more walks and less bad contact, so it’s not truly a terrible result.

Batting and Power
2012-2014 April 5 – May 15 May 31 – June 24
AVG .277 .182 .294
BABIP .329 .293 .405
OBP .336 .238 .368
SLG .483 .248 .471
ISO .206 .066 .176
OPS .819 .486 .839
wOBA .356 .216 .364
wRC+ 123 28 129
HR/FB% 14.6% 0.0% 33.3%

I already referenced Gomez’s OPS above, but it’s still almost unbelievable to see that his post-injury slugging percentage is nearly as high as his OPS once was. Besides that, there’s improvement across the board. His average is up over 100 points, as his OBP, SLG, ISO, OPS, and wOBA. He’s gone from being 70% worse than the average hitter to 30% better. What’s good to see her is that he’s not outpacing any of his career stats by a noticeable amount — an indication that his current run is very much sustainable. Okay, maybe not the .385 BABIP, but as you’ll see next, keeping it over .300 shouldn’t be an issue.

Batted Ball Breakdown
2012-2014 April 5 – May 15 May 31 – June 24
GB% 39.3% 47.1% 44.2%
FB% 40.6% 35.7% 20.9%
LD% 20.1% 17.1% 34.9%
Pull% 42.7% 36.4% 62.2%
Cent% 33.9% 41.6% 13.3%
Oppo% 23.5% 22.1% 24.4%
Soft% 16.7% 29.9% 31.1%
Med% 48.0% 45.5% 28.9%
Hard% 35.3% 24.7% 40.0%

Let’s take this one at a time. First, Gomez has seen a drastic increase in his line-drive percentage, unfortunately at the expense of hitting fewer fly balls. While it’d be better to see him hit fewer ground balls and get some more balls in the air, he’s certainly making this approach work for him right now. He won’t hit 30 home runs with this approach, but with the increased line drives, he should have no problem continuing to hit for extra bases.

Then comes the confusing part. He’s increased both the percentages of balls he hits to the pull side and opposite of the field, now hitting just 13.3% of his balls to center. He was definitely spraying the ball better beforehand, although the bloated Pull% will undoubtedly help him to put up some better power numbers. If the numbers stay in this region, I’d definitely expect his BABIP to regress, but it’s more likely that they regress closer to his career norms. A lot of those pulled balls will end up going to center field.

Finally, there’s the stuff that’s easy to analyze. Hit the ball harder, get better results. Gomez apparently believes in that approach as well, now hitting the ball hard over a third of the time and showing over a 50% increase from his previous rate. He needs to work on hitting the ball soft less often, which should happen if he continues to be selective and wait for his pitch.

Statcast Data
2015 April 5 – May 15 May 31 – June 24
Exit Velocity (mph) 88.5 84.8 86.4
Exit Velocity on Line Drives and Fly Balls (mph) 92.7 91.2 96.4
Fly Ball Distance (feet) 315.2 309 359

Ah, Statcast. What would we do without your infinite wealth of knowledge? The data here was obtained through Baseball Savant, and confirms that Gomez is indeed hitting the ball harder than he was before his injury. His overall average exit velocity remains low, but his velocity on line drives and fly balls is actually higher than it was last year. He can hit all the slow ground balls he wants and still be successful, provided he can keep up this increased velocity on balls in the air. Of course, he’s not going to continue hitting his fly balls over 350 feet — that’s reserved for people like Byung Ho Park (and apparently Tyler Naquin?). But he’s at 323 feet for the season now, and which should easily suffice for him to begin putting up some rejuvenated power numbers.

If you’re looking for a tl;dr, here it is: Carlos Gomez is performing much better than he was earlier in the season. He’s taking more walks, striking out less, making more contact, and hitting the ball harder and farther (further?). It’s obviously a small sample size, and he may not put up another 20/40 season, but he’s more than capable of hitting 10 home runs and stealing 15 bases the rest of the way. While it’s not elite production, it’d be better than he did last year, which would be quite an achievement after his start to the season.


The Evan Gattis Triples Game

There are 13 qualified hitters in baseball with at least six triples.  12 of the 13 players have at least five SB and the average among those 12 players is 18 steals.  Among the league leading ranks in triples stands one man who defies the common narrative that triples hitters are speedy.  He’s known as ‘El Oso Blanco’, which translates to “The White Bear” for non Spanish-speaking readers, and listed at a whopping 6’4”, 260 lbs, it’s easy to see why they call him that.  His story is one of modern day folklore, and it’s fitting that his wandering days eventually would lead him to an Astros squad that have taken the American League West by surprise.  Evan Gattis, has as many stolen bases as he has batting gloves, or as many as he appears to have, which is zero, because if you’ve witnessed him hit at all, one of the first things you notice about him is that he does not wear batting gloves.  Yet there his name is, one triple ahead of the likes of Adam Eaton and David Peralta; Evan Gattis, with nine triples, the man in sole position of second place for the most triples in major league baseball.

Consider this: he had 1 triple in his first 783 PA (or even 1 in his first 928, if we want to include all of his career PA up to May 28th, 2015 – the date of his first triple this year), and that one triple was hit into Triples Alley at AT&T Park in San Francisco on May 13th, 2014 (No, this was not a Friday the 13th).  Triples Alley is aptly named for the high volume of balls that are hit there that result in triples (relatively speaking).  So that was Gattis’ one and only, and yet he’s hit 9 in his following 446 plate appearances (or even scarier, 9 in 301 PA).  Before delving too much into this, I thought, “Conditions for an Evan Gattis triple would have to be perfect.  I bet at least 6 of these triples are due to Tal’s Hill“, which is the 90 foot wide, 30 degree incline, that extends the area of balls in play about 34 feet beyond where the fence would normally end at Minute Maid Park.  It is a whopping 436 feet to the wall at the top of Tall’s Hill.  However, a quick peek at Gattis’ home/away splits would reveal that he has just 5 triples at home and 4 on the road.

Well then he must have hit his triples in “triple-friendly” parks; below is a table showing where he has hit his 9 triples this year:

STADIUM 3B FACTOR
AT & T Park 1.211
Minute Maid Park (5) 1.549
Kauffman Stadium 1.240
Comerica Park (2) 1.465

Okay, that was predictable and makes a lot of sense to me.  Now here is a spray chart that shows his hit types (if you don’t read keys, the red dots are the triples):

chart (3)

*There is a sneaky red dot signifying a triple hiding behind a home run dot in left center just to the right of the most far left red dot*

Looking at the plotting of the red dots and considering what stadiums he hit his triples at is where I got the idea for this article – and I will now switch to writing in present tense to portray the feeling of spontaneity I felt when I first started this writing. Considering the factors, I get the feeling that I can guess which stadium each of his triples have been hit at – an exhibition of frivolity to be sure, but this is just the kind of thing that we’re looking for while we’re at work, trying to look busy, isn’t it?  If you wanna play, keep reading and guess along.  I am going to take a liberty and use the pronoun “we” instead of “I” so this feels more like a group effort.  And I also have a disclaimer: If you continue reading, you are assuming the risk that this could be a jarringly disjointed, moderately sarcastic, and gif cluttered article – it is.

The Evan Gattis Triples Game

Let’s consider my first hypothesis – that Tal’s Hill is responsible for a majority of these triples.  Looking at the red dots it looks like 3 of them may have very well landed there.  In order to kind of stick with my original idea, we’ll take the five most centrally located red dots and say that those are the triples he hit at home.

chart home

For reference into this reasoning, here’s the stadium layout of Minute Maid Park (all ballpark layouts are courtesy of Clem’s Baseball).  Note the massive depth of center field.

MinuteMaidPark

Using FanGraphs’ Game Logs I’ll pinpoint the dates of his 5 home triples and then plug those dates into Gattis’ spray chart over at BrooksBaseball.

1st Triple at home; 3rd Triple of Season: 06/28 vs NYY

triple1

That ball is not hit to Tal’s Hill, but it is one of his 5 most centrally hit triples of 2015, so that’s 1/1 if you’re scoring at home.

Now here’s the GIF – and here’s where I have to pause and give credit to another article.  When I started to write this post I hadn’t planned on including so much media, but as the post evolved it really did call for GIFs of these triples.  When I searched ‘Evan Gattis triples’ on google, the first link that popped up is this SB Nation post by Murphy Powell, and it’s the source for 6 of the 8 GIFs here and is, by all accounts, VERY similar and a much better article than mine, so check it out.  Any other GIFs were created using Baseball Savant media and makeagif.com.

gattis_3.0

“ARGH!”  That’s the sound of Michael Pineda groaning as he grimaces and falls on to bended-knee while telepathically willing the ball to stay in the park, which it does, barely.  Pineda is groaning because that was not a quality slider.  This information could probably be an entirely new post altogether, but I did warn you about this post being disjointed, so let’s to a quick detour.

This triple took place at the end of June – a table tracking velo and movement of Michael Pineda’s sliders shows that Pineda was throwing sliders of a lesser quality during this period.

Date(s) Velo x-movement v-movement BAA
Pitch to Gattis (06/28) 87.9 2.15 1.25 1.000 (obviously)
April 2015 84.08 4.54 -0.30 .208
May 2015 85.76 4.00 -0.41 .191
June 2015 87.12 2.47 0.02 .250
July 2015 87.10 1.34 0.46 .231

Whether it has been a conscious decision to throw his slider harder or it is a product of his ailing elbow, the results have not been so good.

Anyways, at this point, three triples into the season – and 3 in his last 36 games – Gattis’ reputation as a triples machine is really starting to build momentum (I warned you about the sarcasm, too) and as soon as the ball bounces away from Brett Gardner and is left to be retrieved by a scurrying Garrett Jones, Gattis is off to the races.

2nd Triple at home; 4th Triple of the season: 06/30 vs KCR

triple2

Bingo! This is a Tal’s Hill special and would be a home run at 29 other ball parks.

gattis_4.0

Lorenzo Cain, who has to at least be in the conversation for the smoothest looking active baseball player, is rendered looking like a reckless drunkard, smashing head-first into the wall and then toppling over on to his side after heaving the ball in towards a cut-off man from his knee.  Nonetheless, Gattis has his 4th triple of the year and we are 2 for 2.

3rd Triple at Home; 5th Triple of the season: 07/17 vs TEX

triple3

That one is not quite as impressive as the last one in terms of distance, but he laid into this one pretty good, too.

gattis_real_5.0

This hit scoots up on to Tal’s Hill after it nicks off Leonys Martin’s glove and then bounces off the wall – are you already missing the antics that Tal’s Hill won’t be causing in 2016?  The main thing here is that we are now 3 for 3 in this game.  I knew this would be easy.

4th Triple at Home; 7th Triple of the year: 07-28 vs LAA

triple4

So we’re wrong on this one and that brings our tally to 3 for 4 – and I’ll take most of the responsibility for the ones we get wrong – my bad.  “My bad” suffices when a player makes an errant pass out of bounds in a professional basketball game, so it should be enough here, too.

gattis_5.0 (1)

This one hit just under the yellow line against the Papa John’s sign, and it had to careen off the wall in such a way that it caused the ball to bounce into another empty center field where Shane Victorino finally picks it up and hurls it in just in time for Gattis to pull in to third base with a stand up triple.

5th Triple at Home; 7th Triple of the year: 08-14 vs DET

plot_hc_spray

This is technically another one of the 5 most centrally located triples so we are 4 out of 5.

Gattis Triple 5 Gif


The ball comes off the bat hard enough (99.3 mph) and then takes a generously frictional hop and loses speed as it trickles up against the wall in the deepest part of right center field at Minute Maid.  I don’t care if even the great Roberto Clemente was in right field, that is a long relay throw and there is plenty of time for Evan Gattis to lock down his 9th triple of the season.  Gattis is immediately pulled from the game as he is probably completely out of juice at this point in the season, but fans rejoice over his exploits and even Evan Gattis can’t believe his recent output of triples:

7fx3An


So we are hitting .800 after the home stand, but now let’s take on the triples hit away from home.  Here are the triples that we have left to identify:

chart (3)

The media, for whatever reason, has started to get smaller, so I will point out the locations of the triples: there is one to deep, left center; one to deep center, one to right-center, and one down the right field line.

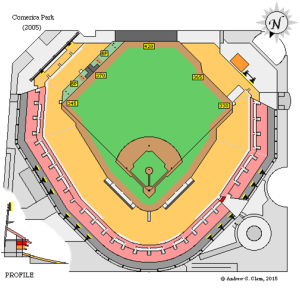
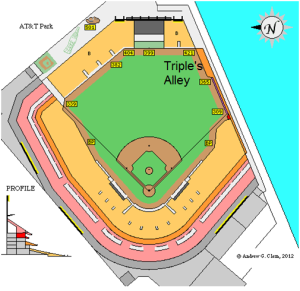
For reference, here are the stadium layouts for Comerica (where he’s hit 2 triples), AT&T Park, and Kauffman Stadium.

Comerica

ballpark

AT&T

triple7

Kauffman Stadium: has the largest outfield in major league baseball as measured by total square feet.

KauffmanStadium

Let’s start with the one triple hit to deep center that did not take place at Minute Maid and say that one took place at Comerica Park, since, like Minute Maid, Comerica has a cavernous center field.

1st Triple of the Year: 05/21 vs DET @ Comerica

triple6

Huzzah! That was kind of obvious and maybe shouldn’t have elicited a Tobias Funke jubilation, but the fact that we’re five for six does.

gattis_half_1.0

Let’s jump ahead to what should be considered the other obvious pick, his triple hit at AT&T park.  There’s a triple that was hit to right center and we’ll say this triple it was a throwback piece; inspired by his first triple in the bigs, in that it was hit to Triples Alley.

8th Triple of the Year: 08/11 vs SFG @ AT&T Park

triple8

This one is wrong and that stings because I felt like this one would’ve been obvious.

qzp-eX

I’m not sure how much of the ball Gregor Blanco gets when he leaps – he may have ultimately sandwiched the ball between his back and the wall – but it looks like he prevented an Evan Gattis HR; but still can’t prevent yet another Evan Gattis Triple.  We’re 5 out of 7.

So of the two triples left, there is one that goes to deep right-center, and one that scurries down a right-field line.  The ballparks left are Kauffman and Comerica.

We’ll play the odds and guess that the one down the right-field line is hit at Kauffman Stadium because it would make sense for the one to right-center to have ended up in that little enclave at Comerica.

6th Triple of the Season: 07/26 vs KCR @ Kauffman Stadium

Oddly enough there is no data for this on Brooks Baseball and there is also no GIF for this triple; Who’s padding the stats?? At least that builds some suspense…

2nd Triple of the Season: 05/24 vs DET @ Comerica

triple9

Wrong – which also makes us wrong on the triple hit at Kauffman so we miss the final 2 – “my bad”.

gattis_2.0

It looks like Rajai Davis was positioned towards the gap and therefore had to hunt this ball down while El Oso Blanco set the base paths aflame.

So our (my) final score is 5/9, which is good but not great considering my 100% accuracy prediction.  While I’m completely aware of the vast, expansive magnitude of my ignorance, I really did believe I could pick out where each of these 9 triples happened…it’s probably this same hubris that causes me to lose $3 daily over at Draft Kings.

Trying to elicit some meaning out of this article would be contrived, so I’ll just say (tongue-in-cheek-ly), Gattis is likely to experience some regression to the mean (whatever that mean is in regards to triples).  I can’t imagine a reality where Evan Gattis highlights aren’t home runs and continue to be centered around him tearing around the basepaths – his massive, rippling thighs simultaneously inspiring awe, terror, and a few chuckles among his teammates – but what do I know?  The last time I tried to predict something about Evan Gattis, I was only 55.6% right.


How Legit Is Carlos Correa?

Hearing Carlos Correa’s name can lead to polarizing reactions. If you’re one of the lucky few who managed to snatch him up in fantasy, then you celebrate every time he is mentioned. If you’re an Astros fan, I’d imagine you’d do the same, although being from New Jersey, I can’t say I actually know any Astros fans. However, if you’re not a part of one of those two groups, you’re probably asking “He can’t actually be this good, can he?”

Fortunately for me, I’m part of the group that owns him in fantasy. Because of this, I just want to enjoy the ride and not worry about whether it will end or not. With the fantasy trade deadline coming up though, it is something that I decided to look into. On a pace of 98 runs, 43 home runs, 115 RBIs, 17 steals, and a .297/.344/.573 slash line over a 162-game season, it’s hard to believe that he can keep that up.

First let’s take a look at the average. In 2014, at A+, Correa hit .325 with a .373 BABIP. You don’t expect a BABIP that high, but someone of his quality can certainly carry one over .320, so it’s at least not worrisome. This year, at AA, he actually improved on his average from a year ago, hitting .385 with a this time unsustainable .447 BABIP. He’s good, but not that good. This was evident upon his promotion to AAA, where he hit .276 with a .286 BABIP over 24 games. For someone only 20 years old and moving through the minors so fast, struggling (at least for his standard) was to be expected. In the majors though, he’s hitting a cool .297 with .312 BABIP, both seemingly in line with his career minor league numbers and looking like they will stay where they are.

Then there’s the OBP. Correa is reaching base at a .344 clip, which is actually lower than what he’s had at every level in the minors except for his 17-year-old debut season. His walk rate has decreased at each level, from 12.3% to 11.3% to 10.6% to the 6.7% it’s at right now. That’s concerning, but to be expected for such a young hitter moving up the ranks so quickly. His strikeout rate has also gone up to 19.1%, leaving his BB/K at an ugly .35. Without taking walks, it’ll be hard for Correa to continue getting on base at his current rate, but with the way he hits the ball and the lineup protection he has behind him, it’s hard to see his OBP dropping much below .340. Furthermore, if he keeps that high OBP and continues to bat in a top-4 spot (it’s hard to tell where he’ll bat in the lineup once George Springer returns from injury), his counting stats should have no problem continuing at their torrid pace as well.

It’s hard to believe anyone would have a question whether he could keep up his stolen-base production. He stole 18 bases earlier this year in the minors over 53 games while only being caught once. The year before that, he stole 20 bases in 62 games being caught 4 times. If anything, you’d expect Correa to actually have more stolen bases, but it’s hard to complain if he reaches the 15-steal mark.

The one thing that is probably the most in question is the power. His 24.5 HR/FB% would rank him 8th among qualified hitters, right below Mark Teixeira and above hitters like J.D. Martinez, Jose Abreu, Paul Goldschmidt, and Albert Pujols. Fortunately for Correa and his average, he sprays the ball around the field better than any of those players (even Martinez!), but that may not actually be helpful for his power as pulling the ball will generally produce more power. He also makes less hard contact than those above him on the HR/FB% leaderboard, which makes us question the number in the limited sample size we’ve seen.

In order to get a more accurate picture, I looked into the PITCHf/x data from baseball savant. Only 11 of Correa’s home runs were tracked this way, but that’ll have to do. According to the data, Correa actually had a higher average angle off the bat on his home runs, as well as a higher exit velocity (30.7 compared to 27.6 and 102.8 compared to 102.7). His batted ball distance, though, was shorter, calculating to 389 feet as opposed to the league average on home runs of 397.9 feet. While 10 feet is certainly meaningful, when combined with his better-than-average angle off the bat and exit velocity, it’s hard to credit too many of his home runs to luck. Even giving him 11 instead of 13 for the season, he’d still be on a 37 home run pace.

Getting away from the fancy numbers, the good news about all this is that Correa actually has an ISO that would be 6th best in the majors, due in large part to the 14 doubles he has collected alongside his 13 home runs. Correa’s power seems to be legit, and it wouldn’t be surprising to see him challenge for 30 home runs by the time the season is done.

After looking at the numbers, everything from Correa seems to check out, and it’s clear that he’s not just benefiting from luck. If he could achieve numbers even close to his pace, he already deserves to be called the best shortstop in the game. Over the past 10 years, the best offensive season by WAR for a shortstop came from Hanley Ramirez in 2008 when he had 125 runs, 33 home runs, 63 RBIs, 35 SBs, and a slash line of .301/.400/.540. Based on his prorated numbers, Correa could easily have that season next year, maybe with a few less stolen bases, a slightly lower OBP, and double the RBIs. Oh yeah, and he’s 20. Take that, Bryce Harper.


Why the Darlings of the AL are Not Ready for a Playoff Push

The 2015 MLB season has been filled with plenty of surprises thus far. The Twins have maintained their hot start, and currently hold the first wildcard spot in the AL. The NL Central has been highly competitive, with three teams in position to make the playoffs should the season end today. The Padres have been a huge disappointment (although I never fully bought into them), and may be sellers at the deadline just seven months after making the biggest splashes of the winter. Sleeper picks Cleveland and Seattle might as well have been asleep the first half of the year, both putting together extremely underwhelming performances and effectively ending their postseason hopes.

But no over- or under-achieving organization quite took the league by storm like the Houston Astros. They began the year hotter than any team in baseball besides St. Louis, finishing May with a record of 32-20 and a four-game lead over the second-place Angels. In their last 43 games, however, it has been a much different story. They have gone 20-23, enduring one seven-game losing streak in June, and they began the second half on a six-game losing streak (also losers of 8 of their last 9). Back in mid May, amidst all the frenzy over the already anointed playoff bound Astros, I began to wonder what was propelling this team to victory. It was clear that although their starting pitching doesn’t blow anyone away with immense velocity or stuff, they had a set of guys who were displaying that they knew how to pitch and could hold their own in a MLB rotation. Here are the splits on the Astros’ starting pitching, using May 31st as the divider.

Months ERA FIP K/9 BB/9 BABIP LOB%
March/April-May 4.08 3.75 6.45 2.46 0.298 70
June-All Star Break 4.03 3.54 8.04 3.13 0.299 70


I made sure that only active players on the Astros’ roster were included due to the fact that there are many insignificant players whose numbers would have been included in the splits because of spring training. The ERA and FIP numbers are very similar, as are the BABIP and LOB% stats. The two interesting changes are the increase in strikeouts and the simultaneous increase in walks. Walks lead to runs, and since the Astros have not been great offensively, the more free passes given out the more likely they will be playing from behind in games. While Dallas Keuchel has been extraordinary, and Lance McCullers has been solid as a rookie, their rotation doesn’t seem to have enough to strike fear into opposing team’s hearts (see 1990’s Atlanta Braves).

They do however appear to have a solid bullpen, possessing the 4th best ERA at 2.67 and the 4th best LOB% at 80%. Their recent scuffles have them at an overall record of 49-42, currently a half game back of the Angels. According to the computers, they have a 55.3% chance of making the playoffs in some capacity this year, and are expected to finish with a record of 84-78 — good enough to win a wild card spot. The computer’s calculations aren’t always perfect, so it is safe to say that there is definitely a margin of error here, although I cannot say for certain what that number might be (probably ±3-4 wins). Regardless of what the analysts are saying, I believe they WILL NOT make the postseason. Why? Because history is not on their side.

After a lot of hard work entering in all of the numbers by hand, I finally have created a table that houses several statistics from all playoff teams starting in 1995 when the wild card was introduced. Take a look at these numbers:


Name BA ISO K% BB% OBP
2015 Astros 0.240 0.178 24.8 8.2 0.307
1995-2014 Postseason Avg. 0.269 0.163 17.2 9.1 0.340
1995-2014 Postseason Min. 0.238 0.113 12.7 6.3 0.310
1995-2014 Postseason Max. 0.293 0.204 22.6 12.0 0.373


If the season were to end today, and the Astros made the playoffs, they would have some heavy outliers among the last 20 years worth of playoff teams. They would have the second lowest batting average, the highest K%, and the lowest OBP. Their ISO is well above average, but the fact that they run such a low OBP means that those extra base hits won’t increase their expected run totals very much; you need guys on base to score runs. Their average walk rate is to be expected based on the lineup they have assembled. They have a lot of what I would call “hackers,” guys who go up and take massive cuts trying to crush the ball — Chris Carter, Evan Gattis, Luis Valbuena, and Colby Rasmus to name a few. The only way this lineup gets worse in the ‘K’ department is if you bring Adam Dunn back from the dead and trade for Mark Reynolds. My point is simple: there has never been such a boom or bust type of team to make the playoffs, at least not one this extreme. Even if they were to acquire a frontline starting pitcher like Johnny Cueto or Cole Hamels, I do not believe that their lineup would be able to support the pitching staff enough to catapult them into the postseason.

Only time will tell what happens with the darlings of the MLB this season. They have a strong core, and a bright future, with many top prospects making their debut this season and even more right on the doorstep. Jeff Luhnow has done an incredible job building this team, and there is no doubt that they will be contenders in the AL West for many years to come. Yet, while they are not the same Astros of recent memory, they are not quite ready to make the postseason. This may not be a bad thing, though. As Yogi Berra once said, “You can observe a lot by watching.”


The Astros and Password Hygiene

Earlier this week, the New York Times reported on the FBI investigation of the Houston Astros’ compromised database and the current suspicion that the culprit are none other than the St. Louis Cardinals. The hacking of Houston’s proprietary in-house information sharing system, called Ground Control, caused major waves last year when Deadspin published excerpts from their internal discussions about players and trade negotiations. The Astros ended up with some egg on their face, and Jeff Luhnow was quoted as saying he was avoiding electronic communication during the early days of the known leak for fear that the Astros’ systems remained unsecured.

What is so shocking about the (alleged) penetration of the Astros’ systems by members of the Cardinals’ front office is that it does not appear to be a high-tech hack: according to the NYT, the likely intrusion vector was Astros’ general manager Jeff Luhnow’s own user credentials, which reused the same password that he had formerly used to access the Cardinals’ own proprietary system (codenamed Redbird) when he worked there.

Targeting credentials of users who reuse the same password to access multiple systems is a popular method of hacking. A surprising number of smart, highly-placed individuals (like Luhnow) often don’t perceive the risk that they take by using the same password across multiple accounts. Hackers look for sites and apps that have poor password security, steal the passwords from those less-secure places, and then test the passwords against higher-security systems. Some examples of poor password security practices include storing passwords in plain text in the database, not encrypting passwords with a one-way hash where the password can’t be taken back out of the database, or using an inexpensive encryption method that can easily be broken by throwing computing power at the problem. (The Cardinals were allegedly able to pull Luhnow’s password out of the database, so Redbird’s passwords were likely either stored in plain text or encrypted using a less-safe two-way encryption technique.)

Reusing passwords across multiple accounts is an example of poor “password hygiene”. As email addresses become increasingly popular as usernames, it has become easier to guess one half of the username-password credentials pair for a user of a site or application. The most effective strategy for proper password hygiene is to use a unique password for every account you have and to use a password manager to securely store those credentials. I use 1Password because it works on Mac, PC, iOS, and Android and stores credentials on my own devices rather than on someone else’s server, but there are plenty of other popular solutions such as LastPass, KeePass, and Dashlane.

An additional strategy for improved security is two-factor authentication (2FA). The idea behind 2FA is that you authenticate yourself with “something you know” (your password), and “something you have” (your phone). The second part can be a text message that’s sent to you when you log in, or a special code that is generated every few seconds that you can use as a sort of second password. Those special codes are generated using a hardware device (if you’ve ever seen an RSA keychain token, that’s an example of hardware 2FA) or by a software app such as Google Authenticator or Authy. 2FA helps protect you against someone stealing your password, because unless they also have your mobile phone, they can’t get into your accounts. Many sites feature 2FA as an option, and the list continues to grow.

My last piece of advice is to rotate passwords on a regular basis. 1Password reminds me when a given password has been in use for too long, and I can go ahead and change it. (It even flags accounts that have had reported breaches, which is a great help.) If Jeff Luhnow had been rotating his password regularly, even though the Cardinals (or whoever the bad guys were) started out with his credentials, they would have lost access whenever he rotated, which helps stop the bleeding of confidential information.

If you think you’re not important enough to be hacked, it can be an ugly surprise to discover that hackers target everyone. The consequences of sloppy hygiene could be your bank account being drained, your Gmail messages or your wedding photos being deleted, or your Facebook account being seized. These things happen to “normal” people every day. The additional effort for a little bit of extra security goes a very long way. The bad guys are often looking for the easiest targets. Making yourself a little harder to attack is the first line of defense.