Stars and Scrubs Forever
This post was originally from my website thekzonenews.wordpress.com, and one image is courtesy of fivethiryeight.com
Every offseason, each team’s GM and front office has a choice to make: should we stock up on depth, or go sign the big fish on the free agent market? Recently, as Travis Sawchik of FanGraphs pointed out, teams have been trending towards the depth route, but when it comes to free agent hitters, teams are far better off allocating their money towards just a few stars. Here’s why:
I. Depth-based teams perform no better than Stars and Scrubs teams
Back in 2014, Jonah Keri and Neil Paine from FiveThirtyEight did some research (they, in turn, cite FanGraphs) to show that the way a roster is constructed has little effect on how it performs. Here is the chart they produced based on the data they found: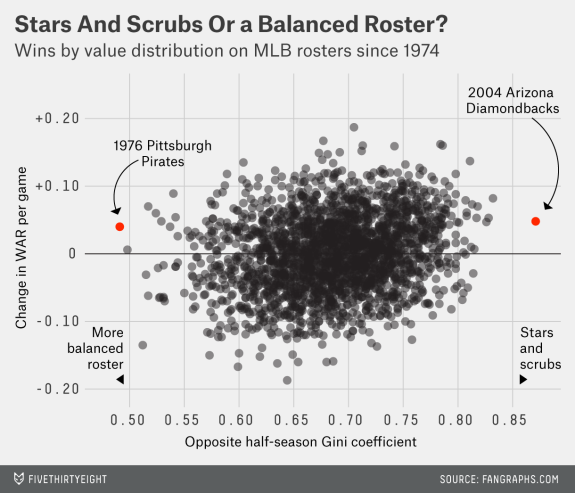
On their chart’s x-axis, the data shows how balanced a team is, while on the y-axis, the chart displays how well the team performed. While the article makes sure to note that at the highest extremes, depth works, there is not an overall trend to be found. The teams who had the most total contributions from the sum of their players did the best, whether that came concentrated on a few superstars or it came from every individual. And, when one thinks about it, it makes sense that neither strategy would be perfect. Banking on a few players seems to come with risks of health, but at the same time if they can stay healthy, those stronger players may be more consistent. Jonah and Neil also make an interesting point with regards to the trade deadline and further roster building after its base: It’s far easier and cheaper to replace a scrub at second base or left field with an average player than to replace an average player with a star.
So, to be clear, there is little correlation between how a team spreads out their roster and how well they do in a season. Both have advantages, and both have disadvantages, which turn out to be pretty equal, as shown by the data. The battle then becomes about value, which I wrote a little about with regard to the current free agent class. Between two teams that get equal contributions from the sum of their players, which roster construction type is cheaper? With the exception of an especially greedy owner, the team who chooses the more cost-efficient makeup should be able to afford an extra player for the same price, pushing them just over their competitor.
II. Stars and Scrubs is a more cost-efficient method of roster construction than Depth
To find this information, I built a Python program that looks at tabular data from FanGraphs and MLB Trade Rumors. Along the x-axis of my program’s graph (below) is the WAR of various position players in their contract years, and along the y-axis is the average annual value of the contract they proceeded to sign. Using a polynomial regression model, I made a curve of best fit (in red), which should show about how much it would cost annually to sign a player of each WAR value. 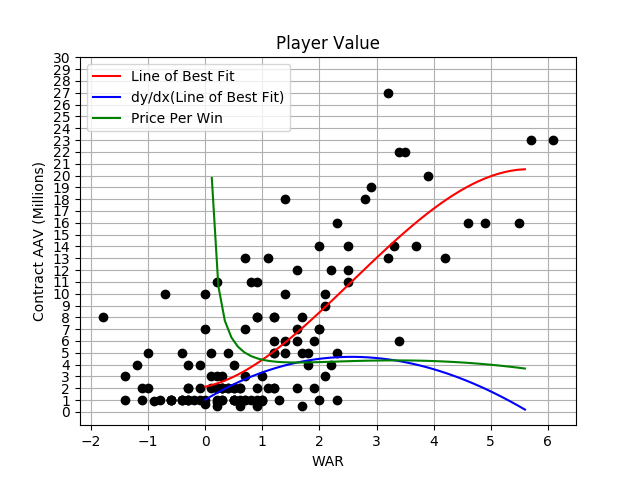
The basic red curve takes on the form of an inverse cube function, steep in the middle stretching out lengthwise on either end. That means it costs more money to tack on an extra share of a win to an average player than to a great or a poor player. That concept is best illustrated by the blue graph (the red line’s derivative), which peaks at a 2.51-win player, just above average (2.0), meaning each extra part of a win you want to add is most expensive for players with a WAR between 2 and 3.
The green money line, however, is the most important, and you don’t need calculus to understand it. Let’s zoom in a little.
On the x-axis is the total WAR that a free agent accumulated last season, and on the y-axis is the amount of money that each of those wins costs (contract AAV divided by the WAR contribution). The math says that as a player’s WAR approaches zero, their price approaches infinity, but we’ll assume that a team can get a replacement level player for the MLB minimum wage, around $500,000. The lesson there is simply that buying a player with a WAR under 1.0 is a bad idea (but does buying a player with a negative WAR earn you money per win?). A 1.0-WAR player starts out as a rip-off per win, but the value quickly rises. A 1.6-WAR player represents the local minimum in cost per win, at only $4.18MM. The price of a win then starts to rise again for the average and above average athletes, hitting a local maximum of $4.35MM per win for a 3.3-WAR player. But then, as foreshadowed by the plateauing of the red curve and decrease in the blue curve, the green curve begins to drop. By the time it hits a 5.5-WAR player, a win only costs $3.66MM, which is as far as the data will take the line without overfitting the smaller sample up top.
The local minimum at 1.6 WAR is important for a team that only has money for maybe one very minor investment (namely, do not invest in a below-great player worth much more than 1.6 WAR, or much below, because teams can always promote or claim 0.0 WAR players for minimum wage), but the ever-decreasing price tag per win of the best players is the most important part. To be a top-hitting team in 2017, the nine players in your lineup needed to total around 27 WAR for the season — on average 3 WAR per player. To build this kind of roster of pure depth, that is every player is equal, each player would command an average annual value of $12.9 million, for a total cost of $116.1MM. However, a team who builds their 27 WAR with five 5.5 WAR hitters and four replacement level hitters will only spend $102.5MM. If they want to spend the same amount of money as the first team, they could add an extra 3.25 WAR bat, making their team superior (that’s the difference between the Cardinals’ and Mets’ offense, or the Diamondbacks’ and Braves’ offense) to their depth-based counterpart.
If you exclude the ability to add replacement level players for minimum, a big advantage for more extreme stars and scrubs teams is keeping payroll down. Here are the total payrolls of various 27-WAR roster constructions, with the deeper ones at the top and the shallower ones at the bottom:
| Lineup Makeup | Payroll |
| 9x 3 WAR | $116.1MM |
| 4x 3.5 WAR, 4x 2.5 WAR, 1x 3 WAR | $117.7MM |
| 4x 4 WAR, 4x 2 WAR, 1x 3 WAR | $116.5MM |
| 4x 4.5 WAR, 4x 1.5 WAR, 1x 3 WAR | $103.7MM |
| 4x 5 WAR, 4x 1 WAR, 1x 3 WAR | $103.3MM |
| 4x 5.5 WAR, 4x 0.5 WAR, 1x 3 WAR | $105.3MM |
There’s a sudden drop-off in payroll once a team gets below a certain amount of depth, which coincides with both the part of the green graph at the end that becomes a really steep downhill and the part of the small valley in the beginning of the curve. If it didn’t already seem clear, this should answer up any questions. A stars and scrubs roster provides much more value for a team than a depth-based one, allowing them additional payroll space to add better players. The FiveThirtyEight data from Part I showed that roster makeup does not affect team record, and that team talent was decided purely based on how good the sum of the players are. By saving money through a stars and scrubs construction, a team can add more good players, therefore adding to that sum, and becoming the better team.
III. Conclusion
The collected data shows a lot, but it’s far from perfect. For starters, I only focus on WAR, which is a terrific statistic, but is in no way completely tell-all (I’ve written about the topic in the past). Additionally, I only look at FanGraphs’ fWAR, which is only 1/3 of the WAR story. Furthermore, the method assumes that free agents will replicate their previous season during the years of their contract, ignoring aging curves, or at least that teams assume they will. Anyone who follows baseball at all knows this is far from the truth. Teams know free agents are incredibly risky commodities, and the suggestion that a team would consider building a roster entirely out of free agents is kind of ridiculous. This is especially true for superstar free agents, who will require a longer commitment than average ones. The best method of player acquisition for value and talent has been, is, and will probably always be player development. That said, a made-up model of teams acquiring only free agents works well to represent a more realistic model, when a team might have to decide if it wants to allocate a small part of the budget to a few hitters, or only one hitter. Finally, the study only looks at hitters. An analysis of pitchers would need a whole new article.
At first, the suggestion that the best teams should be superstar-driven is a little depressing. It’s fun to watch stars play, but part of the beauty of the game is that everyone is the lineup has the same chance to make a contribution. But one could also look at the findings in a much more positive light. Rebuilding teams don’t need every single prospect around the diamond to work out. Having just a few players break out in superstar fashion (e.g. the 2017 Yankees, who continue to add more superstar power) can make a team instantly competitive. Signing just one or two big free agents (teams are shying away, but J.D. Martinez plus Eric Hosmer could turn any franchise around if they continue to grind after signing) can turn a mediocre roster into a World Series contender. It’s all very good for the parity of the game. The power of just one or two stars can light up a whole team.
A very good analysis, and the most important point bears highlighting:
these teams all cost roughly the same, but a stars and scrubs team is much easier and cheaper to improve.
There is one other important benefit to stars and scrubs that is not mentioned – game strategy.
A star gets to hit more at the top of a lineup, and a weak spot can use platoons or pinch hitters to add value.
” Mike Trout and the seven dwarfs ” might be pushing this idea too far, because of intentional walks and limited roster space to platoon, and the fact that he will often hit with the bases empty. But factoring in game play makes a few excellent hitters and a few weak hitters more valuable when compared to a balanced team than any “30,000 feet” analysis would show.