Pitch Count Trends – Why Managers Remove Starting Pitchers
I. Introduction
A starting pitcher should have the advantage over opposing batters throughout a baseball game, yet as he pitches further into the game this advantage should slowly decrease. The opposing manager hopes that his batters can pounce on the wilting starting pitcher before his manager removes him from the game. But what would we see if the manager decided against removing his starting pitcher? The goal of this analysis is to determine the consequences of allowing an average starting pitcher to pitch further into the game instead of removing him. There are several different ways this situation can unfold for a starting pitcher, but we should be able to tether our expectations to that of an average starting pitcher.
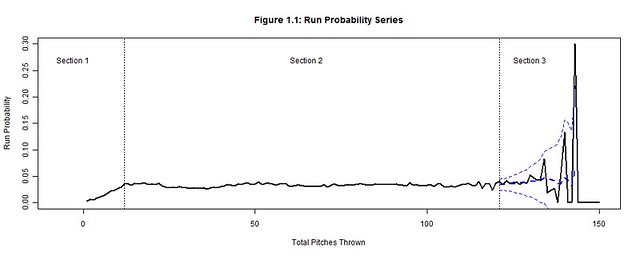
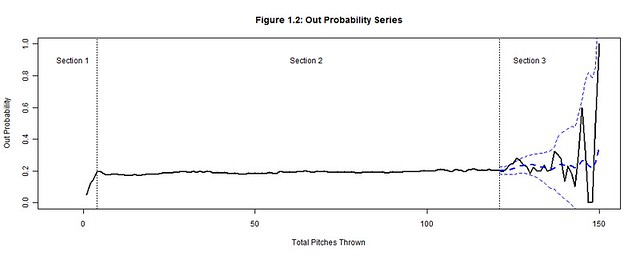
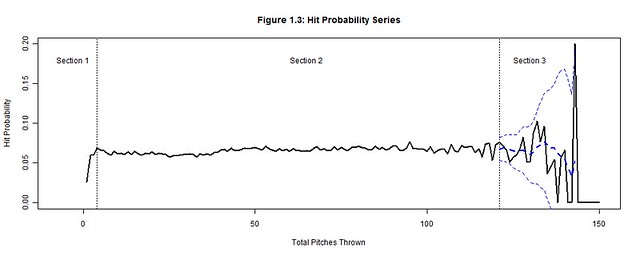
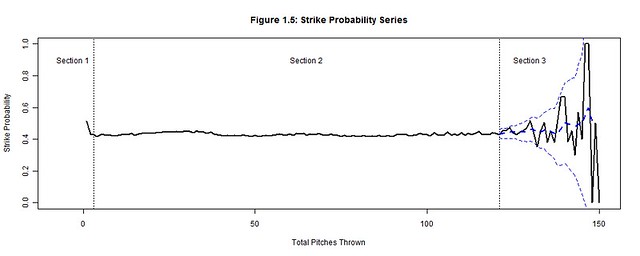
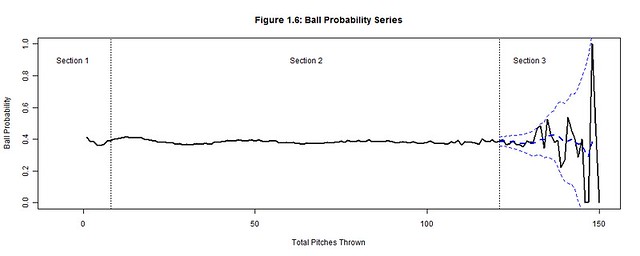
We will focus on how the total pitches thrown by starting pitchers (per game) affects runs, outs, hits, walks, strikes, and balls by analyzing their corresponding probability distributions (Figures 1.1-1.6) per pitch count; the x-axis represents the pitch count and the y-axis is the probability of the chosen outcome on the ith pitch thrown. Each plot has three distinct sections: Section 3 is where the uncertainty from the decreasing pitcher sample sizes exceeds our desired margin of error (so we bound it with a confidence interval); Section 1 contains the distinct adjustment trend for each outcome that precedes the point where the pitcher has settled into his performance; Section 2, stable relative to the others sections, is where we hope to find a generalized performance trend with respect to the pitch count for each outcome. Together these sections form a baseline for what to expect from an average starting pitcher. Managers can then hypothesize if their own starting pitcher would fare better or worse than the average starting pitcher and make the appropriate decisions.

II. Data
From 2000-2004, 12,138 MLB games were played; there should have been 12,150 games but 12 games were postponed and never made up. During this period, starting pitchers averaged 95.12 pitches per game with a standard deviation of 18.21. The distribution of pitch counts is normal with a left tail that extends below 50 pitches (Figure 2). It is not symmetric about the mean because a pitcher is more likely to be inefficient or injured early (left tail) than to exceed 150 pitches. In fact, no pitcher risked matching Ron Villone’s 150 pitch count from the 2000 season.

This brief period was important for baseball because it preceded a significant increase in pitch count awareness. From 2000-2004, there averaged 192 pitching performances ≥122 pitches per season (Table 2); 122 is the sampling threshold explained in the next section. Since then, the 2005-2009 seasons have averaged only 60 performances ≥122 pitches per season. This significant drop reveals how vital pitch counts have become to protecting the pitcher and controlling the outcome of the game. Now managers more frequently monitor their pitchers’ and the opposing pitchers’ pitch counts to determine when they will expire.
Table 2: 2000-2009 Starting Pitcher Pitch Counts ≥122
|
Year |
2000 |
2001 |
2002 |
2003 |
2004 |
2005 |
2006 |
2007 |
2008 |
2009 |
|
Pitch Counts ≥122 |
342 |
173 |
165 |
152 |
129 |
81 |
70 |
51 |
36 |
62 |
III. Sampling Threshold (Section 3)
122 pitches is the sampling threshold deduced from the 2000-2004 seasons (and the pitch count minimum established for Section 3), but it is not necessarily a pitch count threshold of when to pull the starting pitcher. Instead this is the point when starting pitcher data becomes unreliable due to sample size limitations. Beyond 122 pitches, the probabilities of Figures 1.1-1.6 violently waver high and low as very few pitchers threw more than 122 pitches. A smoothed trend, represented by a dashed blue line and bounded by a 95% confidence interval was added to Section 3 of Figures 1.1-1.6 to contain the general trend between these rapid fluctuations. But the margin of error (the gap between the confidence interval and the smoothed trend) grows exponentially beyond 3%, so the actual trend could be anywhere within this margin. Thereby, we cannot hypothesize whether it is more or less likely that the pitcher’s performance will excel or plummet after 122 pitches.
To understand how the 122 sampling threshold was determined, we first extract the margin of error formula (e) from the confidence interval formula (where zα/2 = z-value associated with the (1-α/2)th percentile of the standard normal distribution, S = standard error of the sample population, n = sample size, N = population size):

Next, we back-solve this formula to find the maximum sample size n for when the margin of error exceeds 3%; we use S = 0.5, z2.5% = 1.96, N = 2 pitchers × 12,138 games = 24,276:

There is no pitch count directly associated with the sample size of 1,022, but 1,022 can be bounded between the 121 (n=1,147) and 122 (n=971) pitch counts. At 121 pitches the margin of error is still less than 3%, but it becomes greater than 3% at 122 pitches and begins to increase exponentially. This is the point the sample size becomes unreliable and the outcomes are no longer representative of the population. Indeed only 4% (971 of 24,276) of the pitching performances from 2000-2004 equaled or exceeded 122 pitches thrown in a game (Figure 3).

A benefit of the sampling threshold is that it separates the outcomes we can make definitive conclusions about (<122 pitches) from those we cannot (≥122 pitches). If were able to increase the sampling threshold another 10 pitches, we could make conclusions about the throwing up to 131 pitches in a game. However, managers will neither risk the game outcome nor injury to their pitcher to accurately model their pitcher’s performance at high pitch counts. Instead, the sampling thresholds have steadily decreased since 2005 and the 2000-2004 period is likely the last time we’ll be able to make generalizations about throwing 121 pitches in a game.
Yet, even for the confident manager, 121 pitches is still a fair point in the game to assess a starting pitcher. Indeed the starting pitcher must have been consistent and trustworthy to pitch this deep into the game. But if the manager wants to allow his starting pitcher to continue pitching, he is only guessing that this consistency will follow because there is not enough data to accurately forecast his performance. Instead he should consider replacing his starting pitcher with a relief pitcher. The relief pitcher is a fresh arm that offers less risk; he must have a successful record based on an even smaller sample size of appearances, smaller pitch counts, and a smaller margin of error. The reliever and his short leash are the surer bet than a starting pitcher at 122 pitches.
IV. Adjustment Period (Section 1)
The purpose of the adjustment period is to allow the starting pitcher a generous period to find a pitching rhythm. No conclusions are made regarding the probabilities in the adjustment period as long as an inordinate amount of walks, hits, and runs are not allowed. The most important information we can impart from this period is the point when the adjustment ends. Once the rhythm is found, we can be critical of a pitcher’s performance and commence the performance trend analysis.
In order to be effective from the start, starting pitchers must quickly settle into an umpire’s strike zone and throw strikes consistently; most pitchers do so by the 3rd pitch of the game (Figure 1.5). Consistent strike throwing keeps the pitcher ahead in the count and allows him to utilize the outside of the strike zone rather than continually challenging the batter in the zone. Conversely, a pitcher must also include (pitches called) balls into his rhythm, starting approximately by the 8th pitch of the game (Figure 1.6). Minimal ball usage clouds the difference between strikes and balls for the batter while frequent usage hints at a lack of control by the pitcher. Strikes and balls furthermore have a predictive effect on the outcomes of outs, hits, runs, and walks: a favorable count for the batter forces the pitcher to deliver pitches that catch a generous amount of the strike zone while one in favor of the pitcher forces the batter to protectively swing at any pitch in proximity of the strike zone.
On any pitch, regardless of the count, the batter could still hit the ball into play and earn an out or hit. Yet as long as the pitcher establishes a rhythm for minimizing solid contact by the 4th pitch of the game (Figure 1.2-1.3), he can decrease the degree of randomness that factors into inducing outs and minimizing hits. A walk contrarily cannot occur on any pitch because walks are the result of four accumulated balls. Pitchers should settle into a rhythm of minimizing walks by using minimal ball usage; so when the ball rhythm stabilizes (on the 8th pitch of the game) the walk rhythm also stabilizes (Figure 1.4). After each of these rhythms stabilizes, a rhythm can be established for minimizing runs (a string of hits, walks and sacrifices within an inning) by the 12th pitch of the game (Figure 1.1). It is possible for home runs or other quick runs to occur earlier, but pitchers who regularly put their team in an early deficit are neither afforded the longevity to pitch more innings nor the confidence to make another start.
V. Performance Trend (Section 2)
Each of the probability distributions in Figures 1.1-1.6 provides a generalized portrayal of how starting pitchers performed from 2000-2004, but in terms of applicability they do not depict how an average starting pitcher would have performed. Not all pitchers lasted to the same final pitch (Figure 2). The better a pitcher performed the longer he should have pitched into the game, so we would expect each successive subset of pitchers (lasting to greater pitch counts) to have been more successful than their preceding supersets. Thereby, in order to accurately project the performance of an average starting pitcher the probability distributions need to be normalized, by factors along the pitch count, as if no pitchers were removed and the entire population of pitchers remained at each pitch count.
The pitch count adjustment factor (generalized for all pitchers) is a statistic that must be measurable per pitch rather than tracked per at-bat or inning, so we cannot use batting average, on-base percentage, or earned run average. The statistic should also be distinct for each outcome because a starting pitcher’s ability to efficiently minimize balls, hits, walks, and runs and productively accumulate strikes and outs are skills that vary per pitcher. Those who are successful in displaying these abilities will be allowed to extend their pitch count and those who are not put themselves in line to be pulled from the game.
We accommodate these basic requirements by initially calculating the average pitches per outcome x, Rx(t), for any pitcher who threw at least t pitches (where PCt = sum of all pitch counts and xt = sum of all x for all pitchers whose final pitch was t):

This statistic, composed of a starting pitcher’s final pitch count divided by his cumulative runs allowed (or the other outcome types), distinguishes the pitcher who threw 100 pitches and allowed 2 runs (50 pitches per run) versus the pitcher with 20 pitches and 2 runs (10 pitches per run). At each pitch count t, we calculate the average for all starting pitchers who threw at least t pitches; we combine their various final pitch counts (all ≥t), their run totals (occurring anytime during their performance), and take a ratio of the two for our average. At pitch count 1, the average is calculated for all 24,276 starting pitcher performances because they all threw at least one pitch; the population of starting pitchers allowed a run every 32.65 pitches (Table 5.1). At pitch count 122, the average is calculated for the 971 starting pitcher performances that reached at least 122 pitches; this subset of starting pitchers allowed a run every 57.75 pitches per game.
Table 5.1: 2000-2004 Pitches per Outcome
|
Pitch Rate |
Pitches per Outcome |
Pitches per Outcome |
| Pitches per Run |
32.65 |
57.75 |
| Pitches per Out |
5.37 |
5.57 |
| Pitches per Hit |
15.44 |
20.38 |
| Pitches per Walk |
45.05 |
44.03 |
| Pitches per Strike |
2.38 |
2.23 |
| Pitches per Ball |
2.64 |
2.62 |
Starting pitchers will try to maximize the pitches per outcome averages for runs, hits, walks, and balls while minimizing the probabilities of these outcomes, because the pitches per outcome averages and the outcome probabilities have an inverse relationship. Conversely, starting pitchers will also try to minimize the pitches per outs and strikes while trying to maximize these probabilities for the same reason. Hence, we must invert the pitches per outcome averages into outcomes per pitch rates, Qx(t), to be able to create our pitch count adjustment factor, PCAx(t), that will compare the change between the population of starting pitchers and the subset of starting pitchers remaining at pitch count t:

The ratio of change is calculated for each outcome x at each pitch count t. The pitch count adjustment factor, PCAx(t), will scale px(t), the original probability of x from the starting pitchers at pitch count t back to the expected probability of x for an average starting pitcher from the entire population of starting pitchers at pitch count t.
The increases to the pitches per run and pitches per hit rates strongly suggest that the 971 starting pitchers remaining at 122 pitches were more efficient at minimizing runs and hits than the overall population of starting pitchers. The population performed worse than those pitchers remaining at 122 pitches by factors of 176.85% and 131.98% with respect to the runs per pitch and hits per pitch rates (Table 5.2). Thereby, we would expect the probability of a run to increase from 3.40% to 6.01% and the probability of a hit to increase from 7.21% to 9.51% if we allowed an average starting pitcher from the population of starting pitchers to throw 122 pitches.
Table 5.2: 2000-2004 Average Pitcher Probabilities at 122 Pitches
|
Outcome |
Original Pitcher Probability |
Pitch Count Adjustment |
Average Pitcher Probability |
| Run |
3.40% |
176.85% |
6.01% |
| Out |
19.26% |
103.77% |
19.98% |
| Hit |
7.21% |
131.98% |
9.51% |
| Walk |
3.50% |
97.72% |
3.42% |
| Strike |
45.21% |
93.78% |
42.40% |
| Ball |
39.44% |
99.21% |
39.13% |
We apply the pitch count adjustment factors, PCAx(t), at each pitch count t to each of the original outcome probability distributions (black) to project the average starting pitcher outcome probabilities (green) for Section 2 (Figures 5.1-5.6); the best linear fit trends (dashed black and green lines) are also depicted. The reintroduction of the removed starting pitchers noticeably worsened the hit, run, and strike probabilities and slightly improved the out probability in the latter pitch counts. There were no significant changes to ball and walk probabilities. These are the general effects of not weeding out the less talented pitchers from the latter pitch counts as their performances begin to decline.
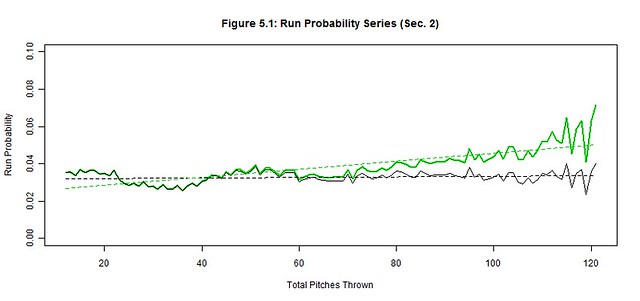

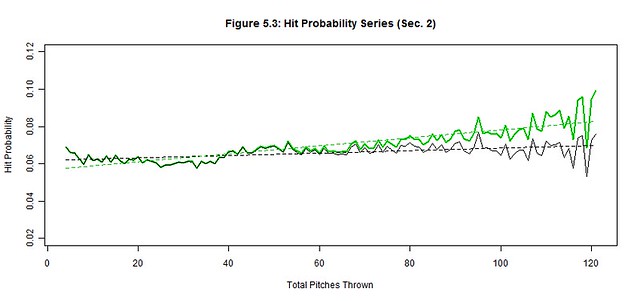
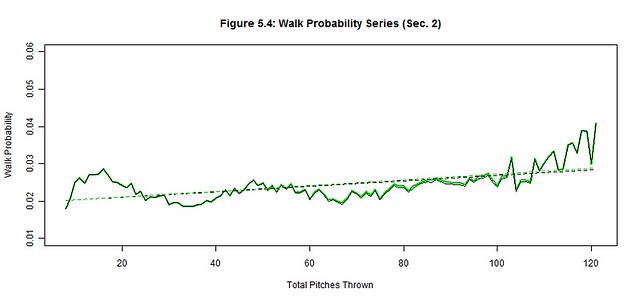
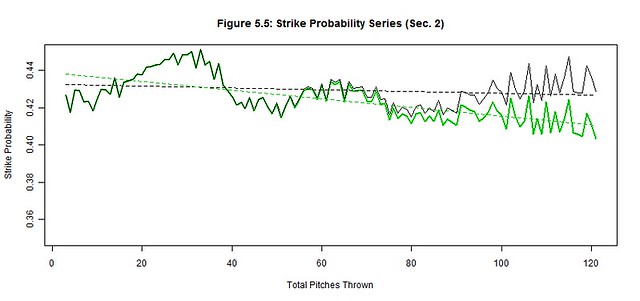
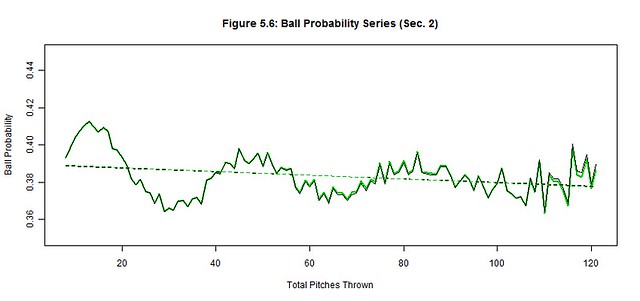
Next we quantify our observations by estimating the linear trends of each original and average pitcher series and then compare their slopes (Table 5.3). The linear trend (where t is still the pitch count) provides a simple approximation of the general trend of Section 2 while the slope of the linear trend estimates the deterioration rate of the pitcher’s ability to control these outcomes. The original pitcher trends show that the way managers managed pitch counts, their starting pitchers produced relatively stable probability trends as if the pitch count little or no effect on their pitchers; only the out trend changed by more than 1% over 100 pitches (2.00%). Contrarily, the average pitcher trends increased by more than 2% over 100 pitches for the run, out, hit, and strike trends, indicating a possible correlation between the pitch count and the average pitcher performance; the walk and ball trends were unchanged from the original to the average starting pitcher.
We must also measure these subtle changes between the original and average trends that occur in the latter pitch counts of Figures 5.1-5.6. There is rapid deterioration in the ability to throw strikes and minimize hits and runs between the original and average starting pitchers as suggested by the changes in slope. The 368.21% change in the strike slopes clearly indicates that fewer strikes are thrown by the average starting pitcher in the latter pitch counts. The factors of 222.53% and 1206.13% for the respective hit and run slopes indicate that the average starting pitcher is not only giving up more hits but giving up more big hits (doubles, triples, home runs). There is a slight improvement in procuring an out (14.45%), but the pitches that were previously strikes became hits more often than outs for the average starting pitcher. Lastly, the abilities to minimize balls (4.87%) and walks (8.23%) barely changed between pitchers, so control is not generally lost in the latter pitch counts by the average starting pitcher. Therefore, the average starting pitcher isn’t necessarily pitching worse as the game progresses but the batters may be getting better reads on his pitches.
Table 5.3: Section 2 Linear Trend
|
Linear Trend |
Correlation |
|||||
|
Trend |
Range |
Original |
Average |
% Change in Slope |
Original Pitcher |
Average Pitcher |
| Run Probability |
[12,121] |
0.03+0.16×10⁻⁴t |
0.02+2.13×10⁻⁴t |
1206.13% |
0.17 |
0.8 |
| Out Probability |
[4,121] |
0.18+2.00×10⁻⁴t |
0.18+2.30×10⁻⁴t |
14.45% |
0.75 |
0.76 |
| Hit Probability |
[4,121] |
0.06+0.66×10⁻⁴t |
0.06+2.12×10⁻⁴t |
222.53% |
0.54 |
0.85 |
| Walk Probability |
[8,121] |
0.02+0.74×10⁻⁴t |
0.02+0.78×10⁻⁴t |
4.87% |
0.57 |
0.6 |
| Strike Probability |
[3,121] |
0.43-0.50×10⁻⁴t |
0.44-2.33×10⁻⁴t |
368.21% |
-0.19 |
-0.7 |
| Ball Probability |
[8,121] |
0.39-0.97×10⁻⁴t |
0.39-1.05×10⁻⁴t |
8.23% |
-0.29 |
-0.32 |
The correlation coefficients also support our assertion that the average starting pitcher became adversely affected by the higher pitch counts, but even the original starting pitcher showed varied signs being affected by the pitch counts. There were moderate correlations between the pitch count and hit and walks and a very strong correlation between the pitch count and outs. So even though some batters improved their ability to read an original starting pitcher’s pitches, this improvement was not consistent and the increases to hits and walks were only modest. Contrarily, the original starting pitcher did become more efficient and consistent at procuring outs as the pitch count increased. We also found weak correlations between the pitch count and strikes and balls for the original starting pitcher, so strikes and balls were consistently thrown without any noticeable signs of being affected by the pitch count. However, out of all of our outcomes, the pitch count of the original starting pitcher had the weakest correlation with runs. Either the original starting pitchers could consistently pitch independent of the pitch count or their managers removed them before the pitch count could factor into their performance; the latter most likely had the greater influence.
It is also worth noting the intertwined patterns displayed in Figures 5.1-5.6 and Table 5.1. Strikes and balls naturally complement each other, so it should come as no surprise that the Strike Probability Series and Ball Probability Series also complement each other; a peak in once series is a valley in the other and vice-versa. The simple reason is that strikes and balls are the most frequent and largest of our outcome probabilities – they are used to setup other outcomes and avoid terminating at-bats in one pitch. However, fewer strikes and balls are thrown in the latter pitch counts as evidenced by the decline in the Strike and Ball Probability Series, which make the at-bats shorter. Consequently, there are fewer pitches thrown between the outs, hits, and runs, so these other probability series increase. Hence, the probabilities of outs, hits, and runs become more frequent per pitch as the pitch count increases (further supported by the drop in pitches per strike and ball rates in Table 5.1).
VI. Conclusions
Context is very important to the applicability of these results, without it we might conjecture that these trends would continue year over year. Yet, the 2000-2004 seasons were likely the last time we’ll see a subset of pitchers this large pitching into extremely high pitch counts. Teams are now very cautious about permitting starting pitchers to throw inconsequential innings or complete games, so the recent populations of starting pitchers have shifted away from the higher pitch counts and throw fewer pitches than before. Yet, these pitch count restrictions should not affect the stability of our original probability trends. The sampling threshold will indeed lower and the length of stable Section 2 will shorten, but the stability of the current original trends should not compromise. Capping the night sooner for the starting pitchers only means they are less likely to tire or be read by batters.
We also cannot generalize that these original probability trends would be stable for any starting pitcher. The probability trends and their stability are only representative of the shrinking subset of starting pitchers before their managers removed them due to performance issues, injury, strategy, etc. These starting pitchers subsets may appear unaffected by the pitch count, but their managers created this illusion with the well-timed removal of their starting pitchers. They understand the symptoms indicative of a declining pitcher and only extend the pitch count leash to starting pitchers who have shown current patterns of success. Removing managers from the equation would result in an increased number of starting pitchers faltering in the latter pitch counts as their pitches are better read by batters. Likewise, any runners left on base by the starting pitcher, but now the responsibility of a relief pitcher, would have an increased likelihood of scoring if the starting pitchers were not removed as originally planned by their managers. Starting pitchers do notice these symptoms and may gravitate to finishing another inning, but each additional pitch could potentially damage the score significantly. Trust in the manager and let him bear the responsibility at these critical points.
Holy shit
This is incredibly in depth. Want to make sure I am following. The green lines are basically an adjustment for survivorship bias?
How do you think about the game situation when starters are taking out? i.e. Runners on base, splits vs upcoming batters…
Yes, @BillbutnotTed, the purpose of Section V is to remove the survivorship bias; the green lines are these adjusted probabilities. By doing so, this uncovered one of my key findings that pitchers generally do not pitch less accurately as the pitch count increases; rather the batters begin to get better reads on their pitches and make better contact.
The game situation for when the starters are removed is generalized in this study. But it may be worth plotting the probabilities of different game situations when the starting pitcher is removed (or when runs occur) as the pitch count increases.