The NL Has Been Really Bad in 2017

There is always a lot of talk about the AL being better and the interleague record usually supports that, but this year it seems to be especially severe. The AL is once again dominating IL play and there might be some scheduling and market-size reasons for this, but also when looking at other factors the AL seems to be much better.

The number of very bad teams:

KC and Oakland have been quite bad, but still the three worst records belong to NL teams.  If you look at below .450 teams you have only the two mentioned teams in the AL, but six teams in the NL.  And that is with the Brewers as one total rebuild team actually over-performing. If you look at the teams that even try to compete you have the Braves, Padres, Phillies, Reds and Brewers as full rebuilders while in the in the AL only the White Sox are fully committed to rebuilding. Now you could say that the A’s and Royals should do a full rebuild but the same could be said for the Marlins. However you slice it, there are way more non-competitive teams in the NL than in the AL.

The WC Contenders:

There is a weak division too in the AL with the West, but there are still at least five somewhat credible WC contenders including all AL East teams and probably one of the Twins or Tigers.

In the NL that field has been thinned out to the Cards and the two overperforming West teams (although the Cards, like the Tigers and Twins, are basically projected as .500 teams now).

Now the Dodgers and Nats are really good but even the third supposedly great team, the Cubs, has been mediocre, albeit they should win the division rather easily considering the abysmal state of their division.

Overall the AL seems to be in a much better state as both the East and the Central division of the NL are in a really bad state.

There is hope of course as the Braves,  Brewers, Phillies and even Padres have some good young players and minor league prospects and the Reds have some big league success with position players that were somewhat unlikely prospects, but all of those teams still have ways to go.

Read the rest of this entry »


Marco Estrada Might Be Getting Better

Marco Estrada has a .302 BABIP. If you don’t know, Estrada has been one of the best pitchers at limiting batting average on balls in play. Of the 41 qualified pitchers who have at least 750 innings pitched throughout their career, Estrada has the sixth-worst BABIP difference this season relative to his career.

Despite this increase, Estrada has managed a 3.86 ERA. It’s not great but it ranks 43rd among qualified pitchers (90) this season. Marco’s 3.59 FIP ranks 25th, one of the more intriguing developments of this season. From 2015-2016, Estrada had the second-largest difference between his FIP and ERA, behind only Dan Haren, who did not pitch in 2016.

One of the game’s better contact managers, Marco Estrada looks to be adapting. The Blue Jays ace has the best strikeout-to-walk ratio of his career thus far. Estrada has the thirteenth-best strikeout percentage this season, sandwiched between Cardinals ace Carlos Martinez and Nationals pitcher Stephen Strasburg. There are 45 pitchers who qualified for the leaderboards for the past two seasons, only six of which had a greater K/9 increase. Driving this increase looks to be the change.

Estrada’s changeup is one of the best in the league. It’s not a hard change like Stephen Strasburg’s; rather the second-slowest in the league, ahead of only Jered Weaver. There are a couple of factors that make Estrada’s changeup one of the best. Foremost, it comes with an 11 MPH separation between his fastball, making it great for generating whiffs. Furthermore, his release points allow him to deceive batters. The pitch comes from a similar angle as the fastball but travels 10+ MPH slower, making it more difficult to pick up. If you’re thinking the fastball is coming, and a split-second later you realize it’s much slower, by then you’ve already swung as the ball goes right by you. Lastly, the pitch gets little drop. Estrada’s vertical movement on the changeup was 2.56 inches higher than the next right-hander, Chase Anderson. This is another problem for the hitter as the pitch barely drops relative to a major league pitcher’s average changeup.

In the end, you’ve got a pitch that might look like a fastball from the arm slot, is going quite slow, and doesn’t drop much. You can see how the batter faces a tough quandary. The fastball-changeup combo play off each other well. Deception is a key part of Estrada’s arsenal. To get even better, Estrada began to utilize his best pitch more. Using your best pitch isn’t a novel concept. We’ve seen Rich Hill and Lance McCullers Jr. have success in this mold.

Decreasing the usage of the cutter has brought better performance thus far. The cutter is inducing more swinging strikes, and less contact, as hitters have swung more often when he throws it. In 2016, Estrada threw 625 cutters leading to a .352 wOBA, the worst of his four pitches. In 2017, Estrada has thrown 93 cutters, to the tune of a .272 wOBA, currently the best of his repertoire. Why the change? The cutter has seen a massive drop in vertical movement, likely the reason for its reduced usage. While the results have been better, the process might not be. Marco has been unable to get sufficient rise on the cutter. Moreover, the increased effectiveness might simply be due to small sample size. Or perhaps throwing it less brings its own added value.

ACEstrada, as he is affectionately known as to Jays fans, has ramped up usage of his four-seam fastball as well. The pitch is still strong and it’s traveling a mile faster. It won’t keep a 31% strikeout rate but it should continue to induce lots of infield fly balls. On the downside, the average launch speed on the fastball on line drives and fly balls is up 1.5 MPH from last season, to 94.7 MPH. This would explain part of the .316 BABIP it currently sports, up 52 points compared to his career. With a first-pitch-strike rate the highest since his last season with the Brewers, and his best walk rate since 2013, Estrada’s not making it tougher than it has to be. Pitches inside the strike zone are at the highest rate of his career. Once again, it’s because of a changeup he’s commanding very well. It’s practically 50/50 whether the change will make it in the zone, up 8 percentage points relative to his career average.

Looking at Estrada’s batted-ball profile, the big one that jumps out is the decrease in popups. He’s inducing more than 50% fewer popups this season relative to last year. The main culprit: the changeup.  Given Estrada has an 18.2% popup rate on his changeup compared to the changeup generating popups at a 34% clip during his career, it’s likely this issue sorts itself out as the season progresses. With good command, Estrada is capable of finding those easy outs through strikeouts or pop-outs.

To counteract a cutter not moving like it usually does and some BABIP regression, Estrada turned to his two best pitches. The ERA should improve as the season progresses. Being a two-pitch pitcher isn’t an easy task; Estrada has the command of his two primary pitches to pull it off. The key during the rest of the season will be to hold his strikeout and walk gains while continuing to be one of the league’s better contact managers.  Combined, the Blue Jays ace might be getting better. Marco Estrada will play a key role down the stretch; whether it be with the Jays or for a contender in a contract year.


Dallas Keuchel’s Pitch Mix Is Different but Beautiful

Dallas Keuchel has reemerged as an ace for the Houston Astros this season, as he has posted a 1.71 ERA thus far and is yet to lose a game. He has an absurd 67.4% ground ball rate while still maintaining an 8.21 K/9 innings. Keuchel’s performance has been impressive, but his brilliant pitch repertoire may be even more impressive. Starters in the MLB essentially need at least three pitches. However, a lot rely on two pitches, while sprinkling in a third out of necessity. Possessing confidence in three pitches can be a commodity. But not only does Keuchel have three weapons, he has four pitches that he can effectively use.

It all starts with the two-seam fastball for the bearded ace, which he is throwing almost exactly 50% of the time this year. Hitters are slashing .179/.252/.291 against the pitch, and it’s drawing a GB% of 80.8%. Watch the pitch in live action:

The pitch sinks at the last second, dropping from Joey Rickard’s knees as it crosses the plate to nearly hitting the dirt. Rickard may not be the poster child for hitting, but there isn’t much you can do with that pitch. Even if it doesn’t have the ridiculous late sink, it puts hitters in a bind. It’s perfectly located down and away, so hitters have to reach to get the ball. Maybe you can send it to the opposite field, but Keuchel’s two-seam generally comes in below 90 mph, so a hitter is gonna have to put a hard swing on that to get a solid line drive. And with they way it keeps guys off balance, hard swings usually aren’t finding that pitch.

But that is just one pitch, you say. Keuchel can’t replicate that perfection often. Well…

Keuchel rarely misses his spot with the two-seam, making it a dangerous ground ball/strikeout weapon for him. The two-seam is Keuchel’s most commonly seen fastball, but it is not his only one. He actually throws a cutter to accompany his fastball. The cutter is his least thrown pitch of the repertoire, but he still throws it 10.8% of the time. What’s rare here is the two-seam and cutter combo, as Keuchel is one of only four starters that throws the two-seam at least 25% of the time and the cutter at least 10% of the time.

His cutter is quite effective too, as hitters have a .174 average against it. Similar to the two-seam, Keuchel has great command of the pitch. He knows where he wants to throw it and, usually, he puts it right there. The cutter isn’t quite the ground-ball pitch that the two-seam is, but rather Keuchel uses it jam righties inside. The cutter has the highest infield fly-ball rate (20.0%) of his four-pitch arsenal.

Next is Keuchel’s slider, which he throws 22.2% of the time. Hitters are slashing just .125/.143/.208. His slider is incredibly effective, but it is also different than most sliders. In terms of vertical and horizontal movement, below is your average slider from a lefty:

Blake Snell’s slider breaks down and in, but now look at Keuchel’s slider:

Keuchel’s slider has a ton of horizontal movement, but has almost no downward break. It averages only half an inch of vertical movement. His command of the pitch isn’t nearly as pretty as the fastballs, but that makes sense considering it’s a breaking ball.

Last not but not least, Keuchel’s changeup, which he throws 12.7% of the time. The pitch has limited hitters to just a .233 slugging in 2017. And, like with any of his other pitches, Keuchel throws it where he wants to. Keuchel also kind of has a four-seam fastball, but the pitch is used very rarely and isn’t really part of repertoire.

But back to why I’m writing this in the first place. If you look back at the heat maps for all of Keuchel’s pitches, it’s pretty clear that, aside for elevating his changeup on occasion, Keuchel keeps everything low. All of his pitches consistently land across one plane at the bottom of the strike zone, covering every part of the plate from left to right. When you consider his slider is what it is, Keuchel essentially doesn’t have a true breaking ball. Why this is so odd is because every one of his pitches, in terms of vertical movement, moves in a straight line and lands in the same place every time.

However, every one of his pitches is moving side to side, so Keuchel never gives you anything straight up. They are always going to be cutting or fading. But Keuchel throws all of his pitches relatively slow, so they are not easy to discern based off velocity. If you combine that with the fact that all of his pitches are landing across the same plane and not breaking, it makes it incredibly hard to recognize his pitches.

Just to make it even harder on hitters, here is Keuchel’s pitch mix by count. It’s always going to be a heavy dose of two-seam fastballs, but any of his secondary pitches can be thrown at any time.

So, Keuchel can throw you four different pitches, that all look similar, at any time he wants and exactly where he wants to throw them. That sounds like a recipe for success. Keuchel’s pitch mix may be different, but it is about as effective as anybody’s. Despite extremely limited velocity and stuff, Keuchel remains one of the top pitchers in the game because his command and ability to mix pitches is truly beautiful.


Ichiro Might Have Been Able to Be a Power Hitter

Earlier this month, Eno Sarris posted an article called “Could Ichiro Have Been a Power Hitter?,” which began with a launch angle and exit velocity analysis of Ichiro himself, and developed into a wider examination which led to the interesting proposition that “players may have their own ideal launch angles based on where their own exit velocity peaks.”  In this article, I’ll look at a larger sample of players whose fly-ball rates increased from 2015 to 2016 and see if their peak exit velocity range changed or stayed constant.  First I’ll re-examine Elvis Andrus, then I’ll look at Jake Lamb, Xander Bogaerts and Salvador Perez.

Elvis Andrus

As mentioned by Eno, Andrus’ average launch angle went from 8.1 in 2015 to 8.6 in 2016, but his fly-ball rate actually decreased.  It seems like he started the change in 2015, but was only able to translate it into results (a 112 wRC+) in 2016.  Regardless, let’s look at the data again, and see what we can find.

Instead of just qualitatively looking at the distribution and giving an approximate range of maximum exit velocity, I split the data set into launch angle buckets, and found the bucket with the highest median exit velocity.  For example, if I set the bucket size at 5 degrees and applied it to Elvis Andrus in 2015, I got a range (-2°, 3°) (I’ll omit the degree symbol from now on).  If I set the size at 10 degrees, I got a range (-2, 8).  For the rest of the article, I’ll keep it set at a range of 5 degrees.

The peak range for Andrus’ 2016 was (-3, 2).

Using the method outlined, the peak range for 2015 was (-2, 3), and for 2016 it was (-3, 2), so Andrus’ peak exit velocity range did not change much from 2015 to 2016, just as Eno pointed out, and as we can see with the two years overlaid.

Jake Lamb

Comparing 2015 and 2016, Jake Lamb raised his average exit velocity from 89.7 to 91.3 MPH, and his fly-ball rate from 32.4% to 36.7%.  His adjustments were chronicled by August Fagerstrom during his breakout (http://www.fangraphs.com/blogs/jake-lambs-revamped-swing-made-him-an-all-star-snub/).

The peak 5 degree range for Jake Lamb’s 2015 was (3, 8).

The peak 5 degree range for Lamb’s 2016 was (15, 20)!

Unlike Andrus, Jake Lamb’s peak exit velocity range increased along with his launch angle distribution!  This seems to be the kind of effective swing change that players attempting to join the fly-ball revolution strive for.  Lamb managed to revamp his swing to not only elevate the ball more, but to hit the ball harder at high launch angles, and actually increase the angle at which he hit the ball the hardest.  However, as the next two cases show, this is far from a guaranteed outcome.

Salvador Perez

Perez’s peak 2015 range: (9, 14).

Perez’s peak 2016 range: (0, 5).

From 2015 to 2016, Perez increased his fly-ball rate from 37.4% to 47.1%, and increased his average exit velocity from 87.3 to 88.8 miles per hour.  He also increased his average launch angle from 13.7° to 19.1°.  But curiously, his peak exit velocity range actually went down from (9, 14) to (0, 5)!  When I saw this, I thought I’d have to change my methods, because it didn’t make sense to me at first.  But if you look at Perez’s exit velocity vs. launch angle graphs for 2015 and 2016, these ranges actually seem to qualitatively fit.  Somehow, the Royals backstop managed to hit the ball harder and higher, but become more effective at lower launch angles.  This could be a rising tide lifts all ships situation, whereby his swing adjustments let him hit tough low pitches hard at lower angles, or it could just be a sample size issue.  By splitting the data set into buckets, the sample size gets dangerously small, and prone to strange results.  But I think the results fit the picture, and either Sal Perez needed to hit more balls for us to get reliable results, or he just had a strange batted-ball distribution.  We have a similar, more extreme situation with Xander Bogaerts next.

Xander Bogaerts

Bogaerts’ peak 2015 range: (5, 10).

Bogaerts’ peak 2016 range: (-6, -1).

Bogaerts, like the other three players here, hit the ball harder in 2016 than in 2015.  He raised his fly-ball rate and his average launch angle, and was rewarded with a 113 wRC+, a slight improvement on his 109 wRC+ from 2015.  But his peak exit velocity range for 2016 was, like Perez, lower than in 2015.  Looking at his plots, it looks like he hit his ground balls harder in 2016, while not changing the exit velocity of his line drives and fly balls as significantly.  I’m not sure what else to say about Xander, other than that he’s kind of a weird player, as already noted by Dave Cameron (http://www.fangraphs.com/blogs/xander-bogaerts-is-a-very-weird-good-player/).

Summary

The following table summarizes the findings for each player.

Avg EV Fly Ball % Avg Launch Angle Peak EV range wRC+
2015 2016 2015 2016 2015 2016 2015 2016 2015 2016
Elvis Andrus 85.2 86.9 31.8% 28.5% 8.1 8.4 (-2, 3) (-3, 2) 78 112
Jake Lamb 89.7 91.3 32.4% 36.7% 11.4 10.4 (3, 8) (15, 20) 91 114
Salvador Perez 87.3 88.8 37.4% 47.1% 13.7 19.1 (9, 14) (0, 5) 86 88
Xander Bogaerts 87.6 88.8 25.8% 34.9% 6.6 11.3 (5, 10) (-6, -1) 109 113

It seems like Andrus improved by simply hitting the ball harder and staying within his peak exit velocity range of launch angles (which fits Eno’s hypothesis), whereas Jake Lamb improved by hitting the ball harder, raising his average launch angle, and shifting his peak exit velocity range (which runs contrary to Eno’s hypothesis).  Perez and Bogaerts didn’t really improve, and their Statcast data yielded some strange results, which suggests that this method is far from foolproof, and that there may have been better choices of players to investigate.

Many thanks to Eno for the inspiration for this article, and to Baseball Savant for all of the Statcast data.


Which Players Are Over- or Underperforming?

Early on in what has been another exciting MLB season, we have been introduced to many new players, all while having the privilege of seeing some old ones as well.  Over the course of the last two months, we have been introduced to some breakout performers like Aaron Judge of the Yankees and Michael Conforto of the Mets.  Along with them, there have been a few players that haven’t lived up to their previous performances, like Matt Harvey of the Mets and Carlos Gonzalez of the Rockies (written up wonderfully here).  I will illuminate five cases of players exceeding expectations and five more of those falling short.  Along with that there will be an investigation on whether that performance could be sustainable long term.  Hopefully you can use some of this to learn more about some exiting major leaguers and glean some insights for your fantasy team!

For explanations for any of the stats below, look to http://www.fangraphs.com/library

5 Overperformers

Miguel Sano, Minnesota Twins 3B/DH

Relevant Statistics: .299/.408/.592, 13 HR, 41 RBI, 2.6 fWAR

One of the most dramatic over-performers of the new season is the massive man manning the hot corner in the Twin Cities.  The 6’4 260 lb. 24-year-old is absolutely tearing the cover off the ball and has fueled the Twins to a AL Central leading 28-24 record.  Sano is currently in seventh place on the leaderboard for fWAR (the FanGraphs version of Wins Above Replacement), already amassing a career high 2.6.  Driving this success is both his bat and his glove.  Sano is hitting for a 165 wRC+, signifying that his offense has been worth 65% more runs than league average (for more explanation on this stat look here).  Also, the young slugger’s glove work is behind his improvement.  In previous seasons, Sano has proven to be an average fielder, using his strong arm to make plays that many others could not, yet also losing nearly seven runs of value from errors. This year however, Sano has improved his defensive play, increasing his fielding percentage from .896 to .959.

Sustainability:

Sano has long been known for his prodigious power and strong arm.  Despite a down year in 2016, many were still high on his batting ability based on past performance.

Here is his prospect writeup from John Sickels of minorleagueball.com in 2014:

Power-mashing beast, comparable to a young Miguel Cabrera. He may not hit for the high averages that the mature Cabrera has produced, but power should be similar. Sano has made a lot of progress with the glove and a move to first base is not automatic.

Being compared to Miguel Cabrera is impressive for any hitter, let alone a minor leaguer like Sano was in 2014.  Sano was a consensus top ten prospect in baseball.  There are a few warning signs that some aspects of Sano’s play may slip, such as his .464 batting average on balls in play, while the MLB average hovers around .300.  He also has had very shaky defense in the past, and his rapid ascent into the top ten defensive third baseman could be taken with a grain of salt.  However, Sano hits the ball harder and more consistently than just about anyone, and he walks enough (15.5% BB) to mitigate some of the risk inherent with his absurd strikeout rate (37.4% K). He easily leads the majors with a 51.6% hard hit percentage, and a 98.7 mph average exit velocity, which both demonstrate that Sano is achieving insane consistency and power when putting bat to ball.

Verdict:

Look out for this young fella.  If you tune into a Twins game in the near future, do not be surprised if you see Sano send a ball into orbit.  Expect him to take pleasure in ruining ERAs for years to come.

Robbie Ray, Arizona Diamondbacks SP

Relevant Statistics: 69.0 IP, 5-3, 3.00 ERA, 3.27 FIP, 1.7 fWAR

Robbie Ray has been one of the most frustratingly inconsistent starters in recent memory.  Blessed with a fastball that can run up to 98 mph, and a slider that sits around 83 that accumulates a 40% strikeout rate and 20% swinging strike percentage, Ray has all the tools to be a dominant starter.  Last year, he dazzled with his outings against the Marlins on June 12th (7.2 IP, 0 ER, 3 H, 1BB, 6K), and the Padres on August 20th (7.0 IP, 1 ER, 1 H, 13 K, 1 BB).  He also had a few meltdowns, allowing 5 runs in three innings on April 24th to the Pirates and another 5 runs in 4.2 innings against the Padres on May 27th.  Ray has seemingly made adjustments, and is pitching like an ace this season.  He is top 12 in the majors among starters in fWAR and is sitting in sixth place in strikeouts per nine innings (10.96).  He has managed to avoid too many blowups and produced one of the most impressive starts of the season on May 30.  He spun a complete game shutout of the Pirates while only allowing four hits, no walks, and ten strikeouts.

Sustainability:

First, lets look at the issues that led to Ray’s disappointing performance (4.90 ERA) in 2016.  First off, he calls Chase Field home. Known as an extreme hitters park, Chase ranked third from the bottom for pitchers when considering the whole major leagues, behind only noted hitting havens Coors and Fenway.  Ray also led the majors in batting average on balls in play allowed.  Again, where the major league average is around .300, Ray’s was at .352, indicating a bit of bad luck.  He was no doubt hurt by the injury to his rangy center fielder A.J. Pollack.  Finally, Ray issued too many free passes, in the bottom ten among qualified starters in BB%.  This year, Ray once again has Pollack manning center, and his BABIP has plummeted nearly 100 points to .252.  Meanwhile, his strikeouts are marginally down, while his walks are up.  This points to Ray maybe getting a bit more lucky this year, or at least regressing to the median, and this stands while looking at his left on base rates.  Ray has allowed a much lower percentage runners to score after reaching base compared to last year.

Verdict:

Ray still calls the desert his home, and will always have a challenging home park. Considering his penchant for striking out or walking seemingly every batter he faces, expect Ray to continue to be challenging into the future, with a few dud outings and a few masterpieces.

Zach Cozart, Cincinnati Reds SS

Relevant statistics: .335/.423/.574, 7 HR, 5 Defensive Runs Saved, 2.7 fWAR

Notice my surprise the other day, when I was browsing the WAR leaderboards on FanGraphs and saw who was in third place.  I was so astounded I sent a tweet to High Heat Stats (awesome account by the way, well worth the follow).  Please ignore the misspelling of the player’s name, I was excited!

 https://twitter.com/Stanonis_/status/869921887614271488

This was my inspiration for this whole article.  For years, the only thing you heard when hearing about Zach Cozart was how mediocre he was.  It was simply incredible that such an unremarkable performer had ascended to such heights.  Under the surface though, Cozart has been making improvements for years.  First off, Cozart has always been a great fielder, peaking at 19 defensive runs saved in 2014.  After being a slap hitter for many years, Cozart has increased his isolated power from .079 in 2013 all the way to .239 here in 2017.  He also has gone from a career 5.9% BB to 13.9% BB this year.

Sustainability:

I hate to be the bearer of bad news, but everything in Cozart’s profile screams regression to something more like last years numbers.  His average exit velocity is about three miles per hour below the MLB average.  He has not dramatically increased his fly ball percentage or pull percentage, both indicators of swing transformations that can lead to increased power.   Zach Cozart is riding what seems to be a wave of good fortune to a batting line 61% better than league average.  I say these things, and as I am writing this article I have been tuned in to the Reds game, where he has hit another two home runs, and a triple to boot!  I’m already starting to regret this.

Verdict:

All signs point to Cozart slowing down here in the near future.  Despite this, Cozart remains a solid performer who the Reds may ship off at the trade deadline for some young talent to build around.

Jason Vargas, Kansas City Royals SP

Relevant Statistics: 69.1 IP, 7-3, 2.08 ERA, 3.16 FIP, 1.8 fWAR

Jason Vargas is one of the most puzzling players of 2017.  He was last seen prominently in 2015 pitching for the Royals in the regular season leading up to their World Series winning playoff run.  However, Vargas needed Tommy John surgery during the season, and along with the playoffs missed the entire 2016 season sans 12 innings.  Vargas, a 34 year old lefty, has never been anything close to an ace.  However, through a third of the MLB season, he is only trailing Dallas Keuchel of the Astros in ERA.  Call me crazy, but I never saw a breakout coming from a 34 year old coming off of Tommy John surgery that has never shown anything like this in his career.

Sustainability:

Vargas may have made some improvements, but there is no way that he continues to dominate major league hitting like this over the course of the year.  First, I’ll go over the improvements.  He is striking out an extra batter every nine innings over his career rate, and issuing .5 less walks.  He also is leaning on his changeup that is striking out batters over 30% of the time.  However, he is not inducing ground balls at an increased rate, and his overall swinging strike percentage outside his changeup (24%) is dismal.  His fielding-independent pitching indicates that his ERA should be around a run higher.  His BABIP is at .278, which is a bit low.  Vargas appears to be getting a bit lucky this year, but also seems to have improved a bit too.

Verdict: While Vargas may have made improvements on the player he was early on in his career, he also seems to be a bit lucky this year, benefiting from a home stadium that is kind to pitchers and some grace from the baseball gods.  I doubt Vargas will continue to run an ERA in the low 2’s.

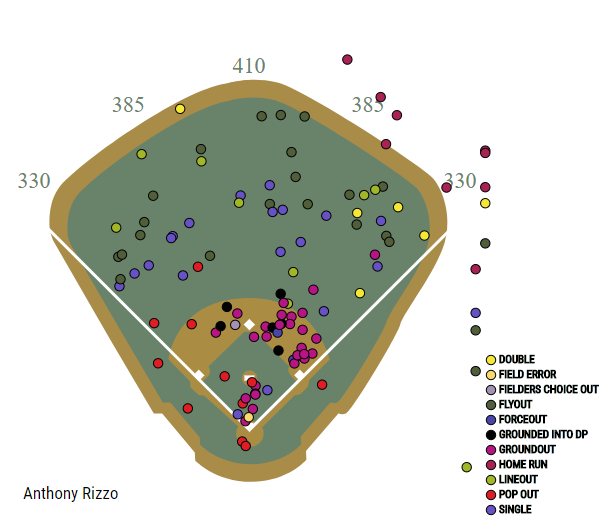
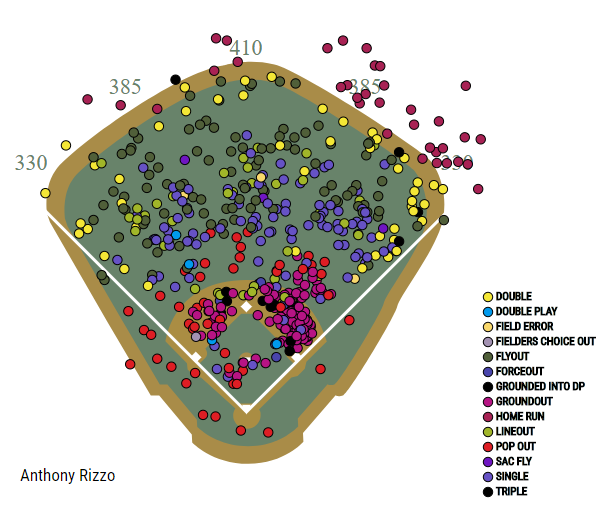
Ryan Zimmerman, Washington Nationals 3B

Relevant Statistics: .368/.416/.695, 15 HR, 45 RBI, 2.1 fWAR

Ryan Zimmerman was once the face of the Washington Nationals.  Before their youth movement started and the #1 overall picks started rolling in, he was a rock for a new team.  In recent years however, Zimmerman has declined, finally bottoming out at -1.3 fWAR last year, signifying he was far worse than an average replacement player. Zimmerman has been on a tear this year however, capturing NL player of the month for April and hitting as many long balls as he did last year.  Zimmerman is one of the driving forces on one of the best offenses in baseball, and has a ton of RBI opportunities with former MVP Bryce Harper hitting in front of him.  Thus far, he has put up an offensive line 89% better than league average this season!

Sustainability:

Zimmerman is yet another MLB player who has undergone a significant swing change that has seemingly overnight turned him back into a slugger.  In 2016, Zimmerman just hit the ball on the ground too much, and in 2017 has reduced that percentage by 7%.  His average exit velocity was always high, so putting the ball into the air has maximized the damage that he can do with his prodigious power.  Zimmerman has a unsustainably high .404 BABIP, and that will fall back to earth, but he should remain a great hitter.

Verdict:

Zimmerman should no longer be the awful drag on the franchise that he was in 2016, yet going forward may suffer some regression to the mean. He should however be a dynamic cog in the Nationals lineup for the rest of the year, and remain an above average player.

5 Underperformers

Maikel Franco, Philadelphia Phillies 3B

Relevant Statistics: .223/.277/.359, 6 HR, 28 RBI, -.3 fWAR

Franco, like Sano, was also a top 3B prospect in 2014, usually falling in the top 30 or so prospects on most lists.

Here is John Sickel’s writeup of Franco that year:

Posted .926 OPS in Double-A at age 20 with a low strikeout rate, 31 homers on the season, 36 doubles with just 70 whiffs in 581 PA. Despite impeccable performance at young age, some observers still critique his swing and overall approach. Usually serious swing problems show up with an elevated strikeout rate and/or serious production slippage in the high minors, but so far that hasn’t occurred. We’ll see what happens in Triple-A, but overall I can’t see how Franco is anything but an elite prospect.

Franco is not trending well across the last three seasons.  His wRC+ has gone from 129, to 92, to 67.  He is now firmly a below average hitter this season.  His average is down to .223, and he on base percentage is only .277.  His exit velocity is still far above the MLB average, so he is still hitting the ball with authority.  Franco has been a disappointment, and as his prospect sheen wears off he will need to start to play better to stay in the long term plans of the Phillies front office.

Sustainability:

Franco seems like one of those players, like Ryan Zimmerman, Josh Donaldson, and J.D. Martinez, that would benefit from a swing change.  His fly ball percentage is low and he hits to many balls on the ground.  His BABIP is extremely low right now, so he could creep back to an average hitting line with a dynamic hitting line with a bit of luck.  Alex Stumpf wrote a great piece about Franco’s struggles with sliders here, and iterated that Franco has a lot of developing still to do.  The projections seem to still hold Franco in high esteem, with ZiPS being the low man and still projecting a +.9 fWAR rest of season performance.

Verdict:

Franco may never live up to his high prospect billing, and has a few steps he should take to return to being an above average hitter.  Expect this to take time, and his numbers the rest of the year may not be what many expected coming into the season.

Julio Teheran, Atlanta Braves SP

Relevant Statistics: 61.2 IP, 4-4, 4.82 ERA, 5.51 FIP, -.2 fWAR

Before diving into Julio Teheran and the next guy, Jose Quintana, I would encourage anyone to read this, which is an article that delves into why Quintana has been the pitched credited with more fWAR over the years.  Teheran has always been someone with much better results than the underlying numbers dictate.  This can be attributed to many things, but overall Teheran has a career ERA of 3.49 and a career FIP of 3.97.  Things have fallen apart for Teheran this season, attributable to his BB/9 jumping up nearly two walks and his K/9 falling by over a strikeout.  FIP sees Teheran as someone deserving of a 5.5 ERA thus far, and Teheran has compiled -.2 fWAR and has had his worst season to date.

Sustainability:

Teheran has always been a man on the edge, outperforming his peripherals for the bulk of his career.  His fastball velocity is down almost a full mile per hour, and is he is striking out less batters and walking more than he has in recent years.  His skills seem to be demonstrably eroding, and he will need to make some sort of change to get back to his normal self.  This does not seem to be a slump, and the only thing that could be attributed to luck is his 14% HR/FB rate that has his HR/9 at a career high 1.75.

Verdict:

Teheran is a pitcher that seems to be regressing. He is still over-performing his fielding independent numbers and may be someone that the braves may not be able to rely on to be a part of their core long term.

Jose Quintana, Chicago White Sox SP

Relevant Statistics: 64.1 IP, 2-7, 5.60 ERA, 4.28 FIP, .9 fWAR

Quintana is the opposite side of the coin from Teheran.  He has never been someone to consistently over-perform his fielding independent numbers.  He pitches in a tough park, and has been notorious for racking up low win totals despite his efforts, in part due to languid offensive support.  Quintana has struggled this year, because of an increased walk rate (up to 3.36 in 2017 after 2.16 in 2016), and a sky high HR/9 rate (1.40, up from .95 last year).  He still is not getting his wins or racking up insane strikeout numbers either, and many outside the organization are pondering whether or not the White Sox should have sold high this summer on someone that is having a down year.

Sustainability:

To me, all signs point to Quintana bouncing back.  If he could get his homers and walks under control, he could once again establish himself as an above average option.  His velocity hasn’t plummeted, the projections are all still supporting him, and his BABIP is slightly higher than his career average.

Verdict:

If I had to guess, I would say that Quintana moves back into the role of an under appreciated quality option.  All the trade rumors this summer made the general public more aware of his quiet performance, and this may be enough for him to stay toiling in Guaranteed Rate Field a year longer.

Adrian Gonzalez, Los Angeles Dodgers 1B

Relevant Statistics: .262/.309/.356, 1 HR, 21 RBI, -.5 fWAR

Adrian Gonzalez was once an incredible player, posting a 6.1 fWAR season and racking up over 1100 career RBIs.  Yet Gonzalez has been dismal this season, posting an 80 wRC+ and being completely pushed out of the Dodgers long term plans by a certain someone. Gonzalez has also gone on the DL this year, part of the Dodgers plan so seemingly stick half of their roster on there at once.  Gonzalez is hitting for almost no power, as his .094 isolated power demonstrates.

Sustainability:

You would think someone hitting this poorly after such a storied career would have a low BABIP.  Nope, Gonzalez has a BABIP of .311, above the MLB average.  His average exit velocity is slightly higher than the MLB average, but there is not a lot of promise in Gonzalez’ profile.  His walk rate has never been this low in a full season.  His ground ball rate is above his career average, and his fly ball rate is below his career average.

Verdict:

Time catches up to all of us, and sometimes rookies that turn Dodger Stadium into launching pads do too.  Gonzalez will eventually be phased out of the Dodgers 1st base pecking order.  It seems I am more down on him than anyone else on this list.

Johnathan Villar, Milwaukee Brewers 2B

Relevant Statistics: .210/.284/.319, 5 HR, 24 RBI, -.5 fWAR

Villar was a godsend to fantasy teams across America last year, as his 62 stolen bases paced the majors.  However, Villar has gone from a 118 wRC+ in 2016 to a 59 wRC+ in 2017.  In 2016 he found his power stroke, but his ISO has dropped precipitously in 2017. His baserunning value was always overstated by his steals totals, but has already accumulated more than half of last year’s value on the bases this year, so that does not seem to be the problem.  Villar was expected to be a top fantasy option this year, and has thus far been an enormous disappointment.

Sustainability:

Villar’s regression seems to be completely tied to his bat.  His defense and base running are actually both improved on a rate basis from last year, impressive considering a position change.  With both his walk rate up, his strikeouts down, and his power down, the general trend is not positive.  His ground ball percentage is up around 8%, and his fly balls are down.  It seems like Villar is going against the changes being implemented in the league as a whole, and it is not going to well for him.

Verdict:

While Villar will always be good for some swipes, he has not done anything this year to indicate that his monster 2016 was anything but a flash in the pan.  If I were in a fantasy league, I would sell while he has some semblance of fantasy value.

Thanks for reading!  If you have any criticisms or , email me at stanonaj@miamioh.edu or contact me on twitter @Stanonis_

*all stats from fangraphs.com, updated as of June 4, 2017

*Average exit velocity courtesy of MLB’s Statcast

*All photos courtesy of Getty Images

Originally, this article was posted to a website that one of my friends made so we have an outlet for some of our thoughts on sports.  The original link is here.  This is the reason for some of the explanations on statistics that an average FanGraphs reader already knows.


Anthony Rizzo Has Changed, Man

For the last three years, Anthony Rizzo has been one of the most consistent hitters in baseball. His wRC+ from 2014-2016: 155, 145, 145. His wOBA: .397, .384, .391. He consistently draws a walk in about 11% of his plate appearances and strikes out in less than 20% of his plate appearances. So far this year? It has been a much slower start, as he’s slashing .231/.371/.448. Though the OBP and SLG aren’t bad, the batting average is tougher to stomach. He’s been just above average with a wRC+ of 114, hardly the numbers the Cubs were expecting from their perennial All-Star. Still, there’s some explanation for all this. For comparison’s sake, we will only be looking at 2016 and 2017. Here’s some charts from Brooks Baseball:

There isn’t an obvious change in approach. He’s swinging at about the same amount of pitches and really is staying inside the zone. In 2017 it seems like he’s swinging more at the low and in pitches but otherwise, same approach. The stats from Baseball Info Solutions and PITCHf/x back this up. He’s in line with his career swing% by both metrics; the difference is in the contact he’s making. By Baseball Info, his O-Contact% is 71.1% up from 68.1%. PITCHf/x also has him at 71.1% up from 66.1%.

This makes me think the quality of the contact is the issue. Here are two videos showing at bats in 2017 and 2016. The focus here is what Rizzo is doing with outside pitches. First 2016, then 2017:

https://baseballsavant.mlb.com/videos?video_id=730449083

https://baseballsavant.mlb.com/videos?video_id=1383639883

In 2016, Rizzo lets that outside pitch get deep to poke it to left field. The 2017 version is early and rolls it over into a shift. Baseball Savant has limited video for 2017 but I’ve seen the same thing and the numbers back it up. Here are two charts showing his exit velocities, 2016 is on the bottom, 2017 is on the top.


It would be easy to say Rizzo needs to do a better job going the other way with the outside pitch, but that’s the main difference I’m seeing this year. Overall, Rizzo’s hard contact is down to 30.4% from last year’s 34.3%, and from his career rate. His pull rate is also the highest in his career, at 53%, vs. 43.9%. Rizzo has been pulling a decent amount of grounders, specifically at a rate of 68.1% with about 78.2% being characterized as soft or medium contact, higher than in 2016. Rizzo faces a shift quite a bit, so pulling grounders isn’t going to help him. He’s hitting line drives at the lowest rate since he was first called up, and down to 15% from his career 20% rate. Take a look at the spray charts below. The first chart is 2017 and the second is 2016. It’s the classic small sample vs. large sample but you can definitely see that Rizzo is not using all fields like he has in the past.


This what confounds me. Despite all this, he still is producing better than average, because his walk rate and strikeout rate are the best rates of his career. So just imagine if his BABIP currently wasn’t .212? I don’t want to say that’s going to raise for sure, but I believe it will get closer to his career rate of .285. This is probably a long-winded way of saying small sample size, so here’s one last thing. This has happened with Rizzo before. In 2016 he had a similar start in March through May, but turned it on for the rest of the year.

Still, this isn’t a simple “It’s been 50 games and he’s been unlucky” that would imply that he’s the same player doing the same things but getting different results. The concern I have is that Rizzo’s doing things differently this year. He’s not using all fields, and he’s hurting his performance by trying to pull pitches and generating weaker contact (his EV is down this year). Using all fields might lead to more line drives and would drive his batting average up to his career norms. Maybe he’s putting pressure on himself after last year’s championship? He’s had success before and I believe he can get back to where he was.


Kris Bryant’s Wacky 2017

The Chicago Cubs have been immensely disappointing in 2017, not quite living up to the dynastic expectations that were forced upon them. Kyle Schwarber is struggling (if you haven’t heard that, I don’t know where you have been). Addison Russell is struggling. The pitching rotation is struggling. Star third baseman Kris Bryant, however, has managed to avoid being dragged down with the rest of the team.

In his MVP season last year, Bryant put up a .402 wOBA and a 149 wRC+, ranking 8th and 9th in the league, respectively. Through 50 games in 2017, he has posted a .402 wOBA and a 147 wRC+. The results are almost identical, but the two ways they have been achieved are not quite as similar.

40.3% of Bryant’s contact was considered hard in 2016, good for 13th in the league. But visit the Statcast exit velocity leaderboard for 2017, and you won’t be seeing Bryant anywhere near the top. Bryant’s Hard% is down all the way to 29.6% in 2017 and his average exit velocity of 86.21 mph this year is actually worse than the MLB Average 87.83 mph. The wOBAs for each season are the same, but the xwOBAs tell a much different story. Bryant was a bit lucky in 2016, as his xwOBA of .383 indicated a performance a little worse than his numbers. But it did not change the fact that Bryant still put up an MVP season, and it doesn’t look as worse if you consider Wrigley Field had a park factor of 90.2 in 2016. This year, Bryant’s .349 xwOBA pales in comparison to the .402 wOBA, especially with Wrigley’s 110.2 park factor this year. Bryant, unlike other Cubs, has managed to dodge the criticism this year with the help of a whole lot of luck.

The 2016 and 2017 launch angles are quite similar, so a change in swing path likely isn’t causing the weaker contact. And with the 2016 Bryant put up, one would hardly expect that he was quick to adjust his swing. The change is strange, but there may be an explanation.

Like with most power guys, Bryant was a heavy pull hitter in 2016, hitting 46.7% of his balls to left field. That number has taken a massive drop to 38.7% this season. Balls in play are likely to find more gaps if they are sprayed all over the field, but that still cannot come close to accounting for the difference in Bryant’s xwOBA and wOBA. Hand in hand with that, his contact rates have gone up. He is connecting on 65.3% of his swings on pitches outside the zone, up from 59.8% last year. His swinging strike rate is down from 13.0% to an impressive 9.7%. Perhaps Bryant, like Giancarlo Stanton also recently did, decided to give up some power for a more balanced plate approach.

The problem, though, is that Bryant hasn’t altered his strikeout rates. His K% is only down to 20.5% this year from 22.0% last year. Bryant is chasing less, though, lowering his O-Swing% from 30.8% to 28.6%. He is chasing less now, and even when he is chasing, he is making more contact. He’s also making a whole lot more contact in general. Those should add up to fewer strikeouts, but, oddly, they aren’t. Again, there may be an explanation. Bryant is still whiffing a whole lot with two strikes, as his swinging strike with two strikes with rate is still at 24.5%, compared to last year’s 26.8% mark. You can’t strike out without two strikes, so even if he is whiffing less with one or zero strikes, he’s not making more contact when there is an actual punch-out opportunity.

If you are going to refine your plate approach and lose some of the aggressive hacks, you need to strike out less, as Stanton did. Guys like (younger) Stanton have to offset lots of misses by doing something with the ball on the times they don’t miss.

But there is one thing that has really confused me. Why is a former MVP giving up the approach that got him the award? Everyone can and should make adjustments to get better, even Mike Trout, but it is odd to see Bryant stray this far from what he did last year.

There is some good news, though. Bryant is posting a 15.5% walk rate, ranking 11th in the league. His Zone% has actually slightly increased from this year to last, so perhaps Bryant’s improved eye is forcing pitchers to attack him in the zone. Or maybe they are catching on to his weak contact.

Overall, this has been a weird season for Bryant and the Cubs. The Cubs are loudly scuffling, while Bryant is quietly putting together a mysterious season. He won the MVP in 2016, but then seemingly decided to make big adjustments to his plate approach. His new approach isn’t working, but his production isn’t falling. I honestly don’t know what to make of this right now, and maybe no conclusions need to be drawn at this time. But one thing that can be taken away is that we should start monitoring Bryant a little more closely.


How High Do the Best Hitters Hold Their Hands?

Since lowering the hands was often a topic the last few months, I wanted to look at what the best hitters actually do. For that purpose I’m looking at the so-called “launch position” around front toe touch, and not the stance, since many batters will start to lower and then load up during the stride (David Ortiz or Josh Donaldson), while a few start higher and then load down (Kris Bryant).

As a reference, I used the top of the shoulders and the highest finger on the handle. As a marker for the gap, I use barrel diameter, which is about 2 1/2 inch with wood bats.

Standard height I consider top of the shoulder plus/minus one barrel diameter, and low or high is more than one barrel diameter away from that (it is arbitrary but I have to chose some cutoff). I used shoulder high because that is a common teaching by many hitting coaches.

The hitters are the 2016 wRC+ leaders.

Mike Trout

His hands are borderline between standard and high. I have measured a tick more than one barrel diameter so I will group him in the high category. He is like Bryant also, one of the quite passive and early hand load guys and not a big “rubber band guy” like Donaldson who loads the hands very late to create a lot of stretch. That might be biomechanically slightly less efficient due to the stretch shortening cycle, but it is simple and not much can go wrong, plus he is explosive enough to leave a little on the table

David Ortiz

Very different load from Trout, as he lowers his hands and then loads them late as the lower body already opens. His hands even continue to go up as the elbow starts to lower, creating a ton of stretch. That is the modern Donaldson style of load that might be the biomechanically most efficient due to the best use of stretch shortening cycle. In the modern internet hitting coach circles, this is the most popular load right now, made popular by Bobby Tewksbary, who worked with Donaldson and many other pros. Almost all pros who have lowered their hands have some kind of connection to Bobby (Lamb, Pollock…). Overall his hands end up in a standard height at toe touch.

Joey Votto

More conservative load than Ortiz, although there is a little bit of lift during the load from below shoulder height. Overall his toe touch height is standard.

Daniel Murphy

Very quiet and conservative load that ends at a standard height.

JD

Same load style as Ortiz, ends at standard height.

Miggy

Donaldson loading style light. Hands end up on the low side.

Freddie Freeman

Tried to find his “new swing.” Hard to find a good one but he seems to be on the low side.

Altuve

Definitely on the high side

Kris Bryant

Load is a little like Trout; starts high and then drops to about standard.

Cruz

Not much of a load at all, if anything a very slight drop. Still ends up slightly high but not by much.

Rizzo

Starts low but ends up standard.

JD Martinez

Slight upward load to slightly high.

Belt

Small load to about standard height.

https://www.youtube.com/watch?v=s5iR2PPjv7E

Cano

Small and early load slightly on the low side.

C. Seager

Classic standard load to standard height.

Carpenter

Hard to find a good shot but might be a little on the low side.

Betts

Slightly on the high side.

EE

Simple load to very slightly high.

Cespedes

One of the few very high guys as his hands start about ear to eye height.

Goldschmidt

Very small drop load to about standard height.

This is the top 20 in wRC+ last season. Seven of the guys were on the high side, 9 were on the standard side and 4 were on the low side below shoulder height. But overall most ended up somewhere around shoulder level at toe touch. It might be an advantage to not go very high as only Cespedes made the top 20 with an ear-level high load, but lower than shoulder high is not common either.

In my opinion, the whole lower-the-hands thing is mostly a pre-stride thing. Even Jake Lamb, who is the poster boy for low hands, starts low but then loads up to around shoulder height. Now there might be a biomechanical advantage to dropping the hands and then loading up late. I know Bobby Tewksbary from many hitting forum discussions when he still posted there, and I also recommend getting his excellent ebook if you are into hitting, but I’m not sure if that whole low-hands thing isn’t a little overblown. The Donaldson style of load with the lowering and the barrel tip is now really en vogue and anyone promotes it on the internet now, but the 2016 MVPs Bryant and Trout both don’t do it. It might very well not be quite 100% perfect what Trout and Bryant do there, and they are definitely both freak athletes, but it works well enough for them. I would definitely have young hitters experiment with the JD style to see if it is for them but it isn’t as much of an absolute as many people now try to sell it.

Some hitters did lower their hands in their stance and it worked for them, but others did not and they still hit very well. In either case, both will still load up to around shoulder height. The hands definitely do not start “on plane;” the hands and bat always will start down before they level out and then go slightly up through contact.

Here is Miggy’s hand path to illustrate that:

His hands do start low, but still his hands and bat start to arc down and then level out and turn up.  Basically the swing is like the sign of a famous shoe company, first arcing down behind the body and then going up through contact.

https://www.youtube.com/watch?v=Ehs-H2V6N5o


Ballplayers and the Karmic Practice of Yoga

Injuries are something that pronounce their impact differently on every player in the game. Some guys have freakish bodies and recover faster naturally. Others push themselves to accelerate their return. But recovery from some injuries can’t be sped up. Maladies like inflammation are plainly matters of time.

JA Happ went on the 10-day DL on April 18 for having it in his elbow. He’s finally back on the mound in the Majors after being out for more than a month.

Kendall Graveman just hit the DL for soreness in his throwing shoulder and is “taking anti-inflammatory medication and resting,” per Susan Slusser of the San Francisco Chronicle. Manager Bob Melvin says he’s been through this before, that it’ll take longer this time, and that the team is going to “let this thing calm down” before trying to build up his endurance again. The passivity in his words is telling.

And if you have the heart to remember the end of Roy Halladay’s career, you’ll remember inflammation in his throwing shoulder cost him time on the DL amidst his body simply telling him, “please, no more.”

Inflammation is a general response from the body that results from cell agitation. It can occur from normal use — “normal” being a relative word. It intends to clear out damaged cells but the process causes pain, discomfort, and inherently imbalanced levels of certain proteins in our bodies. And the things a ballplayer does every day, the extreme motions they constantly put themselves through for more than half a calendar year, make them prime candidates to become victims of it.

Enter yoga.

There’s no causal relationship between yoga and reduced injuries. But as I researched its impact on ballplayers for a job, I couldn’t help but think of the benefits. And I did find that it has been connected to balancing the proteins that can get whacked out in players’ bodies through the course of a season.

Researchers have studied a particular form called Hatha yoga, which combines poses (asanas), breath control (pranayama) and meditation. They explored its ability to help aid in recovery from the regular wear-and-tear we put our bodies through. “Regular” is another relative term — think of the twist and torque your favorite hitter exhibits on each swing and how that could eventually cause a dreaded oblique strain.

The study’s trippiest finding centers on epinephrine levels in the brain, which are fueled by the adrenal gland and play a large role in maintaining both physical and emotional stress. In focusing on the differences between novices and experts, experts experienced higher levels of epinephrine on a regular basis. That surprised even the researchers.

Common sense might tell us that the more we have of something, the more we get used to it, and then the less impact it has on us. It’s why a person going skydiving for the first time can find it exhilarating while it’s just another day at the office for the instructor they’re attached to. It’s the same when a pitcher isn’t excited about his velocity inching up through the spring. He can expect it because of what he’s thrown in the past.

The study found the opposite with yoga, though. The body adapts to the poses, breathing patterns, and meditation in Hatha yoga, and the person gets better at it; but chemically, they don’t get used to it. It doesn’t become old hat. Instead, the practice becomes invigorating and those who practice it build up what becomes an expandable physiological embankment of wellness.

What’s more is that, based on the study’s parameters, a player could approach expert level at yoga over the course of a single season. A few hours a week could help keep their protein levels balanced through the summer and avoid the fickle complications of inflammation. And beyond even that, it offers a fresh, low impact way to optimize their body that could pay long-term dividends.


A Situational Lineup: Management Questions With No Clear Answers

It has come to my attention that in the 1880’s and early 1890’s an interesting management phenomenon presented itself around baseball. At this time, managers were not required to submit a lineup card before the start of the day’s game. Due to this, the first time through the batting order could be constructed the way the manager saw fit, based upon situations in the game. That being said, once the lineup went through its progression once, its construction would pervade throughout the rest of play. In lieu of this, an interesting set of strategical questions come into play. How would managers set lineups if this rule existed today? How would this effect run totals for the season for a given team? Would lineup construction change its form or remain largely the same as the way it is done now? This article is not one that analyzes or provides solutions but, instead, provides questions that are interesting and engaging to any baseball connoisseur.

The implications and strategy behind this lineup maneuverability are something that provides tons of differing opportunities for discussion. I think the lead-off hitter, if this rule was applied to the game today, would remain mostly the same. Managers would continue to look for an on-base machine to start off the game in a positive fashion. Along with this, I believe that the seven through nine batters would remain mostly static. Managers would look to place their worst hitters and their pitcher in these spots in order to diminish their number of at-bats in impact situations. With these assumptions established, a world of possibilities open up for the two through six hitters in the lineup. Each manager would approach this construction differently based upon the day’s match-up and the game’s progression. That said, here are a set of interesting scenarios that can provide interesting implications for the progression of a game and for run production in that game.

Let’s assume we’re the Angels and we have their current set of middling players that play alongside a healthy, and studly, Mike Trout. It’s the top of the first inning and the first two outs have already been made, no one’s on base, and we have to choose who will hit. Although there are no runners in scoring position, would you (as the manager) decide to hit Trout in this spot? Or, would you wait and hit Trout to lead off next inning and hope he starts off the inning strong? Or, would you wait to bat Trout sixth and hope that the first two batters in the next inning get on base and Trout can drive them in?

If you choose the latter, the implications of such would be a diminished number of at-bats in the game for Trout. Would it be worth it to wait on an impact situation to have Trout hit for the first time, even if this led to one less at-bat for the rest of the game? I think, personally, in this scenario I would hit Cameron Maybin in the three hole, following Yunel Escobar and Kole Calhoun. I think Maybin has enough pop to hit a home run every once in a while with the bases empty. I also think that if he got on base, I’d hit Trout directly following in the four hole. If it were a single by which Maybin got on, he would go first pitch and try to swipe second. If he got thrown out, it would be fine and I’d have Trout leading off my next inning, followed by Albert Pujols and Luis Valbuena. If he swiped the bag, we would now have a runner in scoring position for our best hitter, which is exactly what we want.

I can see as I’m writing that my ideas are getting harder and harder to follow, but I think this is a direct result of the vast array of possibilities this type of management choice presents. It would be interesting to see major-league managers, much more knowledgeable than myself, go about making these decisions on a daily basis. What do you think would be the best lineup set in this situation? And what other situations would be interesting to discuss as baseball fans?