Maikel Franco Is Adjusting

Baseball Prospectus, in their 2015 scouting report of Maikel Franco, had this to say:

“Extremely aggressive approach; will guess, leading to misses or weak contact against soft stuff; gets out in front of ball often—creates hole with breaking stuff away; despite excellent hand-eye and bat speed, hit tool may end up playing down due to approach…”

We saw early this year, and even last year, that exact prediction come to life. Franco seemed to be flailing about vs the soft stuff, beating too many pitches into the ground, and even popping too many up. He never really stopped hitting the ball hard, but we saw too many of those hit in non-ideal ways. For most of the first part of this year the slider gave him absolute fits, and Alex Stumpf wrote about that here. He’s striking out at a career-low rate (13% on the year), but he still isn’t really walking that much although it’s bounced up a percentage point from last year (7.3% in 2017).

Here’s a rundown of his career batted-ball profiles:

ballprofile

I was watching the Phillies game vs. the Marlins on the 18th, and Franco went 3-4 with the go-ahead HR off Dustin McGowan. His HR came on a slider middle-away — literally the exact pitch that’s done nothing but given him fits all year. I also noticed that his batting stance seemed to be different. More upright, quieter. I pulled up a highlight video of an at-bat from early May. Here’s a screencap of his stance just before the pitcher starts his delivery:

francold

That AB ended in an RBI line drive to right. Here’s a screencap of the HR in question from Tuesday, at a similar point in the pitcher’s delivery:

franconew

Now if that’s not a mechanical change, I don’t know what is. He’s closed off his stance, eliminated a lot of the knee bend, and seems to have raised his hands juuuuuust a touch. It could be the difference in the camera angle though. Phillies hitting coach Matt Stairs mentioned they’d been trying to get Franco to cut down on his leg kick, so let’s look at that too:
Old leg kick:

oldlegkick

New:

newlegkick

Shortly after contact, old:

pocold

and the recent HR, similar point:

newpoc

The “leg kick” seems to be more of a toe tap, and hasn’t changed. What did change, though, is the quality of his follow-through. His head is on ball, he’s better transferred his weight to his front foot, and the results follow. The old AB was a line-drive single opposite field, which looks less of an intentional opposite-field hit and more of a product of bad mechanics. Being so open, he really could only go to right field with authority. If he tried to pull it he’d roll over the pitch. That also would cause him to struggle with the breaking pitch away, which he’d bounce to second. Closing off has allowed him to better get the bat head into a more ideal position to cover the whole plate with authority. He’s always had the bat control to make contact everywhere, but it looks now like he’s improved his chances of making quality contact all over the zone. Here’s the same look at his batted-ball profile since the start of July:

bballnew

Here’s some assorted metrics, same time period:

kbbnew

vs. his career metrics:

metricscareer

He’s cut his grounders by over 10%, raised his liners by 3%, and turned the rest into fly balls (8%). He’s likely always going to have a pop-up issue, but his pull/center/oppo profile is back to where he was at in 15/16, and he’s hitting the ball hard at a higher rate than ever. Also, his strikeout rate is 6%(!!!!!!)!!!!! He’s making more contact than ever, and that contact is better than ever.

We’ve seen Franco get us hyped before, but never before has there been this type of major mechanical change to point to. Miguel Sano did something similar preseason by raising his hands and quieting his pre-swing load, and it’s paid dividends. Since I started this article, Franco went 2-4 with a single, double, and sac fly; and three of those batted-ball events were hit at 100+mph (the single and double; he was robbed by the 3B on a sharp liner as well).

Going back to his 2015 scouting report: Franco’s still aggressive, if not slowly becoming less aggressive the more he’s in the majors. By changing up his stance, however, he’s closed up the two major holes in his report: getting out in front of the breakers away, and bad contact on soft stuff. Keep an eye on this. One of the more frustrating hyped prospects seems to have made the transformation we all hoped he would, right in front of our eyes.


The Opportunity Baseball Organizations Are Missing: Part II

In Part I, I suggested the “How” and “Why” as to what organizations might be missing. In Part II, I will give you the “What” – the specific findings that underpin an unprecedented opportunity for an organization to capture a significant competitive advantage.

At the major league level, approximately 20-30% of players suffer from significant swing path issues. Since path issues are likely the single largest factor in player failure and underperformance, an organization with a systematic approach to “cure path” would be at significant advantage relative to the remaining teams. Not only would the club benefit directly through improved offensive production, but having an effective cure to path would provide superior insight into “true talent” as the largest remaining factor.  There are also logical extensions into how this could be further monetized in potential areas such as player arbitrage, draft selection, etc.

In summary, the comprehensive solution can be simply stated as follows:

1) The optimal swing paths that exist in the muscle memory of the best hitters can be quantified and visually represented to players performing below potential.

2) A systematic process can be built around the above for significantly improved performance.

Before getting into the key findings, I would like to talk about process using another parallel to investing. There is a popular view that all hitters are different and a “systematic process” cannot be utilized for fixing the ones performing below potential. Successful investors are also presented with a significant amount of uniqueness in their decision process. They have all developed a process that effectively deals with uniqueness, not avoid it all together. So if a process isn’t effective in getting hitters to potential, it’s not that you need to abandon process, you just need a different one. Swing path is a core mechanic that can be systematized and as you will see, there is plenty of room for customization within a systematic process.

The findings below are presented with an extremely high level of conviction based on several years of research including a patent filing in 2013. History will be the ultimate judge but based on communication with a handful of organizations, there is a strong possibility that many clubs will be unwilling to consider such non-traditional sources of value.

The Findings – Quantifying the Optimal Swing Path

Variables:
1) X Axis – Swing Loft
2) Y Axis – Bat Angle (vertical)
3) Z Axis – Swing Direction (Very small changes – Not considered here)
4) Timing (technically, horizontal Bat Angle but we’ll just call it timing for simplicity)
5) Ball Contact Point (Relative to ball equator – Not considered here in terms of loft)

Constraint – The Bat Angle for any given pitch height represents a straight line from the ball to the chest area such that the intersection between the body and the swing plane is a point in the chest area not the mid-section or waist.

Nothing major yet – just some visual representations of the Variables and the Constraint.

Although not a major finding, many are still of the opinion that the bat should be relatively level resulting in a much lower swing plane/body intersection as in the illustration above. The importance of Bat Angle will become more clear shortly. For now, I’ll use two extreme Infield Fly Ball Rates (IFFB%) as a general proxy for a path quality. Below, you will see the Bat Angle (and plane/body intersection) for one of the lowest IFFB rates (Joey Votto) and one of the highest (Kevin Kiermaier). Note the significant 10° difference between the Bat Angles for the same height pitch.

Looking more broadly, the average Bat Angle on low-middle pitches for the players with the five lowest IFFB rates (2015 and 2016) was 34° while the average Bat Angle on low middle pitches for the players with the five highest IFFB rates  was 26°. An example application is screening for players with high IFFB rates on low pitches. Since a relatively flat bat is required for an infield fly ball, this type of screen can highlight players with consistently insufficient Bat Angle.  However, this is only a small part of a more comprehensive approach to identifying players with poor paths as discussed below.

Timing is a Separate Loft Factor

To illustrate Timing Loft, consider the model below in which Swing Loft has been set to zero, thus 100% of the loft is a result of Timing Loft (Bat Angle set to theoretical maximum to illustrate the point).

Conversely, for a high pitch (Bat Angle set to theoretical minimum), 100% of the loft comes from Swing Loft while Timing determines the direction of the hit – pull, center, or oppo (below).


Loft Goals, Angle Mix, and Loft Contribution

Given the principles previously illustrated, optimal angle combinations can be constructed for each pitch location. Each location will have different loft contributions from Timing and Swing Loft based on the height of the pitch. So ball height determines Bat Angle which determines the mix of loft contribution. We will discuss customization shortly. For now, let’s just assume a launch angle goal of 15 degrees for a particular player.


High Pitch Low-Middle Pitch* Very Low Pitch
Bat Angle 20° 45° 65°
Swing Loft 11.7° 7.5° 4.2°
Timing Loft 3.3° 7.5° 10.8°
Total (Goal) Loft 15° 15° 15°


*Note – A middle to low pitch was used to illustrate a 50/50 mix of loft contribution which occurs at a 45° Bat Angle. A true middle pitch has approximately 30-35° of Bat Angle


Thus, the optimal Swing Loft for a low-middle-height pitch for a player with a 15 degree loft goal is only 7.5 degrees – the other 7.5 degrees comes from timing


AND Swing Loft is not the major loft factor for low pitches – which is a lot of them.


Extending these concepts, the optimal loft goal and loft contribution mix can and should be adjusted for different hitter types. Pull hitters will have a greater relative contribution from Timing Loft while opposite field hitters will have a greater relative contribution from Swing Loft. While adjusting the loft goal higher for more powerful hitters is an option, there are potential drawbacks that should be carefully considered and are discussed below.


Reconciling the Swing Up / Swing Down Views

It is interesting to consider the above in light of baseball ignoring Ted Williams for so many years. Usually, there is some rationale for significant movement in a particular direction. In hindsight, it is not too difficult to consider that the “swing down” movement came about (in part) because the bat path / ball path matching issue can’t be solved with a simple one-factor (i.e. Swing Loft) solution as Williams proposed (specifically, page 67 of The Science of Hitting where he shows front knee bend to hit low pitches). While Swing Loft should never be negative, one can certainly appreciate how minimal Swing Loft and relying on Timing Loft for low pitches might feel down to a player. A few takeaways:

1) I am convinced that the failure of Williams’ teachings to fully catch on as well as the highly variable success rates today in adding loft is because some players are able to intuitively arrive at the correct mix of loft contribution while others are forcing too much Swing Loft.

2) Since “timing adjustments” are clearly required to achieve high levels of loft using an optimal mix of angles, excessive loft goals are problematic for many hitters, particularly those who are not natural “pull” (early timing) hitters.

3) Given the significant number of consistent hitters in the 13-15 average LA range, this indicates a Swing Loft on average, of 6.5 to 7.5 degrees for a low-middle-height pitch – nowhere close to what many believe is required to become a card carrying member of the “Fly Ball Revolution.”

Visually Representing Optimal Swing Paths to Hitters

I am by no means an expert in neuroscience; however, it seems relatively straightforward that the more information hitters can transfer out of conscious thought into subconscious/muscle memory, the better they will perform. Hitters don’t want to (and shouldn’t) think about complex angle combinations. Consequently, a visual representation of the optimal combination of angles tailor made for each considering their power (i.e. to determine goal loft) and pull vs oppo tendencies can quickly correct a consistently poor swing path. Yes, “Keep it Simple” but solve the complexity first.

Below is the device that allows a hitter to train for optimal angle mixes through seeing and feeling the optimal paths for different pitch locations. The ball joint allows flexibility for any mix of angles while the angle guide provides compound angle settings based on a hitter’s customized loft goal and pull/oppo preference.

I will keep the product plug to a minimum. Additional information may be found here.


Finding Great Paths in the Data

Statcast data confirms that the best (most consistent) hitters hit the ball significantly flatter (in terms of bat/ball contact, not launch angle) than average. You can read more about the details of this here. I refer to estimated spin impact as Mean Unexpected Distance (MUD).

In addition to hitting the ball flat, one of the best indicators of a great swing path is low variability (Standard Deviation) of a player’s launch angles. After witnessing significant reduction in launch-angle variability through focused training, I had a significantly high level of conviction that this was a key indicator of “quality of path” several years ago. The availability of Statcast data through Baseball Savant changed everything. The data not only confirmed the benefits of flat contact previously discussed but also proved that data combined with video analysis can assess  “quality of path” with a very high degree of accuracy. Considering no other data than (low) MUD scores and (low) Standard Deviation,  the following hitters are returned (based on 2015 and 2016 data):

Player Avg MUD Avg Std Dev
Chris Davis -16.0 21.5
Freddie Freeman -14.3 20.3
Joe Mauer -13.2 21.4
Joey Votto -12.8 20.1
Brandon Belt -9.9 19.6
Miguel Cabrera -9.9 20.4
Paul Goldschmidt -8.7 21.5
J.D. Martinez -8.6 21.6
Nick Castellanos -7.8 19.4
Adrian Gonzalez -6.9 21.0
Matt Carpenter -6.6 20.0
Yan Gomes -4.5 22.0
Christian Yelich -3.9 21.1
Mike Trout -3.0 20.6
Logan Forsythe -2.7 21.0
Howie Kendrick -2.4 21.8
Daniel Murphy -2.0 21.9
Justin Turner -1.2 21.4

The average wRC+ and BABIP for the hitters above are 129 and .330, respectively. Given the return of Cabrera, Votto, Mauer, Trout, Freeman, J.D. Martinez, and several others considering no other performance factors, the benefits of low Standard Deviation of LA and flat contact seem relatively clear.


Putting It All Together – A Better Training Approach

I believe it would be a mistake to ignore the iterative training process that the best hitters have utilized up to this point. Hit a lot of balls, keep what works, discard what doesn’t and repeat the process over a very long period of time. In many cases, the only thing differentiating good from bad paths is that a player’s “filter” allowed something to get through that should have been discarded.

The drawback of the iterative approach is that it takes a very long time. If a player gets off track, it can take a frustratingly long time to go through the process to fix something that may have a very simple solution. Combining what we know from the discussion above, the variability of launch angles can be used in training sessions to quickly determine if a path is moving in the right direction or not before a player fully commits to a contemplated change.

In other words, path issues can be effectively addressed from opposite directions – static/device training  to improve path and dynamic (pitched balls)  training focused on reducing LA volatility. In training sessions with BP-type pitching, players with good paths are able to get down to a 13-14 degree standard deviation.

Implications From The Findings

Part I  pointed out the first step in the research process (as I have known it) is “Identify the Key Drivers”. I believe it is fairly safe to say that most, if not all organizations, believe that path is a key factor. This leads to the logical question of – Why didn’t MLB organizations “go deep” on one of the largest factors of player performance?  I believe there are two primary reasons:

1)  They assumed there was nothing of significance to be found – they concluded before they considered.

2)  It was outside the scope of responsibilities for employees on both the data/analytics side and the player development side of the organization.

Looking more broadly, it would be my guess that most organizations would say they do not believe significant “Moneyball-size opportunities” exist. It is this type of thinking that suggests that they likely do. I’m currently looking into another key driver of performance that could possibly be addressed through a similar systematic approach. Until baseball organizations change their thinking (and possibly their organizational structure), it’s likely that these opportunities will continue to exist. The source is the same – the “Gap in the Middle” that was outlined in Part I.

Clearly, all of the findings presented here are “known” in the muscle memory of the best hitters with great paths.  To this point, however, this muscle memory knowledge had not been understood or quantified in a way that could be systematically transferred to other players. By separating the loft factors, quantifying optimal paths for each location, and presenting a simplified visual representation of the optimal combination of angles, hitters can correct path issues with a very high rate of success.

Going forward, it will be interesting to see how organizations change in regard to considering non-traditional sources of value such as the “Gap in the Middle” previously discussed. At least one, the Houston Astros, announced in March (two days after Part I but likely just a coincidence) that they were moving their lead analyst, Sig Mejdal, to get “on-field experience.” This move, combined with his title of “Process Improvement,” indicates that they might be ahead of the pack in terms of considering new ideas. If you are aware of other clubs moving in this direction, please indicate in the comments. Based on my communication with a few organizations, I believe several are going to be late to the party as they appear unwilling to challenge existing assumptions.

Given the possibility of more “meat on the bone” for the findings above, I will likely take another short break before publishing the next article. However, for those interested in considering opportunities where data and mechanics intersect such as what has been presented above, there is considerably more material for your future consumption.


The Bad Aaron Judge Comps

Aaron Judge is good.  Some might say he is great.  The front-runner for AL Rookie of the Year and MVP is the face of MLB for 2017, but the face of MLB for the future?  Unfortunately, maybe not.

It’s hard to find something negative to say about the New York Yankees right fielder, but in order to play devil’s advocate and not get our hopes up too high about Aaron Judge, just in the event that he has a down season, I was able to find some rather unflattering comps for the slugger.

First, there’s his minor-league career.  Aaron Judge was a pretty good prospect ranking first in the Yankees’ system in 2015 and 17th in baseball according to MLB Pipeline.  However, just because a prospect is ranked highly does not mean they are without flaws.  Judge would strike out in at least 21 percent of his plate appearances in all levels in the minor leagues.  This article from 2016 even identified Judge’s proficiency to strikeout:  

Judge’s Triple-A debut at the end of 2015 did not go well. He slashed .224/.308/.373, well below both his career levels and expectations. More alarming, he struck out a career high 28.5-percent of the time (74 times in 260 plate appearances). [The 2016 season] has been more of the same. His batting average is a bit deceiving sitting at .284 (heading into this weekend), considering he currently has a nice .354 BABIP compared to last seasons .289. His plate discipline is troubling.

Perhaps the lofty expectations of Judge have him pressing. You simply can’t overlook the fact that his strikeout rate is nearly identical to the small sample size of last season’s Triple-A numbers (27.2-percent). It has to be at least a slight bit worrisome that this is a trend and not a slump. His walk right is dropping daily to a new career low (6.8-percent or eight walks in 103 plate appearances).

The article seems to point to his plate discipline as his main flaw — as other evaluators have — but is overall positive with his prospect status.  But his strikeout tendency should not be overlooked.  He has failed to improve on that statistic in his short major-league career, where he has struck out in 32 percent of his plate appearances between his call-up in 2016 and now.  However, because he also takes his walks, his walk percentage is rather high, which puts him in exclusive company.

Since 2000, there have only been four players with at least 300 plate appearances who have struck out in over 29 percent of their plate appearances and walked in at least 16 percent of them: Jack Cust (2007, 2008, 2010, 2011), Ryan Howard (2007), Adam Dunn (2012), and Aaron Judge (2017).  All of these seasons resulted in wRC+ well above 100, which means that they were productive players; however, these player were known to be the embodiment of the “three-true-outcome” hitters.  Dunn had five consecutive seasons of 40 or more home runs, but also led the league in strikeouts four times; Cust led the league in walks once and strikeouts three times; and Howard led the league in home runs twice and strikeouts twice.  Admittedly, these comps are not encouraging.  Although these players were not horrible in the simplest definition, their careers were short-lived and their production sharply declined.  For Cust and Dunn, it forced an early retirement, and Howard a well-publicized and sad end to an illustrious career.

But it’s not just Aaron Judge’s strikeout and walk percentage — it’s also his raw strikeout numbers.  Judge is on pace to strike out over 200 times this season.  While it’s already been established that he is strikeout-prone, it does not serve him justice that the 200-strikeout threshold is upon him.  No player who has struck out 200 or more times in a season has had a very high average.  As the legendary Pete Rose noted, the highest single-season average for a player with 200 or more strikeouts was .262 (Chris Davis holds that honor).  The short list of 200 single-season strikeout players is a whopping five players long: Mark Reynolds, Adam Dunn, Chris Davis, Chris Carter, and Drew Stubbs.  Kris Bryant had 199 in his rookie season (he was called up late to the bigs due to service-time considerations, so it’s likely that he would have joined this club), and Ryan Howard had 199 twice and Jack Cust had 197 once.  Dunn, Howard, and Cust again…

I love Aaron Judge, and I love 500-plus foot home runs, but we also have to be realistic and rational in our love and praise for the slugger.  The worst thing that the New York sports world can do is rattle this kid if, and when, he goes from being an All-Star to the 25th man on a roster.  There is nothing I want to see more, as a Yankees fan and a baseball fan, than Judge succeed; it’s good for the sport.  But I also don’t want to get my hopes up too high, because nothing stings more than a player of his caliber going down the path of Adam Dunn, Jack Cust, or Ryan Howard.


dSCORE: Starting Pitcher Evaluations

Early this spring I did a writeup on dScore (“Dominance Score), an algorithm that aims to identify early on pitcher “true talent.” That article reviewed RP performance for 2016.

Here’s a quick review of dScore and how it works:

dScore takes each pitcher and divides them up into a bunch of stats (K-BB%, Hard/Soft%, contact metrics, swinging strikes; as well as breaking down each pitch in their arsenal by weights and movements). We then weight each metric based on indication of success–for relievers, having one or two premium pitches, missing bats, and minimizing hard contact are ideal; whereas starters tend to thrive with a better overall arsenal, minimizing contact, and minimizing baserunners. Below is a breakdown of the metrics we used in our SP evaluations:

Performance metrics: WHIP, K/BB%, Soft%, Hard%, GB%, Contact%, SwStk%, Z-Contact%, O-Contact%

Pitch metrics: wPitch, vPitch (where “Pitch”= FA, FT, CU, SL, CH)

Our current weighting for SPs is a bit more subjective and complex than our RP weighting system, but I’m looking to implement a similar weighting system to the way we weight RP metrics in this evaluation in the near future.

dScore has been around for a year or so now, and one thing I was asked when I initially posted was whether or not it has any “predictive” tendencies. The answer is a pretty clear “no”–BUT what it does do very, very well is validate performance. There’s a fine line between saying “the numbers say pitcher X’s going to stay good” and saying “pitcher X has been good, and this confirms he’s been good”. The problem with the metric is it uses per-pitch statistics, rather than Fielding-Independent metrics. What that means is at a technical level, dScore views the pitcher as directly responsible for everything that happened after a pitch is thrown. There’s been a few outside cases that I’ll get into in a later article; but generally if a pitcher’s been bad, he’s generally viewed as having been bad, or vice versa. It seems particularly bad at projecting regression from underperformance, although I haven’t been tracking pitcher movement as well as I should. I’ll look to implement some sort of evaluation by next year.


Top Performing SP by Arsenal, 2017
Rank Name Team dScore
1 Max Scherzer Nationals 55.73
2 Alex Wood Dodgers 55.54
3 Corey Kluber Indians 49.15
4 Chris Sale Red Sox 46.43
5 Clayton Kershaw Dodgers 43.53
6 Dallas Keuchel Astros 38.90
7 Noah Syndergaard Mets 33.45
8 Lance McCullers Astros 32.17
9 Randall Delgado Diamondbacks 30.50
10 Zack Godley Diamondbacks 29.69
11 Stephen Strasburg Nationals 26.92
12 Jacob deGrom Mets 25.13
13 Luis Severino Yankees 24.38
14 Luis Castillo Reds 23.65
15 Trevor Cahill Padres 23.63
16 James Paxton Mariners 21.46
17 Kenta Maeda Dodgers 20.61
18 Zack Greinke Diamondbacks 20.48
19 Nate Karns Royals 20.42
20 Carlos Carrasco Indians 19.96
21 Rich Hill Dodgers 17.86
22 Masahiro Tanaka Yankees 17.43
23 Danny Salazar Indians 17.06
24 Brad Peacock Astros 16.51
25 Marcus Stroman Blue Jays 15.48


The Studs

The top eight guys are really a who’s-who. Scherzer, Wood, Kluber, Sale, Kersh, Keuchel, Syndergaard…Only guy I’m touching on here is Thor, who’s close to begin throwing again. Lat injuries are a whole lotta “?????” for pitchers, but he’s certainly worth a buy if someone is (stupidly) wanting to sell.


The Loaded Teams

Astros – Dallas Keuchel (6), Lance McCullers (8), Brad Peacock (24) / McCullers has broken out. Consider him a stud going forward.

Diamondbacks – Randall Delgado (9), Zack Godley (10), Zack Greinke (18) / Delgado is likely more of a bullpen option at this point. Godley had an awful first outing off the break, but dScore really believes in him.

Dodgers – Alex Wood (2), Clayton Kershaw (5), Kenta Maeda (17), Rich Hill (21) / Come on, really? Give some other team a chance!


The Young Breakouts

Zack Godley (10) – I touched on him above. Although I’m pretty sure he’s due for regression, dScore continues to think he’s got premium stuff. Continue to roll with him.

Luis Castillo (14) – He’s 29 innings into his big-league career, but that’s also 29 innings vs. the Nationals (twice), Rockies (once, in Coors), and the Diamondbacks (once, in Chase). All three teams rank in the top five in the NL in runs scored. BUY. / FUN FACT: The Rockies rank third in runs scored, but are tied with the Padres for dead last in the NL in wRC+ at 81.

James Paxton (16) – He is who we thought he is.


The Still Believin’

Kenta Maeda (17)

Masahiro Tanaka (22)

Danny Salazar (23)

Tanaka’s been god-awful. dScore agrees with his 3.73 xFIP though, and says he should’ve been significantly better than he is. Salazar has somehow been worse, but once again dScore sides with his 3.57 xFIP and says BUY when he comes back from the minors, although I feel like that’s what Salazar’s always been. Every metric says he should be significantly better than he actually is. In 10 years I feel like his career is going to spawn the ultimate sabermetric “what could have been” from FanGraphs.


The Just Missed

Jacob Faria (26)

Jose Berrios (28)

Mike Clevinger (29)

Jordan Montgomery (30)

Chris Archer (31)

A whole bunch of kids and Archer, aka the pitcher we all want Danny Salazar to be.


R.I.P

Nathan Karns (19) – Thoracic Outlet Syndrome. Well, it was a good idea for the Royals…


Notes From Farther Down

Newly-minted Cubs ace Jose Quintana is sitting at 76th. Remember how I said this metric was bad at projecting regression from underperformance? Quintana was sitting just inside the top 100 before his last start. Even though dScore agrees he’s been bad, I’m still buying Quintana in bulk. Old Cubs ace Jon Lester is still getting love from dScore, even after his absolute meltdown vs the Pirates. He’s at 39th. Fellow lefties Sean Manaea and Eduardo Rodriguez bookend him at 38th and 40th respectively. Manaea was sitting in the high-teens for most of the season, then seemed to lose feel for his slider and effectively stopped throwing it. That really hurt his hittability and K’s. It came back around last start vs. Cleveland. I’m continuing to buy him as a #2 ROS. Boston activated Rodriguez recently. Adam Wainwright (104), Julio Teheran (108), Jake Odorizzi (123), Matt Harvey (137), Aaron Sanchez (140), Cole Hamels (143) are a whole bunch of ughhhhh. I’m out on all but Hamels, who I’d argue to hold. His strikeouts disappeared before getting shelved with an oblique strain, then got shelled in his first start back vs. Cleveland. His last three starts have been vintage, and I’m anticipating dScore to catch back up.


Who To Expect the Most Improvement From in the Second Half

Baseball is a very fickle sport; sometimes everything will be going your way, and sometimes it may be the complete opposite. There will always be guys who go through long stretches where they are seemingly doing everything right but the results just are not coming. With that being said, let’s take a look at who should improve after the All-Star break.

Miguel Cabrera

Cabrera is in the midst of one of the worst seasons of his career. His .264 average would be a career worst, the 20 home runs he’s on pace for would be the third worst. His 110 wRC+ is his worst since his rookie season.

All signs point to that coming to an end quickly, though. Cabrera’s .067 xwOBA – wOBA is the highest in the league and his BABIP has plummeted to .307. He is obviously a terrible baserunner with his age so one might expect those numbers, but the .037 xwOBA – wOBA he posted in 2015-2016 and his .346 career BABIP suggest it has been more than his age. Comerica Park is one of the more pitcher-friendly parks in the league, but still shouldn’t account for the bad luck.

Cabrera’s batted-ball profile also appears to be in great shape. He is hitting more line drives than ever before, while also utilizing all parts of the field at a career high. To go along with that, his Hard% and Soft% are career bests. His Hard% is second in the league and within 0.1% of the godly Aaron Judge. Cabrera’s contact rates are slightly down but right in line with the last couple of seasons, and his O-Swing% and Z-Swing% are also similar to his past.

The basic numbers suggest he’s having perhaps the worst season of his career, but Cabrera’s peripherals suggest one of his best. Expect bigger things from the two-time MVP in the second half.

Matt Carpenter 

Carpenter’s numbers have not disappointed quite to the extent of Cabrera’s. He is hitting only .237 and his 119 wRC+ are down, but he is also posting an absurd 17.5% BB% and just a 18.6% strikeout rate. His 14 home runs show a little bit of improved power. However, the numbers suggest he could be doing quite a bit better.

His xwOBA is .044 higher than his wOBA, which is tied for eighth in the league. Similar to Cabrera, he is not an exceptional baserunner and is not playing in a hitter’s park, but his 2015-2016 xwOBA was only .014 higher than his wOBA. He’s also experienced the same BABIP drop as Cabrera, as the .256 mark he’s running in 2017 is way off his career .322 BABIP.

Carpenter’s batted-ball profile doesn’t excite as much as Cabrera, as his line-drive rate is down and his Soft% is up. But his hard-contact rate is at a career-high 45.1%.

His season has not been a total disappointment to date, but expect it to improve in the second half.

Manny Machado 

Lastly, we have the player disappointing the most on this list. Without even looking at the numbers, Machado could easily be included on this list. Machado is still not even at the peak of his prime yet, as he turned 25 just over a week ago. The three time All-Star posted 6+ WAR in three of the last four seasons. The only other players to do the same were Mike Trout and Josh Donaldson.

So, even without digging into things, improvement in the second half is expected. Luckily, the peripherals also support an improvement from Machado. His xwOBA of .355 is far more impressive than his .319 wOBA, and Machado is actually a solid baserunner and plays in a generally neutral park at Camden Yards. The -.013 xwOBA – wOBA he had in 2015-2016 makes a lot more sense than the .036 he is running right now. The .239 BABIP in 2017, way off his .302 career mark, further suggests bad luck.

Just like Cabrera and Carpenter, Machado’s batted-ball profile is actually even a little more impressive than past seasons. His hard-hit rate of 40.2% would be a career high by a good amount and his soft-contact rate has seen a 3% decline from last year.

There may be more cause for concern with Machado than the others, though. He has basically forgotten how to hit line drives, as his LD% has cratered to 13.9% and his ground-ball rates are up. Along with that, his pull rates are creeping up. Luckily, Machado crushes his ground balls. His 89.4 average GB MPH ranks fifth in the league, which helps to offset his minuscule liner rates. But even with that, his Contact% of 76.3% would be the lowest since his rookie year, and his plate discipline is trending in the wrong direction.

It’s possible Machado is selling a bit of his contact skills for improved batted balls, but the GB/LD/FB tendencies don’t support that. Overall, considering Machado’s youth, talent, and most of the peripheral numbers, a large improvement should be expected. However, it does appear that something may be a little off with the Orioles’ franchise third baseman.


Adam Wainwright Might Have Turned a Corner

For the last year and a half, Adam Wainwright has been singing the same tune after bad starts.

“My arm feels great. My body feels great. I know what adjustments I need to make. I’ll be back.” Cardinals fans have heard those lines from Uncle Charlie since his struggles began. For all of 2016, and most of this season, the idea of Wainwright returning to pre-Achilles tear form seemed preposterous.

There have been games in which Wainwright looked like he should hang it up, like June 6 against Cincinnati (otherwise known as the Scooter Gennett game). At other times, he looked a lot like the Adam Wainwright of 2012-2014, like May 27 at Colorado. That day, he went seven shutout innings at Coors Field, and only gave up three hits.

Wainwright’s ERA is 5.20 going into Monday’s start in New York. But, if you take out the 24 runs allowed in 6 1/3 innings against Miami, Cincinnati, and Baltimore, his ERA would be 3.14. That would be top-10 in the NL, as Jose de Jesus Ortiz noted in the Post-Dispatch.

Why the wild discrepancy? I looked at each start Wainwright has made this season, and divided them into two groups: quality starts and non-quality starts.

Usage Rates

The first thing I looked at was how often he throws each pitch, broken up by quality starts and non-quality starts.

There’s not much to see here. The only significant change is that Wainwright throws more four-seam fastballs in quality starts, but that’s offset by an increase in sinkers in non-quality starts. Either way, the variance isn’t enough to account for such a massive discrepancy in outcome.

Velocity

If Wainwright isn’t mixing his pitches differently, maybe he just throws them harder (or slower) on certain days. Thanks to Brooks Baseball, took the average velocity of each of his pitches in every start. Then, I calculated the quality start average velocity and the non-quality start average velocity.

Again, not what I expected. Since Wainwright is a pitcher presumably in decline due to age, I didn’t expect to see him throwing harder in his bad outings. Wainwright has only thrown his four-seamer harder in quality starts than non-quality starts, and the difference was only 0.5 miles per hour. He’s thrown every other pitch harder in non-quality starts.

At this point, after many calculations, I was beginning to get discouraged.

Changing Speeds

On Brooks Baseball, if you click on a pitchers game log, it will show usage rates, strike percentages, average velocity, and max velocity. I didn’t intend to track max velocity, but I noticed something as I went along: it seemed like the difference between Wainwright’s average velocity and max velocity was greater in quality starts.

I know that’s a lot of numbers, but bear with me. The key columns are the two right-most. In quality starts, Wainwright has more velocity variance in every pitch except the four-seamer (I excluded the change from this analysis because he doesn’t throw it often enough).

I especially want to focus on the cutter and the curve, since up to June 22 opponents were hitting .286 against the curve and slugging .512 against the cutter.

In Wainwright’s last start against the Mets, his average cutter was 82.8 miles per hour. He also ran it up to 88.5 miles per hour. On that afternoon, hitters had to deal a pitch that moves a fair amount, but could also come at them at any speed within an eight to ten mile per hour range (if the average is 82.8, there had to have been some slower than that). In that same start, he threw his curve between 71.9 miles per hour and 76.5.

Doubling Down

In his last four starts, it appears Wainwright has doubled down on changing speeds within the same pitch.

I looks like Wainwright has made an adjustment. It’s not a surprising one, as Wainwright is the type of pitcher that would alter the tempo of his delivery in order to disrupt the timing of the hitters. The league might adjust to him. However, if this is sustainable, Adam Wainwright might have found his way to continue pitching at a high level for several more years.

This article first appeared in The Redbird Daily.


Introducing XRA: The New Results-Independent Pitching Stat

There are a multitude of ways that we can judge pitchers. Most people look at earned run average to gauge whether a pitcher has been successful, while many old school announcers will still cite a pitcher’s win-loss record. ERA is a nice, easy way of looking at how a pitcher has performed at limiting runs, but it doesn’t come close to telling the whole story. In the early 2000s, Voros McCracken created the idea of Defense Independent Pitching Stats or DIPS, which credited the pitcher only with what he could actually control. Fielding Independent Pitching was born from this theory and only took into account a pitcher’s strikeouts, walks and home runs allowed. It turns out that a pitcher’s home run rate is not terribly consistent, thus xFIP was created by Dave Studeman to normalize the home run aspect of the FIP equation by using the league home run per fly ball rate and the pitcher’s fly ball rate.

In 2015, a new metric was developed by Jonathan Judge, Harry Pavlidis and Dan Turkenkopf called Deserved Run Average or DRA. This new stat attempts to take into account every aspect that the pitcher has control over and control for everything that he does not, thus crediting the pitcher only for the runs that he actually deserves. DRA, however, is still dependent on the result of each batted ball. If the batter hits a ball deep in the gap and it rolls to the wall, the pitcher is charged with a double, but if the center fielder lays out and makes a remarkable catch, the pitcher is credited with an out. When evaluating pitchers, why should it matter whether they have a Gold Glove caliber defender behind them or not? It shouldn’t, and that’s where Expected Run Average comes in.

Expected Run Average or XRA gives pitchers credit for what they actually can control. FIP attempts to do this as well but assumes that pitchers have no control over batted balls. While the pitcher does not control how the fielders interact with the live ball, he does have an impact on the type of contact that he allows. XRA is based on a modified DIPS theory that the pitcher controls three things: whether he strikes the batter out, whether he walks the batter and the exit velocity, launch angle combination off the bat. After the ball leaves the batter’s bat, the play is out of the pitcher’s hands and should no longer have any effect on his statistics. The goal is to figure out a way to measure, independently of the defense and park, how each pitcher performs on balls in play. Since 2015, StatCast has tracked the exit velocity and launch angle of every batted ball in the majors. Each batted ball has a hit probability based on the velocity off of the bat and its trajectory. The probability for extra bases can also be determined. These batted ball probabilities have been linearly weighted for each event including strikeouts and walks to give each player’s xwOBA, which can be found on Baseball Savant. This is the perfect way to look specifically at how well a pitcher has performed on a per plate appearance basis.

Once xwOBA is found, then XRA can be calculated. The first objective is to find the pitcher’s weighted runs below average. To do this, I used the weighted runs above average formula from FanGraphs except I made it negative since fewer runs are better for pitchers.

wRBA = – ((xwOBA – League wOBA) / wOBA Scale) * TBF

For example, Max Scherzer has had a .228 xwOBA so far this season and has faced 487 batters. After finding the league wOBA and wOBA scale numbers at FanGraphs I can plug these numbers into the formula.

– ((.228 – .321) / 1.185) * 487 = 38.22

Max Scherzer has been 38.22 runs better than average so far this season, but now I need to figure out what the average pitcher would do while facing the same number of batters. To find this I need the league runs per plate appearance rate and multiply that number by the number of batters that Scherzer has faced.

League R/PA * TBF = Average Pitcher Runs
.122 * 487 = 59.41

So a league average pitcher would have been expected to surrender 59.41 runs facing the number of batters that Scherzer has so far this season. Now that we know how the average pitcher should have performed we can find the expected number of runs that Scherzer should have surrendered so far this season by subtracting his wRBA of 38.22 from the average pitcher’s runs.

Average Pitcher Runs – Weighted Runs Below Average = Expected Runs
59.41 – 38.22 = 21.19

Based on Scherzer’s xwOBA, he should have only given up 21.19 to this point in the season. If this sounds incredible it’s because this is the lowest mark of any starting pitcher though the first half of the season. Finally, XRA is found by using the RA/9 formula by multiplying the expected number of runs allowed by 9 and then dividing by innings pitched.

(9 * Expected Runs) / Innings Pitched = XRA
(9 * 21.19) / 128.33 = 1.49

Max Scherzer’s XRA of 1.49 is easily the lowest of any starter through the first half. The second best starter has been Chris Sale who has a 2.15 XRA. Of course these names are not surprising as they each started the All Star Game and are both currently the front runners for their leagues’ respective cy young award.

Here is a list of the top ten qualified pitchers:

Pitcher XRA
Max Scherzer 1.49
Chris Sale 2.15
Zack Greinke 2.26
Corey Kluber 2.33
Clayton Kershaw 2.34
Dan Straily 2.87
Lance McCullers 2.89
Chase Anderson 3.11
Luis Severino 3.17
Jeff Samardzija 3.23

And the bottom ten:

Pitcher XRA
Matt Moore 6.58
Kevin Gausman 6.47
Derek Holland 6.32
Matt Cain 6.26
Ricky Nolasco 6.26
Wade Miley 6.17
Johnny Cueto 6.10
Martin Perez 5.97
Jason Hammel 5.95
Jesse Chavez 5.84

Full First Half XRA List

It is interesting to see that three members of the Giants rotation rank in the bottom seven in all of baseball. In fact, AT&T Park is such a pitcher-friendly park that once you park adjust these numbers, Moore, Cain and Cueto become the three worst pitchers in baseball. It’s not surprising then why the Giants are having such a disappointing season.

One measure of a good stat is whether or not it matches your perception. Therefore, while it is interesting to see Dan Straily as one of the best pitchers in baseball and Johnny Cueto as one of the worst, it is much more assuring to see Max Scherzer, Chris Sale and Clayton Kershaw as some of the very best in the sport. The numbers for relievers also reveal how dominant Kenley Jansen and Craig Kimbrel have been. This is all good evidence that XRA is doing what it is supposed to do, accurately displaying how good pitchers have actually been, independent of all other factors.

Another important characteristic of a good stat is how well it correlates from year to year. While ERA is the most simple and popular way to look at pitchers, it is not very consistent. XRA is much more consistent than ERA and FIP and also compares favorably with xFIP. However, it is not as consistent as DRA. DRA controls for so many aspects of the game that it should be expected to be the most consistent. However, being the most predictive or most consistent stat is not necessarily the goal of XRA. The real goal is to show how well the pitcher actually did, and XRA seems to do this remarkably. While not being as consistent as a stat like DRA, the level of consistency is extremely encouraging and puts it right in line with the other run estimators.

XRA is a stat that takes luck, defense, and ballpark dimensions out of the equation. When evaluating a pitcher, he shouldn’t be penalized for giving up a 350-foot pop fly for a home run in Cincinnati while being rewarded for that same pop fly being caught for an easy out in Miami. With XRA, no longer will people have to quibble about BABIP, since it is results-independent and removes all luck from consideration. A ground ball with eyes will now be treated the same whether it squirts through for a single or is tracked down for an out. Pitching ability will no longer need to be measured with an eye on the level of the defense. It takes a good offense, a good pitching staff and a good defense to make a great team, and with XRA we can finally separate all of these important factions.


Poll: Which Player Would You Rather Have for the Rest of the Season

I have included anonymous descriptions of three players. The descriptions include stats that were compiled by  those players a little before the All-Star break.

I have included a link to a Google Survey (at the end of this article). No information is being collected other than your responses. (The survey also includes an optional question about your personal assessment of your baseball knowledge).

The question is: Which player would you rather have for the rest of this season?

Please keep the following facts in mind when answering the question:

  1. The league average BABIP is .299.
  2.  The league average K% is 21.6%
  3. The league average BB% is 8.6%
  4. The league average HR/H is 14.5%
  5. On average in the league, 33% of the time a bat touches the ball, a hit occurs.


Player 1: “Frank”

Frank is a young hitting prospect. He has little major-league track record outside of the first half of this season, and he was considered a top prospect coming up through the minor leagues. He has been described as “freakish” in his size.

Frank strikes out nearly 30% of the time and walks nearly 17% of the time. 53% of the time his bat touches the ball a hit occurs. 30% of those hits are home runs.

Frank compiled these numbers through 81 Games and 352 PA.

Player 2: “Tom”

Tom is a young player, but he has been around long enough that he is verging on a veteran. He has been described as a “model slugger.”

Now in his eighth season, Tom has a career BABIP of .320, K% of roughly 28%, BB% of roughly 11%, and HR/H Ratio of 26%.

This season his BABIP is .299, his BB% is 10.5%, and his K% is roughly 24%. 38% of the time his bat touches the ball a hit occurs. 27% of those hits are home runs.

Tom complied these numbers through 83 Games and 352 PA.

Player 3: “Dan”

Dan is a young player, but he has a considerable track record. He has been described as one of “the most valuable properties in the game.”

Now in his sixth season, Dan has a career BABIP of .301, K% of roughly 17%, BB% of roughly 7%, and HR/H Ratio of 16%.  

This season his BABIP is .234, his BB% is 8.6%, and his K% is roughly 20%. 29% of the time his bat touches the ball a hit occurs. 24% of those hits are home runs.

Dan compiled these numbers through 82 Games and 360 PA.

Here is the survey link: https://goo.gl/forms/Fd7StZznZqQ5Brth2

I will follow up with an article a week after this is published, showing the results, revealing who the players are, and assessing what the projections expect from those players the rest of the year.


T.J. Rivera Looks Like the Real Deal

T.J. Rivera has had a remarkably unlikely path to the majors, going from an undrafted free agent to now the Mets’ starting third baseman. He has always had his doubters, and still does, but he got to the majors by consistently putting up around a .300 average in the minors with an above-average OPS despite his lack of walks and power. In 2016, a hitter-friendly park helped him enjoy a career year in Triple-A, winning the PCL batting title with a .353 average, a .909 OPS, a 142 wRC+ and a promotion to the majors for the first time in his career at the age of 27. He continued his success into the majors, where he was a key piece in the Mets’ 2016 Wild Card run. He was able to replicate the numbers he had put up during his entire minors career, batting .333/.345/.443 with a 119 wRC+ in 113 plate appearances.

Rivera’s impressive and somewhat surprising debut stint in the majors eased some of the concerns scouts had with his game, but plenty of people still had their doubts. The expectation was that Rivera would not be able to hit for a .300+ batting average in the majors like he did in the minors due to the tougher competition and better defenses. Rivera proved them wrong by hitting .333, although he was admittedly helped out by an unsustainable but certainly not outrageous .360 BABIP. Rivera posted BABIPs comfortably over .300 in the minors, so while some regression seemed to be in store for his future, it was certainly not crazy to predict that Rivera would still be able to hold a .300 average in the majors. If he had any chance of becoming a full-time starter at the highest level, he was going to need to keep that batting average in the vicinity of .300 to make up for his lack of other skills, such as patience, power, and defensive ability.

Rivera has always been known as a line-drive hitter with an aggressive approach at the plate. He likes to swing early in counts, and as a result he doesn’t walk much, but at the same time he is a contact hitter and doesn’t let his aggressive approach negatively affect his strikeouts. He doesn’t have much natural power, so for him to be successful, he just has to continue focusing on trying to hit line drives to the gaps and swinging at the right pitches.

In his first sample of major-league pitching, he was able to hit line drives at an above-average rate of 23.9%, compared to the MLB average rate of about 21%. It’s worth mentioning that this rate was higher than his typical LD% in the minors, showing that he was actually hitting more line drives vs. major-league pitching than minor-league pitching. He hit ground balls at a rate of 42.4%, which was also lower than he generally hit in the minors, and of course, preventing the amount of ground balls you hit leads to more success at the highest level, especially when you’re hitting them to the best infielders in the world. This GB% was slightly lower than the MLB average of about 45%, showing that some work could still be done on his GB% but that it wasn’t a serious problem. He also may have been helped about by a bit of luck on some of these ground balls, as he had a .360 BABIP that was sure to regress a little. Rather than hitting ground balls, the thing he needed to work on was hitting fly balls, which he did at a slightly below-average rate of 33.7%. For someone with not a lot of raw power, hitting more fly balls would be beneficial to making the most of whatever power he did have.

Overall, Rivera’s results in the majors had been a very pleasant surprise, don’t get me wrong. The key thing he showed in his 2016 debut is that he was not over-matched by major-league pitching, continuing to do the same things that made him successful in the minors. But in 113 plate appearances, he drew a grand total of three walks, which won’t quite cut it if you want to be an everyday starter. In addition to that, he was only making hard contact (according to FanGraphs) 27.2% of the time, below the MLB average of about 31%. Being the line-drive hitter that he was, he had the ability to hit the ball harder, and the thing he needed to do was to focus on hitting more fly balls and improving his launch angle by just a tick. This doesn’t mean that he needed to become a completely different hitter, but hitting the ball a little higher in the air more rather than on the ground or in a straight line would benefit him in not only his average but his isolated power, and also help him hit for a BABIP that would be less likely to regress.

Things got off to a bit of a slow start in 2017 due to lack of playing time and a short stint in Triple-A, but as injuries have befuddled the Mets, he has received more and more playing time, and at this point has basically hit himself into a starting role at third base.

As of July 15th, Rivera has hit .304/.350/.464. A chunk of this production has come in his last 10 games, where he’s hit nearly .500 en route to a 10-game hitting streak. Still, that batting line is “classic T.J.” At first glance it might seem like a small drop-off from last year, but if you look a little deeper, Rivera has actually improved in quite a few areas compared to last year.

First off, he has slightly decreased his soft-contact rate since last year by 2% while increasing his hard-contact rate by 4.2%. Immediately this looks like a recipe for success; hitting the ball harder more often and softer less often cannot be a bad thing.

While hitting the ball harder compared to last year, he’s also hit more fly balls, improving from a slightly below-average 33.7% last year to an above-average 40.1% this year, while also decreasing his GB% by 6.9%. So he’s hitting the ball harder, he’s hitting more fly balls, and he’s hitting fewer ground balls. These were all little things that I mentioned earlier that he could tweak to become a more polished hitter, and he has improved slowly but surely in these minor aspects of his game.

But at heart, Rivera is still the same hitter, just a better version of himself. He’s still a line-drive machine, with an LD% just a tiny bit higher this year compared to last year (24.3 vs.23.9). This shows that he has improved on hitting the ball harder and in the air while still playing his usual game. And, as it should, hitting the ball harder has caused his ISO to increase from .143 to .160, meaning that he’s taking better advantage of the power he has.

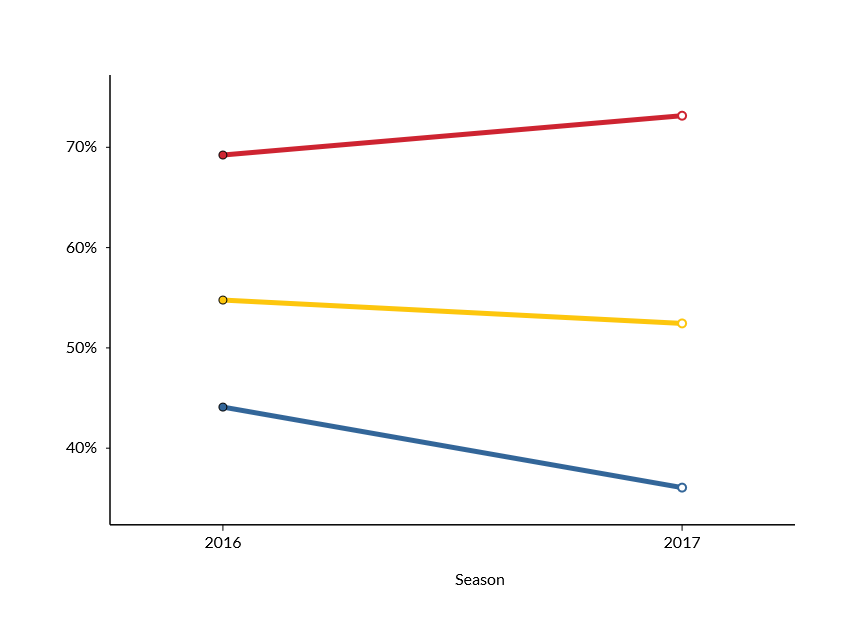
While he is still aggressive and still likes to swing early in counts, he’s also improved his walk rate slightly, from a measly 2.7% to a still below-average 4.5%, as Rivera’s plate discipline has slightly improved this year. Here’s a graph of his amount of pitches swung at outside the zone (blue), inside the zone (red), and overall (yellow).

swing1

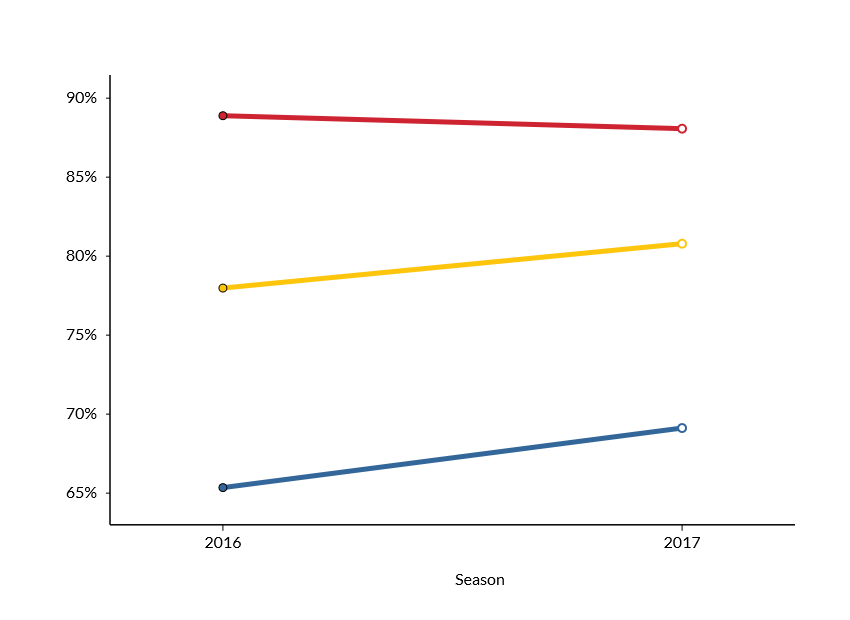
He’s become slightly more patient and selective, swinging at more pitches in the zone and fewer pitches out of the zone. The data also shows that he’s swinging at the right pitches, as here’s a graph of his contact rate outside the zone (blue), inside the zone (red), and overall (yellow).

contact.png

As you can see, he’s making contact at about the same rate on pitches in the zone, while the pitches he’s going after that are outside the zone have generally been better pitches to hit, as you can see by his increased O-Contact%. Even more importantly, he’s swinging and missing less, as last year he swung and missed an above-average 12.1% of the time while this year he’s swinging and missing at a slightly below-average rate of 10.2%. Rivera will always be a contact-first type hitter, but he’s tweaked some minor flaws in his game and is actually molding into more of an all-around hitter than people may think.

So why is his batting line appear slightly worse than last year, if he’s doing so many things better? Well, it’s really only his batting average that has declined, and that’s mostly due to a BABIP .024 lower than last year. In the minors, Rivera had always been able to keep a BABIP in the mid-.300s, so with a BABIP of .336 this year and the fact that he’s hitting the ball harder and in the air, there shouldn’t be any regression this year; in fact, his batting average is more likely to go slightly up than down. He’s improved his on-base skill and power to the point where they are still below-average skills, but they are respectable enough that his excellence in hitting for average and hitting line drives outweighs them.

So T.J. Rivera really seems like a major-league starter this year, proving that his amazingly consistent minor-league numbers and impressive MLB debut were not flukes. His defense is admittedly mediocre, as he’s accumulated -2.0 defensive runs in his career according to FanGraphs. But there really is no doubt that he can hit. This guy now has a .322/.367/.439 batting line in 3,225 professional plate appearances, so I think it’s time to stop doubting what he can do and let him play every day, because with the improvements he’s made in his game and the way he’s been able to adjust to major-league pitching, he absolutely deserves it.


Aaron Judge Among 25-Year-Old Rookies

The phenomenon that was Aaron Judge’s first half was indeed a sight to behold. Thirty home runs before the All-Star break? Get in line for some hardware.

As some have noticed, as impressive as Judge’s power display has been, he is still a 25-year-old rookie. Now, it used to be that holding rookie status at 25 was perfectly fine, but Trout, Harper, Correa & Co. have jacked up rookie expectations a bit. Players as good as Judge has been at 25 are increasingly often almost this good at 22 or even younger.

But that’s not the point today.

The point today is this: Aaron Judge is on track to have an unprecedented season for a 25-year-old rookie.

Judge’s season already ranks 5th in home runs and 4th in WAR since 1901 for players with rookie status at 25 years of age. Even if he comes down to earth in the second half, he could — should — easily clear first place in both measurements. He only needs six home runs and 0.8 WAR do so. Additionally, his wRC+ has 30 points of leeway for him to maintain first place in that stat as well.

So, it will be a disappointment if Judge does not end up with the best 25-year-old rookie season ever.

Let’s not end the story there. I’d like to examine the full careers of some of those players who still, for now, rate ahead of Judge by wRC+ and home runs. We’ll keep things in the expansion era and stick to three: Tony Oliva in 1964, Mitchell Page in 1977, and Ron Kittle in 1983.

Tony Oliva, 1964 Minnesota Twins (32 HR | 148 wRC+ | 6.2 WAR)

Oliva never hit 30 home runs again and only once more exceeded a 148 wRC+, but he put together a terrific career for the Twins, with 41 WAR, 220 homers, a 129 wRC+. So he gives hope that even if Judge never hits for this much power again, he can still have a very fruitful career. This statement seems very modest now, but Page and Kittle weren’t so fortunate as Oliva.

Mitchell Page, 1977 Oakland Athletics (21 HR | 157 wRC+ | 6.2 WAR)

Page radiated brilliance as a rookie, competence as a sophomore, and was then roughly replacement level for the remainder of his career. I can’t tell you much about what happened to Page, but this newspaper article is an interesting one. Injuries and a dispute with infamous owner Charlie Finley may well both have played a role in Page’s decline.

Unlike Judge, Oliva, and Kittle, Page’s game was not reliant on home-run power. He hit 28 doubles, 8 triples, and stole 42 bases in 1977. But he probably had the best rookie season we’d seen from a 25-year-old until this year. Unfortunately, the rest of his career did not live up to that standard.

Ron Kittle, 1983 Chicago White Sox (35 HR | 118 wRC+ | 2.0 WAR)

Kittle currently holds the “record” for most home runs by a 25-year-old rookie, but he had a weaker rookie year than Oliva or Paige. He also hit 32 home runs the next year, 26 the year after that, and then 21. After that, he never hit more than 18 and could never again make 400 plate appearances in a season. Kittle was great in 1988-89 but only had a combined 450 PA those years, putting up 2.8 WAR and 29 homers.

Kittle ended up hitting a home run every 17 times he stepped to the plate in his career; he just didn’t step to the plate often enough, field well enough, or run the bases well enough to gain more than 5.2 WAR in 3013 PA.

It takes more than power to succeed at major-league baseball. Judge seems to have more than just power, with six steals and a potentially decent glove in right field. He’ll still have to maintain other skills — and stay healthy — to avoid Kittle’s fate. He is very likely to do so, but nothing should be taken for granted.

Conclusion

Oliva, Page, and Kittle (or Jimmie Hall, whose career ended up looking like a rich man’s Kittle or poor man’s Oliva) can’t really tell us all that much about what Aaron Judge’s future may hold.

They are only three players out of many, and we didn’t even look at 24- and 26-year-old rookies.

Kenny Lofton was also a 25-year-old rookie who performed admirably and went on to produce a fantastic career, and whose rookie year did not end up a career year. We didn’t look at Lofton because he is such a different player than Judge, but Lofton is a much better precedent for 25-year-old rookies looking to build on their success than Oliva, Page, and Kittle.

Mark Trumbo is also worth mentioning. He hit 29 home runs as a rookie and has since exceeded that mark three times, although his non-power skills have always been lacking.

This piece is getting longer than expected and it’s time to wrap up.

The careers of Oliva, Page, Kittle, and Hall do contain a couple potentially foreboding patterns. Their rookie home-run numbers remained their single-season career highs, and with the exception of Oliva in 1971 and Kittle in some parts of seasons, none of them ever improved on their wRC+ either.

Aaron Judge is his own player, and will almost certainly have a better rookie year than any of these three comparisons managed. Given that, we can also expect a better career than they managed. And, of course, it’s no shocker to suggest that a near-200 wRC+ will eventually regress.

However, perhaps it is worth wondering about the future of a 25-year-old rookie and whether to treat it the same as a, say, 22-year-old’s future.

Or perhaps it’s not. Regardless, you should ignore me anyway and enjoy Aaron Judge’s mammoth displays of power. The Yankees certainly enjoy it.