Newcomers Find Their Way at Home

The Boston Red Sox have been tightly related with highly-touted prospects during the past months and even years. Taking a quick look at MLB.com’s Top 100 Prospects rankings from 2015 to 2017, we find two names come up fairly consistently. Those belong to infielders Yoan Moncada and Rafael Devers. The former entered the 2015 ranks as “the best teenage prospect to come out of Cuba since Jorge Soler in 2011” and signed with Boston for $31.5 million, which smashed the biggest amount to date registered by the Reds’ signing of Aroldis Chapman for $16.25 million. While Devers’ price ($1.5 million) was nothing close to Moncada’s, he was also praised as “the best left-handed bat on the 2013 international market.”

Multiple names from the 2015 class of prospects have already seen large major-league play time (Byron Buxton, Corey Seager, Joey Gallo and Aaron Judge), and the time has come for Moncada and Devers to start writing their full-time MLB stories. In the case of Moncada, Boston opted to trade him to the White Sox for Chris Sale during the past off-season while keeping Devers in town. Anyway, and as things have turned out, both have practically debuted in parallel during this season for their franchises, being called up for quite different reasons. In the midst of a complete rebuild, Chicago will count on Moncada to take on the third-base position from now on. Boston, on the other hand, wanted to improve their infield a hair and seem to have opted for Devers as an in-house solution to their woes.

As the date of the writing of this article, this is, Tuesday, July 25 (better known as National Rafael Devers’ Day given his major-league debut with the Red Sox), Moncada will have the chance to play as much as 65 games and Devers 60. They will probably not reach those numbers — at least not Devers, knowing Boston’s contender status and probable use of platoon hitters during the rest of the season. Another fact of interest is that Yoan Moncada is 22 years old and Rafael Devers is just 20. So, those numbers will make for a baseline on what to look for during the rest of this article, which will focus on how call-ups perform in their debut seasons, both home and away.

Prospects made huge jumps just going from the minors to the majors, change cities and clubhouses, meet new teammates, and much more, but you would guess that after settling in they’d produce more at home than far away from it. In order to actually know if this holds true, I ran a set of queries on Baseball-Reference.com to find out. I’ll be looking at rookie-season splits from 2000 to 2017 in which the players debuting were between 20 and 22 years of age (such as those of Moncada and Devers). A total of 87 players within those parameters have seen major-league action during the selected time span. So we’ll be working with 174 home/away splits in order to know if rookies of ages 20-22 have historically played better at home or away from it as we may expect.

First of all, I’ve looked at “playing time” stats, this is: games, games as a starter and plate appearances. As much as we could expect players to perform better at home than away over their first few games, we could expect teams to “protect” their rookies and deploy them more frequently at home than on the road. As it turns out, though, the statistics for the home and away splits are virtually the same for the three mentioned categories. First myth debunked.

Moving on to what really matters, production, we can try and see how well players have hit in their ballparks compared to other venues, and whether there are or not big differences in this aspect.

Subtle differences start to appear between the games played at home and those played away in terms of runs scored and hitting. There are no big differences between the splits, surely, but it seems that home performances have edged away ones by a hair during the past 17 years on average. The biggest different in any of the studied statistics comes in both the doubles and home-run categories at 0.3 points each in favour of the home split.

Another interesting set of statistics to look at are those related with base-stealing. By logic, players would be expected to feel more comfortable, confident and willing to steal bases at home rather than in other parks. Again, that preconception seems to be wrong. Between the 87 players studied, the average of steal attempts was higher away than at home, and even the success was five points higher when stealing in other ballparks rather than in their own one.

Finally, we must turn our attention to the game of percentages and look at the slash line of the analyzed players in terms of BA, OBP and SLG. On top of that, I included the average tOPS+ and sOPS+ values. The former of those last two is meant to represent the player’s OPS in the split relative to that player’s total OPS during the full season (not accounting for the home/away split), with a value greater than 100 indicating that he did better than usual in the split. The second one is the OPS in the split relative to the league’s split OPS (again, a value greater than 100 indicates the player did better than the league in this split).

And here is where our home/away splits, once for all, truly separate themselves. Not one, not two, not three, but every percentage value posted at home by the average 20-to-22 year-old rookie from 2000 to 2017 has been better than the number registered far from it, and not by little. The difference in BA is of 15 points, in OBP of 23, in SLG of 23, in tOPS+ of 13 and in sOPS+ of 4. That yields an average difference of 20.3 points in the slash line and of 8.5 in the OPS+ metrics, which is huge. It is interesting to see how the average rookie performance is under the league-average level (under 100 sOPS+) both at home and away, but how said average was able to put up much better numbers at home (106 tOPS+) than away (93 tOPS+).

Just in case the rest of the data didn’t make it clear, which it actually didn’t, this leaves no doubt or case for equity open. After all, rookies probably prefer to play at home, sweet home.

But now that we know that newcomers not older than 22 years when they play their first major-league games tend to perform better at home, it is just a thing of curiosity to explore some of the unique cases that have occurred during the past 17 seasons to the 88 players of our study. We have been looking at the average rookie during the past few paragraphs, but as expected, each case is unique in itself and would make for a complete study on its own. Next is a table containing the rookies with a 45+ point differential in tOPS+ (with at least 60 games played), so we can measure how different their production was at home and on the road. Players are ordered by the absolute difference, with negative values meaning their production away was better than that at their home ballpark.

As it turns out, only 16 of 72 players had differences of 45+ points in tOPS+ between their games at home and those played away. Of those 16, though, seven were better far from their team’s stadium, something not really expected, much less in the case of Stanton and his minus-94 differential.

Just for fun, let’s look at Giancarlo’s case, whose split numbers are radically different while having played almost the same amount of games home and away during his rookie season. In 180 PA at home he hit 29 balls, including 7 home runs, for a BA/OBP/SLG line of .182/.272/.599 and 52 total bases. In 216 PA away he hit 64 balls with 15 home runs, posting a .320/.370/1.020 slash line and getting 130 total bases. What could be seen as a terrible entry year by looking at just the production at home (league-relative sOPS+ of 60) turns into a monster season while considering what Stanton was able to do outside of Miami (183 sOPS+). Something similar happened to Jay Bruce, Logan Morrison or more recently Miguel Sano, only in opposite venues.

As a final note, it can also be seen how only six of the 16 players in the table above had a big differential while debuting prior to 2010. The other 10 players made their debuts from 2010 on, which could mean that the trend is for rookies to have much more variable productions in different venues that the average historical newcomer.

We still don’t know how Moncada and Devers will perform during the rest of the season, but if that last supposition holds true, then White Sox and Red Sox fans just can hope for their players to at least do more damage at home than away, so they get to watch their jewels explode in front of their own eyes instead of between different ballparks around the nation.
What Is a Pitcher? What Is a Batter?

When we consider individual baseball players, we think that we understand how to divide them into pitchers and hitters. Clayton Kershaw is a pitcher, we say confidently, and the recently-traded Nori Aoki is a hitter. But from the perspective of the statistical record, the question can be a little harder to answer. Kershaw, after all, had appeared in six more games as a pinch-hitter or pinch-runner than he has as a pitcher through 2016, and Mr. Aoki stood on the mound and induced a fly out from Aaron Judge earlier this season (among other less satisfactory results). Is there a programmatic way to divide baseball players into hitters and pitchers from the perspective of the statistical record?

For me, the question isn’t merely academic: I am building a baseball trivia game, and it is very important for the rules of the game that I be able to programmatically divide baseball players into hitters and pitchers. In particular, I need to divide players into pitchers and hitters over the course of their careers, not merely from the standpoint of a particular season or game. And I need to do so definitively: a player can’t be both a pitcher and a hitter. The data that I am working with for my baseball trivia game comes from Sean Lahman’s database, and includes batter seasons and pitcher seasons back to the 1870s.

The Lahman database does not attempt to disambiguate between hitters and pitchers, merely including hitting seasons and pitching seasons. If a player only hit, that’s a hitter; if he only pitched, that’s a pitcher. Easy enough, but there are of course complications. Pitchers bat in real baseball, so there are lots of hitting seasons by pitchers in the data. And sometimes, as noted above, hitters pitch in blowouts, so there are pitching seasons by batters included as well.

Then there’s Babe Ruth, who really was both a pitcher and a hitter, you might say, throwing lots of innings in the 1910s before becoming a full-time hitter in the ‘20s. What does it mean to pitch and hit “a lot”? Carlos Zambrano was a pitcher, informed baseball fans presumably agree. He was also a decent hitter and was used as a pinch-hitter fairly often. He’s not a batter, though. Right?

Here’s the programmatic metric that I’ve decided on and used to divide players in my game:

According to the Lahman database, there have been 5,277,522 batter games and 1,064,580 pitcher games in baseball history through 2016. That’s a ratio of about 4.95 batter games to 1 pitcher game. Any player with a higher ratio should be classified as a hitter, any lower as a pitcher. That is my claim: any player with a higher ratio of “Games appeared in as a batter” to “Games appeared in as pitcher” is a batter, and the player is otherwise a pitcher. Some data points that fall out of this classification:

Ruth: 2503 hitter games, 193 pitcher games: 12.9 ratio: Hitter

Kershaw (through 2016): 288 hitter, 282 pitcher: 1.02 ratio: Pitcher (Kershaw has been used as a pinch-hitter and pinch-runner, stupidly, from time to time)

Zambrano: 384 hitter, 354 pitcher, 1.08 ratio: Pitcher

Rick Ankiel: 653 hitter, 51 pitcher: 12.8 ratio: Hitter

We might be interested in “hittery” pitchers or “pitchery” hitters: players whose ratio of batter games to pitcher games approach the dividing ratio of 4.95 to 1. By this metric, the “hittery-est pitcher” with a career of any length is Jimmy “Nixey” Callahan, who pitched and played left field for various Chicago teams and the Phillies in the late 1890s and early 1900s.

The “Pitchery-est hitter” is John Ward, who was mostly a pitcher for the Providence Grays for seven years and then a middle infielder for various New York teams for a decade. He’s about twice as “pitchery” of a hitter as Ruth.

Most of the real double-duty guys played in the dead-ball era. A man named Hal Jeffcoat played CF and often provided relief innings for some lousy Cubs and Reds teams in the 1950s. Eno Sarris mentioned him in the context of an article on two-way players earlier this year. In our modern era of extreme specialization, not-too-good OF turned not-too-good pitcher Brooks Kieschnick is about as close as it gets.

It might be slightly more precise to use Innings Pitched and Innings As A Batter Or Fielder, but that would introduce some problems (that I am eliding here) and probably wouldn’t move the ratio very much. What do you think? How would you programmatically and consistently divide players into batters and pitchers?

If you’d like to be a beta tester for the trivia game, or be kept in the loop for when the game is released, sign up here.


Challenging Conventional Wisdom About the Trade Deadline

The MLB trade deadline has passed, and you may be happy or disappointed that your favorite team is going to be stuck with the players they now have until the end of season. Actually, that’s not true. Trades can be made until August 31, but any player swap after the deadline invokes the waiver-wire process, which allows any other team to block a trade or claim a waiver player for themselves. So, deals that will have any sort of impact will usually happen just before the deadline.

This year’s trade deadline involved the names of mostly pitchers — Sonny Gray, Yu Darvish, Jaime Garcia, David Robertson, Sean Doolittle, Addison Reed, Francisco Liriano, and others were all traded near or almost at the deadline.

The Dodgers, whose pitching staff so far has led the league in FIP, ERA, WHIP, and rank third in K/BB ratio, added Yu Darvish, a pitcher who hasn’t been his best this season, but who can certainly turn a great rotation into a nearly unbeatable one in a five-game or seven-game series. The Cubs, whose bullpen ranks 10th in fWAR, brought in left-handed reliever Justin Wilson from the Tigers, who presumably will fill the role as the set-up man for Wade Davis. The Yankees supplemented a bullpen that ranks fourth in ERA and WHIP, and second in K/9, with Sonny Gray and David Robertson. Sean Doolittle and Brandon Kintzler were sent to the Nationals to help solve their bullpen issues which have resulted in the second-worst ERA in the league. On the same day that Lance McCullers was placed on the 10-day DL, the Astros traded for Francisco Liriano to add some stability to their rotation/bullpen as they are all but guaranteed a postseason spot.

But every year, we hear talk about which teams will buy or sell. The teams who have little to no shot of making the postseason, are obviously more likely to sell. The decision-making gets interesting when looking at teams that are “on the bubble.” Front offices must decide whether to go all-in for the current year, possibly giving up young prospects for proven stars to fill needs they see in their team, or to take the seemingly less-risky route of keeping your prospects and attempting to fill your needs with lesser players on the trade market and hope that it’s enough to make a run in the postseason. And if it doesn’t work out, at least you didn’t give up your future stars.

This is the conventional wisdom that’s being challenged by some teams, and needs to be examined more. The truth about the postseason in professional baseball is that you don’t know when you’ll have that chance again, no matter how many top-100 prospects you have. The Washington Nationals infamously shut down Stephen Strasburg in 2012 following the logic that it would be better to save their starter for future postseasons rather than “risk it” that year. And of course, the Nationals have not won a postseason series since. Had they managed Strasburg so that he could have pitched into October, who knows what would have happened. Win probabilities show that is far easier to predict who will make the playoffs then what will happen once those teams get there. So if you have a chance to make the playoffs, you should go all-in for it.

This is exemplified by the win probabilities calculated at FiveThirtyEight.com. As of this article’s writing, the Dodgers have a greater-than 99% chance of winning their division, and a 23% chance of winning the World Series, and the same can be said about the Astros. The Nationals, Indians, and Cubs all have a ten, nine and eight percent chance of winning the Fall Classic, respectively. But all three of those teams have an 84% chance or better of making the playoffs. The point is, you could be the Dodgers or the Astros and be having a historic season, and still “only” have a 23% of winning the World Series. Now, this year is unusual. Typically, even when baseball teams are really good, their World Series chances are less than 20%. Comparing this to basketball, the Warriors, dominating the NBA in a similar fashion that the Dodgers and Astros are in the MLB, had a 48% chance of winning the title at a similar point in their season. So even when there seems to be a lack of parity in the game, baseball’s postseason still has a relatively higher level of unpredictability. These win probabilities are the data that should be driving the decisions of teams as they near the deadline, particularly if they have even a small chance of getting to the playoffs. Because you can never have enough talent to guarantee a chance to win the pennant or the World Series.

Obviously, these decisions are limited by payroll and the contracts of the players you have at the time. But the overall idea that a team who has a small chance should wait and build even more so that they have an even better chance of making the playoffs the next year or some other year down the road — it needs to go. The Dodgers were smart to add a great starting pitcher in Yu Darvish despite already having arguably the best staff in baseball. And the Yankees and Cubs were smart to bolster their previously strong bullpens. What is interesting is that, once again, the Nationals, who have one of the worst bullpens in the league, did not push harder for Sonny Gray or Justin Wilson. They got Sean Doolittle, who is good (4.10 ERA and 0.3 WAR in 2017 according to bbref.com) and Brandon Kintzler, who has been slightly better (2.78 ERA and 1.2 WAR in 2017). It’s also interesting to see that the Red Sox, whose offense ranks 23rd in wRC+, did not go after more hitters close to the deadline, and settled for reliever Addison Reed from the Mets. The Red Sox currently have a 6% chance of winning the World Series according to FiveThirtyEight. If their offense doesn’t pick up, their reluctance to find that power bat could be the difference.

But the Rockies, who currently have a 2% chance of winning it all and whose relievers’ ERA ranks 23rd at 4.52, acquired Pat Neshek and his 2.1 WAR from the Phillies. The Diamondbacks added J.D. Martinez to a powerful lineup that likely has more in them than they’ve showed recently, seeing that they are fifth in hard-contact percentage, but 16th in wRC+. Both of these are smart moves by the front office; on the other hand, Mike Rizzo of the Nationals and Dave Dombrowski of the Red Sox will have some questions to answer if their teams don’t make decent runs into the postseason.

Hopefully, we continue to see more teams who have at least a 2 or 3% chance of winning the World Series go all-in at the trade deadline. I’m not claiming that the reasons other teams weren’t more aggressive at the trade deadline are because they’re concerned about losing prospects, but it is worth noting that teams often make the mistake of not going all-in because they don’t believe they have a high enough chance of winning it all, when the reality is that you don’t. You just need a somewhat reasonable path to the playoffs, where the x-factor of unpredictability comes into play and anything can happen.


Even Without Brad, the Padres’ Pen Will Be in Good Hands

As with most rebuilding teams, the San Diego Padres aren’t in any particular need of a strong bullpen, and they’ve handled this season’s trade deadline accordingly. As of July 30, they’ve already traded away Ryan Buchter and first-half closer Brandon Maurer, and relief ace Brad Hand is expected to follow this offseason. The rest of San Diego’s bullpen is, for the most part, unexceptional; not including Hand, the most-used relievers still on the team are Craig Stammen and Jose Torres, neither of whom have a positive WAR or a FIP under 4.50.

It’s fortunate for San Diego, then, that Kirby Yates has quickly become their most reliable non-Hand option in relief. The team plucked Yates, a relatively unknown 30-year-old Hawaiian right-hander, from the waiver wire in late April, prior to which he’d spent time as a Ray, a Yankee, and, for one inning in 2017, an Angel. Minus a disastrous 2015 season, due in part to a HR/FB ratio of over 30%, both Yates’s FIP and xFIP have consistently been below 4.00. He’s also demonstrated an impressive strikeout ability over the past few years; his K rates in ’14 and ’16 were both approximately 27%, and in 2015, his worst season, he still managed to strike out nearly 23% of batters faced.

Since his move down the California coast in April, though, Yates has emerged into the Padres reliever perhaps most likely to take over the closer role — assuming Hand is dealt as expected (ed. note: oh well) — and has been one of the more unexpectedly impressive relievers of 2017. In prior years, Yates’s terrific strikeout rate was often coupled with a walk rate that was passable at best (7.6% in 2015) and dreadful at worst (10.3% last season). This season has seen progress in both areas — his BB% is down to 6.3%, and he’s struck out over 38% of the batters he’s faced. Yates’s improvements in strikeout and walk percentage have been sufficient to land him among the league leaders in both K%, where he ranks seventh among qualified relievers, and K-BB%, where he ranks fifth, at 31.9%. For reference, Andrew Miller ranks sixth at 31.0%, and other members of the top five are comprised of arguably the best relievers in the game, including Craig Kimbrel and Kenley Jansen.

Of course, it’s a bit premature to tout Yates as a Kimbrel-quality option out of the Padres’ bullpen. He doesn’t have the same electric stuff, or anything near the track record, of his peers on the league leaderboards, and he’s been the beneficiary of a strand rate of almost 91%. At 3.09 and 3.01, his FIP and xFIP, respectively, are also significantly higher than his 2.23 ERA, so there’s a fair bit of evidence to suggest that Yates isn’t as good as his basic stats indicate. With that being said, though, there’s a lot to like about Yates’s performance this year. There’s nothing fluky about a 38% strikeout rate, and his SIERA score, at 2.24, has been far more bullish on Yates than have his FIP and xFIP. So while Yates isn’t necessarily becoming the next great San Diego closer, his improvements this year are far too drastic to be chalked up entirely to luck.

Instead, I believe there are a couple interrelated reasons for Yates’s recent success. In June, Jeff Sullivan wrote about Brewers starter Chase Anderson’s 2017 breakout, noting that Anderson had started shifting his location on the rubber. Against right-handed hitters, Anderson began his wind-up from the far right side of the rubber; this was, as Sullivan explained, about “playing the angles,” adding that Anderson could get his pitches “sweeping away” from these batters.

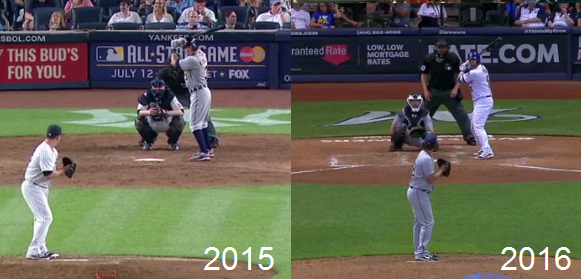
Yates, it appears, has followed the same line of thinking. Compare the starting point of Yates’s delivery between the past two seasons:

rubber

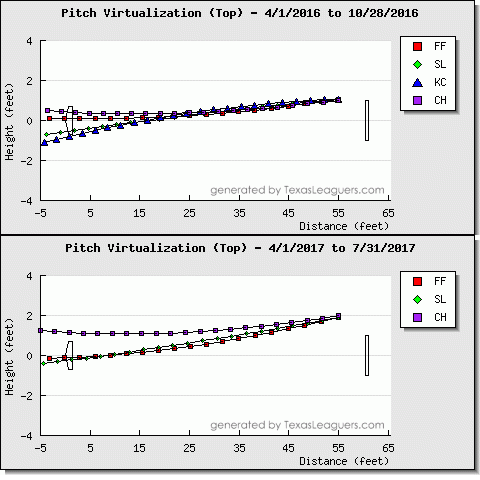
We can also see how much his pitches’ respective routes to home, as illustrated by PITCHf/x, have changed since last season:

pitchpaths

Compared with a .283/.372/.457 slash line in 2016,  righties are hitting just .171/.227/.305 against him this year, with a .227 wOBA and .224 xwOBA. With Yates’s new starting point on the rubber, his pitches have been able to more effectively “sweep away” from right-handed batters, since they start significantly farther to the right, and he’s seen excellent results against righties in particular. This effect, I believe, has been a significant contributor to Yates’s success. As the above graph indicates, his fastball and slider travel most toward the outer section of the plate, which may be giving right-handed hitters more difficulty in the batter’s box.

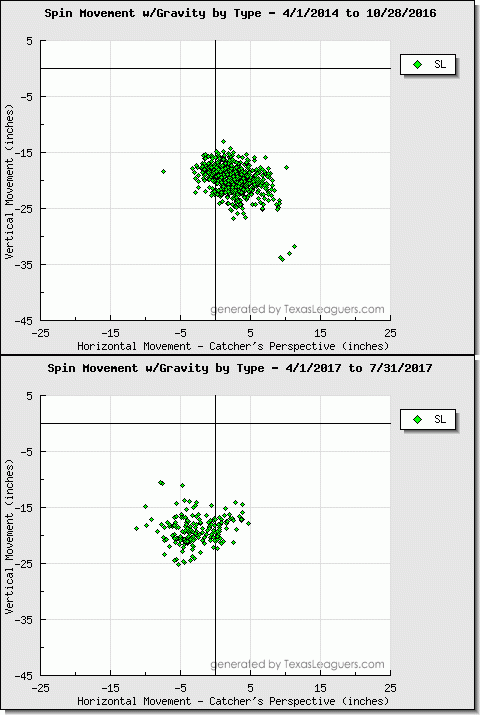
However, that’s not the only interesting development regarding Yates’s slider. According to PITCHf/x, he’s throwing roughly four percent more sliders against right-handers, and his fastball usage has declined by roughly the same amount. His slider hasn’t spun the same this year as it has in the past, either: according to PITCHf/x, the pitch’s spin rate has risen from 594 to 1,962 RPM this season. (I should note that Baseball Savant sees a negligible difference in the average spin rate of Yates’s slider, so there may be an error in the data.) Regardless, it’s hard to deny that the pitch’s movement has changed:

sliders14-17

As evidenced by the wide spread in 2017, Yates’s slider still seems like a work in progress, but it’s clear that the pitch has taken on some new movement. FanGraphs, through PITCHf/x, scores his slider’s xMov as having shifted from 1.4 to -2.2, indicating that the pitch has actually begun moving toward right-handed batters. This doesn’t invalidate the merits of Yates’s shift on the mound, though — the new angle might still be affecting how righties pick up his pitches, and the majority of his sliders do tend toward the outer half of the plate, thus still “sweeping away” from the batters.

Yates briefly spoke on his slider in a May interview with Jeff Sanders of the San Diego Union Tribune, saying the pitch was “getting back to where it used to be.” I found this a curious phrase for Yates to use, seeing as how the pitch has done anything but revert back to its old movement. His next sentence, however, may answer this question. Yates says he’s “incorporated a splitter that [he] feels pretty confident in,” and later mentions that over the offseason, he developed the pitch as a sort of contingency plan against an occasionally less-than-trustworthy slider.

I’m not very familiar with the inner workings of PITCHf/x, but it seems possible that the system could be classifying some of Yates’s new splitters as sliders. Not only would this account for the change in his slider’s horizontal movement, but it’d also explain Yates’s description of the pitch. Overall, though, I believe Yates’s newfound success can largely be attributed to the above adjustments he made over the offseason. He may not become the next Trevor Hoffman, but Yates has shown the Padres more than enough to feel a bit more comfortable with their bullpen, even after Brad Hand is dealt this winter.


Where Are Anthony Rizzo’s Missing Hits?

Anthony Rizzo is hitting just .257 this year with a .242 BABIP. A fantasy-league mate of mine proclaimed “Rizzo sucks this year” after a recent trade. However, the only thing I can see that’s changed is his BABIP. He’s on pace for 106 RBI and 95 runs after totaling 109 RBI and 94 runs last season. His ISO is an identical .252. For all intents and purposes, he’s the same hitter, except he’s missing some hits. My league-mate chalked this up to “he’s getting shifted more” or “he’s worse hitting against the shift.”

One of those two things is correct. Rizzo has faced a shift in 85.7% of his plate appearances this year, which isn’t different from the 85.5% he faced last season. Rizzo is, however, hitting only .247 on balls in play when facing the shift (.214 when not shifted) this year. This is a 54-point swing in BABIP from a year ago (.301 while shifted; .359 when not shifted). This amounts to 13 missing hits thus far this year against the shift (and six more when not shifted). For the purposes of this article I want to focus on the missing hits against the shift.

What we have here is the symptom of something that’s going on when Rizzo is hitting this year that wasn’t happening as much last year, so I started sniffing around for other major changes in the Rizzo data. One thing that popped into my head was that the Cubs offense, especically the top of the order, has been getting on base much less this year than last year. That led me to thinking about what the defense looks like when there are runners on base versus when the bases are empty.

For a reference point, this is a typical shift against Rizzo with no one on base:

Rizzo_Shift_No_One_On_Base

With only a runner on first base, the shift is the same, but with the obvious addition of the 1B holding the runner on.

In 2016 Rizzo batted with runners on base in ~55% of his plate appearances and ~32% of the time with runners in scoring position. In 2017 those numbers have dropped to ~45% and ~24%.

While I don’t have Rizzo-specific defensive placements for all his batted balls in play, I did compare his spray charts from last year and this year and noticed two very empty spots.

The first spot is just behind the second-base bag, where the SS typically lines up in the over-shift against Rizzo. In 102 games this year, Rizzo has yet to collect a hit to this part of the field, while he had six hits within this area of the field last year and a few more just behind it to the opposite-field side. Using the FG splits tool we can see Rizzo has an .054 AVG in this area of the field this year vs. .333 from a year ago.

Rizzo

The second empty spot is where you’d find line drives to the opposite field falling in before the left fielder. This led me to look into Rizzo’s batted-ball distribution to the pull side and opposite-field side for both ground balls and line drives. As you’ll see, Rizzo is going to the opposite field ~5% less on his ground balls, and non-oppo GBs turn into outs more frequently for Rizzo due to the shift.

Rizzo Batted Ball Distribution 2016 & 2017
PULL OPPO
2016 2017 2016 2017
GB 63.9% 60.8% 10.4% 4.8%
LD 39.2% 50.9% 25.8% 22.8%

Rizzo is hitting .140 this year on ground balls to the left or up the middle, against a .345 mark from a year ago. This accounts for eight of his 13 missing hits. Another three hits are accounted for from luck against the shift on the pull side. The remaining two missing hits are from a slight change in batted-ball distribution on line drives to the opposite field. At the end of the day, I don’t think anything has changed with Rizzo outside normal variance in various batted-ball outcomes.


A Surprisingly Close 18-4 Game

On July 19, 2017, the Colorado Rockies beat the San Diego Padres by a score of 18-4. Padres starter Clayton Richard left the game after 3 2/3 innings, having given up 14 hits and with his team down 11-0. After the game, Richard took responsibility for his rough outing, but also pointed out that the Rockies may have benefited from some luck. “It just seemed like mis-hit balls found the right spots,” said Richard. Let’s see if Richard is right; let’s try to eliminate the effects of luck and see how this game should have turned out.

Because the score of the game affects how teams play, I am only going to predict what the score should have been after four innings, at which point the Rockies had a 12-0 lead. In lopsided games, teams often rest their everyday players (as the Padres did with Wil Myers) and don’t bring in their top relievers (Kevin Quackenbush, who gave up six runs, relieved Richard with two outs in the 4th), so it would be unfair to use what happened after the 4th inning to estimate what the score of the game should have been.

I looked at Baseball Savant’s hit probability and expected wOBA (xwOBA) of every plate appearance in the first four innings of the game. These stats only consider a batted ball’s exit velocity and launch angle. Although I will generally refer to the difference between xwOBA and wOBA as luck, keep in mind that defensive positioning and defensive ability are also factors that can affect this difference (the Rockies are, in fact, an above-average defensive team, while the Padres are one of the worst in the National League). In the first four innings, the Padres had 16 hitters come up to the plate, and they averaged a .254 xwOBA, compared to an actual wOBA of .281, for a difference of .027 per hitter. I gave Manuel Margot’s first-inning plate appearance, in which he walked but was later picked off, an xwOBA and wOBA of 0. Meanwhile, the Rockies’ 29 hitters averaged an xwOBA of .420 and a wOBA of .664, for a difference of .244 per hitter. Two things are immediately clear. First, the Rockies certainly out-hit the Padres in the first four innings of the game. Second, as Richard noted, the Rockies’ hitters benefited from a lot of luck.

First, I will calculate the number of runs each team would have had through four innings if their wOBA was exactly their xwOBA (this estimate will be a little low for both teams, as xwOBA does not take into account that the game was played at Coors Field). To do this, I will find their weighted runs above average (wRAA), and then add that to four times the average number of runs per inning in the National League.


wRAA = ((wOBA – league wOBA) / wOBA scale) x PA

league wOBA = .320

wOBA scale = 1.25


When calculating wRAA, we run into a problem: we can’t use the actual number of PAs each team had because this number depends on the number of baserunners they had, which should change when we convert wOBA to xwOBA.  To come up with an expected number of baserunners, I added the hit probability of all balls put in play and added 1.000 for each walk and hit-by-pitch (with the exception of Margot’s 1st-inning walk). Strikeouts, as you might expect, were worth 0 points. The Padres had 3.24 expected baserunners (.203 xOBP) while the Rockies had 11.70 (.404 xOBP). With a .203 OBP, it would take roughly 15 hitters to get through four innings (15 x .203 = 3.045 baserunners; 15 hitters – 3 baserunners = 12 outs). With a .404 OBP, it would take roughly 20 hitters to get through four innings (20 x .404 = 8.08 baserunners, 20 hitters – 8 baserunners = 12 outs). Therefore, we use 15 PAs for the Padres and 20 PAs for the Rockies (notice that reducing the number of hitters doesn’t ignore what happened to the Padres’ last hitter or the Rockies’ last nine, as I use the average xwOBA of all the hitters that came up and simply apply that to a smaller sample).

The Padres’ expected wRAA through four innings is then -.79 while that of the Rockies is 1.60. The National League averages .5533 runs per inning, which comes out to 2.21 runs per four innings. Add each team’s wRAA to this number and a reasonable score of this game through four innings would be 1.42 to 3.81 in favor of the Rockies. It is still the Rockies’ lead, but nowhere near the 12-run difference that actually took place.

Of course, we know that luck and defense do exist. Let’s say that in one of the oddest trades in MLB history, the Padres and the Rockies decided to swap their luck and their defenses before the game. I will add to the Padres’ xwOBA the difference between the Rockies’ xwOBA and wOBA and vice versa (I will call this new number “swapped wOBA”). I will do the same with the teams’ xOBP and OBP to determine the number of hitters that would have come up through four innings in this scenario.  Here’s a chart summarizing all the numbers:


Padres Rockies
xwOBA 0.254 0.420
wOBA 0.281 0.664
wOBA – xwOBA 0.027 0.244
swapped wOBA 0.498 0.447
xOBP 0.203 0.404
OBP 0.250 0.586
OBP – xOBP 0.047 0.182
swapped OBP 0.385 0.451
PA 19 22


Using the same process as before, we use the teams’ swapped wOBA to calculate their wRAA through four innings and add 2.21 to each. With the Rockies’ luck, the Padres would have been expected to score 4.92 runs (2.71 wRAA + 2.21) through four innings. Meanwhile, with the Padres’ luck, the Rockies would have been expected to score 4.45 runs (2.24 wRAA + 2.21) through four innings. Not only was the game not as lopsided as it appeared, but with the teams’ luck and defense swapped, the Padres would have held the lead (if you round to the nearest whole number) through four innings. That is a 13-run difference solely due to luck and defense!

Now, there is a slight issue with the calculation I performed above. I took data from only 16 Padres hitters and then applied it to 19, assuming the extra three performed at the same level as the first 16. To fix this, we can look instead at the Padres’ expected run value for only the first 16 hitters. We end up with a wRAA of 2.28. Using their swapped OBP of .385, roughly six hitters would have reached base, meaning that these 16 hitters would have come up in 3 1/3 innings. So through only 3 1/3 innings, the Padres would have had basically the same wRAA as the Rockies would have had through four. This is amazing. If only the Padres were given the luck that the Rockies received on this day, they would have at least been tied through four innings, a far cry from the 12-run deficit they unfortunately had to face.


Jordan Montgomery’s Fastball Avoidance

Yankee southpaw Jordan Montgomery is having a a capable rookie season at age 24, with a 3.92 ERA and 4.07 FIP over 108 innings, both good for second among qualifying rookie starters (although to be fair, there are only four). Montgomery has solid strikeout and walk rates of 8.25/9 and 2.75/9, respectively, and if he’s given up a few too many homers (1.25/9), well, so has pretty much everyone else this year. So far, so encouraging, especially for a guy who eluded the top 100 prospects lists, but Montgomery is going about it in a highly unusual way. Just 42.4% of his pitches have been fastballs this year, the fifth-lowest rate in the majors among qualifying starters.

Throwing fastballs is a young man’s game. No other under-25 pitcher has used the fastball less than 50% of the time this season. The next such pitcher down the fastball rarity list from Montgomery is teammate Luis Severino, (25th on the list) who throws his heat just with just over a 51% frequency. In fact, none of the other bottom-10 fastball users are under 28.

While career development can take many different paths, pitchers tend to throw more fastballs early in their careers and fewer as they age. Kershaw’s career, for example, follows this pattern almost exactly, while Adam Wainwright’s is somewhat similar, though his (low) fastball usage this year is somewhat higher than last year’s. It’s unusual in the current era to see a young pitcher come up and have sustained success throwing fastballs so infrequently.

Over the last five years, just 20 pitchers have used the fastball less frequently than Montgomery has this year, 15 of whom are (or were, in the case of the retirees) starters. Only two of the active pitchers are under 30: Cleveland reliever Bryan Shaw (29) and yet another Yankee, Masahiro Tanaka (28). (The perceptive reader perhaps will have divined that the Yankees staff as a whole has the lowest fastball usage in the majors.)

On the surface, Montgomery’s reluctance to cook with gas is understandable: his gas is flammable. According to FanGraphs pitch values, Montgomery’s curve and changeup are among the ten best in all the land, while his fastball is down at 50th. So Montgomery might be excused for being gun shy (that actually is a pun — it’s okay to laugh!), but as noted above, very few young pitchers have survived to baseball middle age by so assiduously avoiding the fastball. If Montgomery is to have long-term success, he will either need to bushwhack a hitherto unblazed career trail, or figure out a way to keep hitters honest with a few more fastballs.

For an example of the latter course, consider Corey Kluber. When he arrived in The Show he had a somewhat similar pitching profile to Montgomery’s: a very hittable fastball that he was reluctant to throw, coupled with other, more promising pitches (in Kluber’s case, the the cutter was initially the best, followed by the curve and then the change). According to pitch values, Kluber’s heater was quite a bit worse than Montgomery’s is now, and Kluber accordingly suffered during his first two seasons in 2011 and 2012. FIP saw his potential, however: Kluber’s best ERA in those formative seasons was 5.19, but his worst FIP was 4.29.

In the next two seasons, Kluber would cut almost two full runs off that FIP, on his way to a Cy Young Award in 2014. Four significant changes helped postpone the start of Kluber’s broadcasting career. First, he added velo, which rose from 92.0 in 2011 to 93.2 in 2013. Second, perhaps because of the additional speed, he threw fastballs more often. Much more often, rising from around 43% in his first two years to 53% in 2013. Third, he correspondingly reduced changeup usage, from 16.5% in 2012 all the way down to 4.8% in 2014. Fourth, perhaps because of this simplified approach, his curve went from being spotty in 2012 to a wipeout pitch in 2014.

Kluber thus became the ace on a World Series pitching staff. He would go on to top 50% fastball usage every year until now, when it has once again slipped to 45%. His fastball has never been a dominant pitch, but it effectively sets up his curve and cutter, which are. As he’s aged, Kluber has given back his velocity gains, but so far that has not significantly eroded his overall effectiveness.

No player’s career is a perfect template for another, but Kluber’s rapid evolution at the major-league level suggests some steps Montgomery could take to remain in the Yankees’ rotation. Efforts to enhance velocity don’t always end well, but Montgomery’s velo (91.9) is just about where Kluber’s was before he began his ascent, and it doesn’t seem out of the realm of possibility that Montgomery could add 1 mph or so to his heater, thereby making him more willing to throw it. If he’s more afraid of his fastball than the hitters are, success will likely elude him. Of course, almost every pitcher would like to find an extra mile per hour in between the couch cushions, but in Montgomery’s case that may be closer to a need than a want.

If Montgomery throws more fastballs, he could also throw fewer sliders. Though not a bad pitch, it is the weakest of his other offerings and the one he already throws least frequently (12%). Largely scrapping it would enable to focus on developing and using his curve and change, which are the pitches that will essentially determine whether the Yankees ever have a Jordan Montgomery Bobblehead Night. Coupled with a more effective fastball, these pitches could become devastating.

To be sure, top prospects drive the bus — out of the 2016 Cleveland Spiders 27+ WAR, around 16 came from four former top-50 prospects (Francisco Lindor, Carlos Santana, Jason Kipnis, and Lonnie Baseball). Two former top-50 pitchers (Trevor Bauer and Carlos Carrasco) contributed just over 5 of the around 19 WAR that the staff produced. But teams need to get value from their unheralded players as well. In 2016, Kluber’s 5.1 WAR essentially equaled Bauer and Carrasco’s combined.

The Yankees are certainly far more important to Jordan Montgomery than vice-versa, but his performance thus far suggests that he is more than a fringe rotation member; he may be a fringe impact starter. The rotation is the weakest link in a Yankees team that otherwise looks poised to compete for the AL East crown for years to come. It’s easy to imagine that only Severino will have been in both the 2017 and 2018 opening-day rotations. Even if Chance Adams and Justus Sheffield can progress quickly enough to make an impact next year, the Yankees will need help that lies beyond the glow of the top-prospect campfire. Jordan Montgomery could be that help if he can learn to love the fastball.


Kyle Freeland: The New Rockies Prototype

The Colorado Rockies have been one of the biggest surprises this season with a 58-45 record, after going 75-87 last season. Currently, FanGraphs gives them a 64.8 % chance of making the playoffs as a wild-card team. Despite an offense that ranks 29th with a wRC+ of 83, their defense and baserunning have been strong suits, with the eighth-ranked defense and fifth-ranked baserunning. Their pitching staff has been around the middle of the pack (24th in ERA, 19th in FIP, 17th in xFIP) but this is a huge feat while pitching half of their games at the hitter’s heaven of Coors Field. This year, success has come in the form of a young starting rotation that ranks fourth in ground-ball percentage (48.6) and 11th in HR/9 (1.27) among all starting rotations. That’s right, while playing half of their games at Coors Field, the starting rotation has given up fewer HR/9 than 19 teams. Much of the credit for this success goes to rookie left-hander and ground-ball machine Kyle Freeland.

Taken eighth overall in the 2014 draft out of the University of Evansville, Freeland spent two and a half seasons in the minors that included him missing time in 2015 with a shoulder injury, before being called up to start the 2017 season in the Rockies’ rotation. To date, Freeland has thrown 116.1 innings with a 3.64 ERA and a 4.71 FIP while having the third-highest ground-ball rate (57.0 %) among qualified pitchers, to produce 1.4 WAR. What immediately sticks out about Freeland is the huge difference between his ERA and FIP. While FIP is typically higher than ERA for ground-ball pitchers, Freeland is still an extreme case, with his -1.07 ERA – FIP. Like most ground-ball pitchers, he doesn’t get many strikeouts or swings and misses; his 14.4 K% is the third-lowest among the 71 qualified starters, and his swinging-strike rate of 6.9 % is the lowest among qualified starters. However, unlike most ground-ball pitchers, Freeland walks a ton of guys; his 8.8 BB% is 15th-highest among qualified starters. And even more unlikely, while pitching at Coors, he’s allowed the 17th-fewest HR/9 (1.01) to go with a .281 BABIP.

Now it’s time to take a look at the stuff behind those results. Freeland features primarily a three-pitch mix of a four-seam fastball, sinker, and cutter, while also possessing a slider and changeup. His four-seam and sinker are his two best pitches (and only two pitches he has with a positive pitch value according to FanGraphs). As a left-handed pitcher, Freeland has above-average velocity on his fastball, averaging 92.8 MPH with his four-seam and 92.0 MPH with his sinker. Both of these pitches have above average arm-side run and sink, with his four-seam averaging 5.75 inches of horizontal movement with 6.34 inches of vertical movement (it really means that this pitch, on average, drops 6.34 inches less than a pitch thrown at the same velocity with no spin) and his sinker averaging 7.92 inches of horizontal movement and 3.51 inches of vertical movement (the lower the number, the more sink a pitch has).

His fastball and sinker both have above-average sink, but his sinker actually has less horizontal movement than an average sinker and is more of a two-seam/sinker hybrid (Statcast categorizes it as a two-seam while the folks over at Brooks Baseball classify it as a sinker). Yet both of these pitches generate a ton of ground balls and combined are used 65.8 % of the time by Freeland, which is the third-highest FB% among qualified starters. On the other hand, Freeland throws his cutter 20.5 % of the time at an average of 86.9 MPH with -0.46 inches of horizontal movement, to go with 3.18 inches of vertical movement. Due to this vertical movement, Statcast (differing from Brooks Baseball once again) classifies the cutter as a slider despite its low horizontal movement. Freeland’s cutter is truly a cutter/slider hybrid as it has a lot of tilt (like a slider) but doesn’t have much horizontal movement (like a cutter).

The way he uses this arsenal varies greatly when facing left-handed hitters and right-handed hitters. Against righties, Freeland throws his sinker 37.1 % of the time, his four-seam 30.7 % of the time, and his cutter 17.1 % of the time. The idea here is to mix in the sinker thrown down and away with a four-seam thrown in, and a cutter thrown either down and in or over the outer edge of the plate as a backdoor pitch. Against lefties, Freeland throws his four-seam 44.4 % of the time, his sinker 14.0 % of the time, and his cutter 33.0% of the time. Just like against righties, Freeland throws these pitches in the same areas of the zone, throwing his four-seam to his glove side, sinker to his arm side, and cutter to both sides. However, all that changes is how much he uses each pitch. Against both righties and lefties, Freeland pounds the lower outer half, but isn’t afraid to come back inside, usually up and in. This mix is tough for hitters on either side of the plate as these three different pitches all come from the same arm slot and start off heading in the same direction, but break off in different directions, allowing Freeland to miss the middle of bats and generate ground balls. This arsenal has also allowed Freeland to be almost equally effective against righties and lefties. Although it is a small sample, he has faced 102 lefties that have produced a slash of .271/.317/.409, good for a .310 wOBA, and 398 righties that have produced a slash of .253/.345/.398, good for a .324 wOBA.

Only 24, Freeland remains in the early stages of his career, and a sample of only 116.1 innings is nothing. Although he has gotten soft contact at a 25.0% rate, which is the best in the league, we can probably still expect some regression on balls in play. However, since Freeland is a pitcher that relies on the ground ball, his ERA will most likely not regress all the way up to his FIP, especially with strong infield defense behind him. The biggest issue for him to fix in order to sustain his success will be his walk rate. With his high fastball usage, Freeland has no excuse to continue to walk guys, and increased control should come as he ages. Most importantly, the Rockies will be leaning on him as they make a push for their first postseason appearance since 2009. Best-case scenario, Freeland becomes a fixture in the Rockies rotation as their new prototype for success at Coors Field, and leads them into the postseason for the first time since Ubaldo Jimenez was their ace. Worst-case scenario, Freeland experiences extreme regression as his high walk rate and lack of strikeouts come back to haunt him. Based on his stuff and pedigree, Freeland appears to have what it takes to stay in the rotation down the road, but if not, there will always be a role for him in the bullpen, where he can go and throw 75 % fastballs (or more) while generating a ton of ground balls (a la Scott Alexander). Either way, he looks like he can have big-league success while pitching in the big league’s toughest ballpark.


The Blurring of the Line Between Buyers and Sellers

Four trades of relative significance occurred last Friday. With all due respect to Howie Kendrick, the other three trades are my primary interest. The Mets and Orioles, each far separated from the top of their divisions, made deals to beef up their major-league teams, dealing young players in the process. On top of that, the Mariners and Rays, just 2.0 games from each other in the wild-card race, made a deal to address their respective weaknesses. These deals seem to re-affirm a belief that began to surface with the introduction of the second wild card, but has likely never been as pronounced as this year (in part due to the mediocrity of the American League, in all likelihood). The line between buyers and sellers has blurred, leaving many teams dabbling on both sides.

As of July 29th, FanGraphs lists the Mets’ playoff odds at a measly 8.1%, which makes sense given their 48-53 record and 13.5-game deficit in the NL East. In fact, that exact record is shared by the lowly Marlins, who felt the need to deal their closer, A.J. Ramos. The Mets acquired Ramos despite virtually no chance to compete for a title this year. Now, the validity of the trade is up for debate, as relievers are highly volatile and the Mets roster is flawed enough to argue they should fully rebuild. What really matters, though, is that the Mets opted to start their winter shopping early, as opposed to simply selling off short-term assets and waiting for the offseason. With Ramos under control for 2018, the team clearly felt that they have enough to simply retool their roster, giving them a shot in ’18.

The O’s made a similar but yet very different move, adding Jeremy Hellickson from Philadelphia. Hellickson is a pure rental, and the Orioles, to this point, have not been a good team. At 48-54, FanGraphs gives them a 2.6% chance of making the playoffs. The primary reason for that record in a starting rotation that has been an unmitigated disaster, with just one pitcher (Dylan Bundy) posting an ERA below 5.00 (4.53). Even amid rumors of Baltimore dealing away some primary pieces, Dan Duquette must have seen an opportunity to add some stable innings to a rotation that is anything but stable. Ken Rosenthal of Fox Sports reported after the deal that Baltimore could still deal off pieces. That seems to hint that Baltimore has interest remaining competitive as long as possible, but not at the cost of mortgaging the future in what’s been termed a “seller’s market.”

Finally, we have the very interesting trade between Seattle and Tampa. Neither player on their own is of huge interest, as Erasmo Ramirez boasts a 4.80 ERA, while FanGraphs pegs Steve Cishek at a -0.1 WAR. However, with limited control left, both are clearly win-now assets, moving between teams that are contending for the same playoff spot. Jerry Dipoto’s love of trades has been well documented, but this is possibly his most fascinating. The motivation is clear, as Seattle has a need in the back end of its rotation, and Tampa Bay has worked effortlessly to revamp its entire pen. But we rarely see teams move players off the big-league roster when contending in July, and it’s even more rare to see a deal between two teams competing against each other for a playoff opportunity.

Whether due to increased parity, opportunistic general managers, or simply an odd one-day coincidence, it appears as though teams are taking a less rigid stance on buying and selling. With just about everyone in the American League within shouting distance of contention, we may be in for one of the more interesting trade deadlines in recent memory (ed. note: now complete!). And if your favorite team is out of it, you may still have a reason to get excited these next few days, as teams like the Braves threaten to make moves toward contention regardless. With a unique trade market, many clubs may see fit to stick their toes on both sides of the line, re-assembling their roster without the limitations that a rigid approach brings.


What Went Wrong With Chihiro Kaneko

In the 2014 offseason, many free agents changed teams, some even changed leagues. Hiroki Kuroda went back to Japan to pitch for his hometown team, the Hiroshima Toyo Carp, while the Yankees got an upgrade (when healthy) in Masahiro Tanaka on a seven-year, $155-million deal (with a $20-million posting fee that they spent to talk to him), which he can opt out of after this season.

There was a second pitcher who was almost as good as Tanaka, who had worse stuff but excellent command. He also had some injury concerns after his 2011 injury where he missed a few starts, and in 2012 where only pitched nine starts, albeit with 63 1/3 IP in those starts though. Heading into the 2014 offseason, he had two excellent seasons, with ERAs of around 2 in 2013 and 2014, pitching 223 1/3 IP, with 200 strikeouts and 58 walks allowed, then 191 IP with 199 K and only 42 BB respectively in those seasons. He had a 1.98 ERA in those 191 innings in 2014, and a 2.01 ERA in 2013, generating interest from big-league teams and making an appearance in Bradley Woodrum’s article as a pitcher of note that might come over. He ultimately re-signed with the Orix Buffaloes on a four-year deal.

The injury bug bit him again in 2015 as he pitched in 16 starts, throwing 93 IP, and he had a lower strikeout rate than he had in 2013 and 2014 (7.6 K/9) with an ERA of 3.19. He pitched in 2016 and had a mostly healthy season, save for a declining strikeout rate (6.9 K/9) and an increased walk rate (3.3 BB/9), with an ERA of 3.83 in 162 IP. This year his strikeouts (5.7 K/9) and walks (3.0 BB/9) have stayed bad, with a slightly better 3.57 ERA in 116 IP.

What has caused this drastic downturn in performance? It seems that some of his downturn is because he’s getting older, but that doesn’t explain his increased walk rate or his severe decrease in strikeouts. Most of this is likely due to injuries he sustained in the 2015 season. And given that he hasn’t gotten better, it seems as if he’s been pitching despite an injury which has been sapping his effectiveness. He went from being as good as Alex Cobb was in 2014 (considering the thought of the average active hitter in Japan being slightly better than AAA quality) to performing like Ervin Santana this year.

He was a great pitcher with some downside, like Jered Weaver was, but Kaneko hasn’t declined that far yet. Weaver is too bad to even be on an MLB team until he gets medical help to fix his hip and/or shoulder. Weaver is one of the other pitchers who had declined that quickly. So far, he hasn’t rebounded and has continued to get worse, worse than he was last year when he was the second-worst pitcher qualified for the ERA title. It appears that Weaver is virtually unfixable. I think that Kaneko’s issues can be fixed, though, and if they are fixed, he could be an interesting buy-low opportunity.

After the 2014 season, if I were Dayton Moore (armchair GM ideas away), I would’ve signed him to a three-year, $30-million deal with lots of incentives, which could’ve raised the value to $51 million if all were reached. And I think he would’ve done quite well; we might not have this article at all. I must digress, as what-ifs are all around us. (Look at Yordano Ventura, who died far too young with so much untapped potential left.)

He looks like a potential project for the Pirates if he can show signs of improvement in his performance and peripheral stats. The Pirates and Ray Searage could definitely turn Kaneko into something of value, like they did with A.J. Burnett, Edinson Volquez, JA Happ, Ivan Nova, Juan Nicasio, Joel Hanrahan, Mark Melancon, Tony Watson and more. There’s a good amount of upside in trying for this — some prospects that can help the team in the future.

Here is a link to his player page so you can see it for yourself and make your own conclusions about him, and what he can do to remedy himself.

I don’t own any stats used; all stats are from either FanGraphs or the NPB website linked above.