Is ‘Tanking’ in Baseball Worth It?

With all the blabbing about the fire sale of the Miami Marlins, and less so with the Pittsburgh Pirates, does the philosophy of ‘tanking‘ in Major League Baseball work? Can it come to fruition the same way it does in the National Football League or the National Basketball Association?

The biggest and most obvious difference in those sports is the vast majority of players you’ll draft in the NFL or NBA are ready to play (even start) the following season. Not only that, players are more of a ‘sure thing’ in those leagues; you’re more likely to hit on a player since the pool is much more shallow than it is in baseball.

While in MLB, there are several levels to break through before you’re actually ready to play in the top-level.

Now, I understand the angle of ‘tanking’ to accumulate funds and eventually splurge on some free agents or wanting to make your team younger. I can follow that train of thought (sort of) but we are going to go on the premise that teams are doing it to grab top-level draft picks through each round.

Yes, the Houston Astros and Chicago Cubs, after many seasons of horrid baseball, are now World Champions thanks to patience and a great analytics department. Let’s just break even and apply this to your average front office.

According to research done by Cork Gains of Business Insider back in 2013:

“After three years, we will probably only see about 15% of this year’s draftees in the big leagues. And for most players, it will take 4-6 years to make it to the highest level”.

Let’s take a more recent peek at draft success within the first five rounds of the MLB draft. We only go that deep because, honestly, after that point (and even five rounds is a reach) it’s mostly a crap shoot and I’d venture to guess no team has any sort of advantage over the other.

I’m using five years as its reasonable to expect, even with a high schooler, to reach the big leagues within that amount of time.  Of players drafted in 2017, none have reached the majors; no surprise there. In 2016 just one player drafted, third-round pick Austin Hays of the Baltimore Orioles, has made it to the majors. We ought not to reference that year, either.

The 2015 draft is when we start seeing results.

2015Draft

Of first rounders in the 2015 draft, first overall pick Dansby Swanson debuted in 2017. Alex BregmanAndrew Benintendi, and Carson Fulmer all came up in 2016.

In the 2015 draft, out of 165 players picked in the first five rounds, 7% have made it to the big leagues.

It goes without saying the list grew considerably in 2014 and it follows that it would in subsequent drafts. Out of rounds one through five in 2014, we have 19% currently in the majors.

2104Draft

Let’s investigate the success rate by round, referencing research done by Mike Rosenbaumof Bleacher Report.

draftSuccess


So the first round, you’re likely to get two out of every three players in the majors, then 50/50 in the second round. However, this chart is no reference for success or failure for the player once they do reach MLB.

The standard deviation of success rate drop-off is 4.96%, with a variance of 24.6%

Here, we’ll observe the first overall picks since 2006 and their yearly average WAR from all MLB seasons.

no1WAR

The first-overall pick in this era yielded about 50% averaging WAR over 3.2 (we’ll get to the context in a bit).

Lastly, let’s look at the cumulative WAR of rounds one through five, starting at 2011 to 2015. As mentioned before, there was just one player who reached MLB that was selected in the first five rounds during the last two years.

avgWARDraftRd

*Mookie Betts 24.1 WAR

So the chart lends itself to logic; the older the year, the higher the cumulative WAR. But, there is still a lot we don’t know yet as there are still players in the 2011 draft toiling in the minors, yet could break into the big leagues in the next year or so.

Yet, something funny happens. There is a spike in WAR once we get to round 5. As noted, the majority of WAR from that round in 2011 comes from Mookie Betts. Could we infer that later rounds will increase as well? Probably not, as the random variation would likely be all over the place player to player. But it’s not a stretch to assume that you can find just as much value in later rounds as you can in the first couple.

Obviously, the bigger success stories come from the first round. But, keep in mind that’s just one player. On a team of 25 guys, it’s less likely that this player can turn an entire franchise around by themselves. In the NBA its possible, or the NFL where a quarterback can pull a team out of mediocrity within a year or so.

I’ll average the first round pick WAR to get an idea of what a team who continually ‘tanks’, could expect to get out of first rounders for the next several years.

2011- 2.8
2012- 1.7
2013- 1.2

Again, this isn’t concrete information but it’s enough data to get a rough inference. If you ‘tank’ for several years, and get a high first round pick, you can expect to get a players who will average a WAR of about 3 (after about five years); the average WAR of a number one pick (using the data in the ’06-’16 chart) is a little better than 2.

So you’ve got a good shot to get a player considered decent or, at best, above average.

The following chart give some context on WAR for those unfamiliar.

WARvalues

Is it really worth ‘tanking’ in baseball? In, say, five years of mediocrity, how often can you expect to hit on a player in the early rounds (average 2.5+ WAR)? Again, in the first round (’06-’16) chart above, you’ve got a 50/50 shot. Is it worth driving your franchise into the ground with those kinds of odds?

Like I’ve said before, we are using a small amount of data that is on a sliding scale (the older the draft, the higher the WAR). Since it would take roughly 3-5 years for an organization to acquire draft picks that could break into the league and help push the team into championship contention, it’s not too far of a reach. Meaning you can expect your first couple of picks per year to start normalizing WAR after a couple of seasons…if they reach the majors at all at all.

So is ‘tanking’ worth it? Allegedly to the Marlins and Pirates, it seems to be. They have highly paid analysts and I’m a lowly blogger, so they know better than I do. But, with the information I’ve been able to acquire, it doesn’t seem as though stockpiling high picks will benefit an organization enough to risk losing fans, revenue, and respect in MLB in the short term.


Lorenzo Cain Follow-Up: Market Value and 2018 Projections

As one of the remaining top free agents, Cain agreed to a 5yr/$80M deal with the Milwaukee Brewers. Reports indicate that Cain will earn $75M from 2018 to 2022 ($13M/$14M/$15M/16M/$17M) plus incentives, in addition to a deferred yearly payment of $1M for years 2023-2027 ($5M total). Based on Cain’s projected Market Value, he should be worth close to 9.6 sWAR for the next 3 years ($84M approx. Assuming 5% inflation per year). Understandably, Cain’s history regarding injuries and durability is a considerable factor moving forward.

A new home should benefit Cain’s offensive output. For the past 3 years, Miller Park has averaged a 106 HR Factor for RHB; which is significantly (P = 0.03) higher than Kauffman Stadium’s 88 (RHB) in the same period. Moreover, Cain has not “slowed” down, his sprint speed for last year (29.1 ft./sec) ranked him in the top 20 overall, in addition to being ranked in the top 10 among Center-Fielders as well.

Based on the aforementioned factors, Cain’s 2018 updated projections represent an increase in both OPS and ISO from last season. He should be able to get on-base at an above-average rate (0.358 OBP) in addition to an increase in SLG from last year. Although his wOBA is projected to regress marginally, Cain’s updated projections still aim toward a 3.7 sWAR (as a CF) for this upcoming season. Please find Cain’s updated 2018 projections in the chart below.

2018 Projections: Lorenzo Cain

YEAR AGE sWAR wOBA OBP SLG OPS ISO AVG K% BB%
2015 29 5.5 0.360 0.361 0.477 0.838 0.170 0.307 16.2% 6.1%
2016 30 2.7 0.322 0.339 0.408 0.747 0.121 0.287 19.4% 7.1%
2017 31 4.1 0.347 0.363 0.440 0.803 0.140 0.300 15.5% 8.4%
2018 32 3.7 0.336 0.358 0.457 0.815 0.157 0.300 16.9%

7.4%

———————————————————————————————————————————————————Disclaimer: SEG projections are computer-based projections of performance based on the “SEG Projections System” framework. Regarding Wins Above Replacement (WAR), sWAR is the “SEG Projection System” calculation of WAR. sWAR will always stand for WINS ABOVE REPLACEMENT (“WAR”), unless noted otherwise.


Michael Conforto Had a Unique 2017

A few days ago, I decided to start my 2018 Fantasy Baseball List. My process this year is about categorizing all players into groups that defines each player’s positive and negative traits, all based on league average stats. In this process, while linking players with similar traits, I found something interesting about Michael Conforto’s 2017 season.

So, without further ado, here is the process and the math disclaimer:

First, I took all the players who had at least 900 PA between 2015-2017 (Averaging 300 PA per season), and while I evaluated a lot of the stats, the one who I’m talking about right now is Hard Contact %. Then, I found out the league average Hard Contact % of those three seasons altogether. After that, I took all the players who were league average and ran another average to know who were the ones on top. (I wanted to make this benchmarking process as easy as possible). I used the trait ”Ball Murderer” on those players.

After that, I evaluated a lot of other stats, but the focus right now is on FB%, LD%, GB% and wOBA. I took all players with at least 200 PA on both 2016 and 2017, and found out the players who made the biggest changes in each batted ball-type, using a similar process of average as before. For those players, I decided to use the trait ”Substantial Line Drive Increase”, ”Substantial Fly Ball Increase”, ”Substantial Ground Ball Increase” and ”Substantial wOBA Increase”. The same is true for decreasing values.

Then, I decided to see which players had a sustainable ”Substantial wOBA Increase”. What I wanted was to link every positive baseball process that I know that could derive into an increase of wOBA.

So, between all those links, it came the moment to answer a pretty easy question, which was: ‘‘Which players who hit the ball relatively hard on the last three seasons have made a batted ball type adjustment in order to increase their wOBA production”?

With this question, I thought I would get a narrow list of 5 – 10 players whose wOBA Increase would be backed up by this adjustment. To my surprise, I only found one name on it: Michael Conforto.

Conforto had a great season last year. He upgraded his BB%, upgraded his batting line to .279/.384/.555 and had a great .392 wOBA. Also, he became less pull happy and slightly upgraded his Hard Contact %. What most people could point out as a step back was that he lifted the ball less than last year.

While this might be true, Conforto showed an impressive upgrade on his LD%, which is a major factor behind his production upgrade. Going back to the name of this post, he was the only player who has hit the ball hard for the last three seasons (which I call ”Proven Hard Contact%), to upgrade substantially his LD% and wOBA. Another interesting aspect of this analysis is that no player who was tagged with the ”Ball Murderer” trait showed a substantial increase on his FB% and wOBA.

Conforto had a breakout season last year. He was characterized for lifting the ball in his career, and he lifted it less last year. But his great increase on LD% indicates that his results of 2017 were valid, and that he is a great and unique choice for your 2018 fantasy baseball team.


Looking Ahead to More Batted-Ball Data

Over the past two to there months, I have noticed a continuing trend in the baseball community of asking questions about batted baseball information. Coaches are seeking answers, community members are interested in finding potential diamonds in the rough for their fantasy teams, and real teams. I think with the baseball data which is currently public on the web it seems that we have now plateaued in terms of the information many smart people have gone through. Meaning that the most obvious, and illuminating answers have come from the data. Now the public is picking through the scraps.

I want to preface what I am saying by pointing out that the amount of data that we currently have is amazing and that shouldn’t be overlooked. People (myself included) are now thirsty for more information. More pieces to the puzzle. More answers to the game. More data to try to help players. As players and coaches continue to use devices like HitTrax, Rapsodo, and TrackMan to collect, organize, and judge players it is important to continue to not only educate the public but to also continue to push the envelope of information. These devices collect data and present it in a visual form to help players improve. Some of the metrics include Launch Angle, Exit Velocity, Distance. Which all are pretty common knowledge, and a general understanding among the community. One piece of information that is presented that I feel needs further research is spin rate, and spin axis of batted baseballs.

I suspect that the next big data for information that is released from MLBAM is going to be something on batted ball spin. Ideally, we could look into players data on both spin rate of batted baseballs and spin axis of those baseballs. There are pockets of the internet which now have access to a limited amount of data on this topic, and often times these people are putting out amazing work. Alan Nathan has published several studies on this topic, and a couple of articles looking at batted ball spin. As great as this data is you can get a general sense of the important from reading over the information which is now public. To GENERALLY SUMMARIZE lower Launch Angle Balls need more spin to gain distance, Higher Launch Angle balls would need an average amount of spin to go further. Baseballs that are over-spun or under-spun can lead to reduced distances in both cases.

Coaches have talked in the past about how true backspin on a batted baseball is one of the most important factors to hitting, but we don’t’ have an accurate depiction of this. How important is true backspin? Teams if they had access to Spin Axis of batted baseballs. This information can lead to a whole different conversation. One in which we can look into players who are slicing a ball or fading a ball. Think about it like a golf swing per say. We could have a more accurate look at not only which players are best at creating this backspin, but how much of an effect does this backspin have on batted balls Vs. side spin on batted baseballs?

Which devices like the ones mentioned above becoming more common among coaches and players I feel that these coaches, and players have no context for what they should be looking for. Great you created 4000 rmps of backspin on the ball? What does that mean for you? Oh you side spun it at 3500 rmps, what does that look like if you had more backspin on it? These coaches and players are thirsty for the knowledge, and they are left to make up their our thoughts on what these things mean for players. It isn’t fair to players, and even worse for coaches who are actively looking for the information to help these players. My last thought on this topic is that making the information public makes sense as more coaches are becoming familiar with this.

What happens after the batted ball data is public? (If that were to happen) It brings up an even more interesting topic in my mind. Once we have another piece to the batted ball puzzle we can now start to create mathematical formulas that look into how player are striking the baseball. People have already figured out how to get the attack angles (estimated) on batted baseballs, the spin rate would help to finalize these types of formulas.

Lastly, we would be able to hopefully calculate the Offset of the bat-ball collision. Simply put this “offset” is point that the baseball makes contact with the baseball. Hitting the baseball square, vs. miss hitting it above or below the center of the barrel. This would bring up a bunch of other questions like which player are best at successfully missing the barrel effectively enough to create the best attack angle, back spin, and offset.

More information will continue to be produced, and this data will help baseball move forward. People are asking the questions. Coaches, and Players are seeking the answers. Data holds the answers.


What’s Next for the Pirates?

It’s been about several weeks since the Pirates parted ways with both Gerrit Cole and Andrew McCutchen, the former to Houston, and the latter to San Francisco. Most fans and analysts expect Josh Harrison to be next, and by the looks of it, that’s what he’d prefer.

Some would consider the Pirates to be rebuilding, while others suggest it may be somewhat of a retooling, hoping that some names that were expected to work out, but suffered setbacks either last year or culminating throughout the last several years (like Marte and Polanco) will bounce back or reach expectations.

That, coupled with players breaking through and reaching their potential (like Bell and Taillon), along with other young players (as though the Pirates have any other type of player now) like Trevor Williams, who showed a lot of promise last year, or Steven Brault, who pitched very well at AAA Indianapolis, perhaps the Pirates can field a winning team. It doesn’t hurt that they inked one of the top relievers in the game, Felipe Rivero, who emerged with a breakout season last year, to a four-year deal.

But most Pirates fans aren’t buying it. There was even a petition started on Change.org for “MLB to force Bob Nutting to sell the Pirates”, and to this date it has reached 59,456 signatures. Of course, there is basically no chance that this petition will actually result in anything.

Before both trades, the Pirates projected win total by FanGraphs was a whopping 81. After the Cole trade, it went to- er- stayed at, 81. It did move, though, once McCutchen was dealt, dropping from 81 to 78, which would still be three wins better than last year’s club, which might cause some to say that technically the team is improving, even if it’s by the most basic metric; of course, most would say that’s nonsense.

Last year, the Pirates were plagued by a multitude of problems, from Marte’s PED suspension, a plethora of injuries to, well, everyone, and even to Taillon missing time due to testicular cancer (which he brilliantly rebounded from, appearing as a starting pitcher just five weeks after surgery). Not to mention Jung-ho Kang’s off-field issues and inability to return to the team. The Bucs suffered a six-game setback from last year’s projections where they were expected to go 81-81. They finished six games below that total, winning 75 contests.

The Pirates were basically destined to fail last year. Now many believe that the Pirates are in store for the same fate this year after departing with two of the franchise’s marquee players.

A lot of the Pirates roster will look strikingly similar to last season, except for those received in the trades, which includes: 3B Colin Moran, P Joe Musgrove, P Kyle Crick, P Michael Feliz, among several other pitchers not involved in either of those trades, Nik Turley, Jack Leathersich, and Jordan Milbrath. It is unlikely that those players will make that big of an impact.

It’s possible, without any major injuries, the contributions the Pirates expected to receive last year will be more likely to reach fruition this year. If Gregory Polanco has the kind of breakout season people felt like he might have when the Pirates first acquired him, it’s possible for him to be a 5.0 WAR player. A litany of injuries prevented him from coming anything close to that last year, registering a 0.5 WAR, but with glimpses of power in his minimal contributions.

The same is true for Starling Marte. In 135 games for the Pirates in 2013, Marte posted a 4.8 WAR and 122 wRC+. We are all aware of Marte’s 80 game suspension following him testing positive for performance-enhancing drugs prior to the 2017 season. When he returned, he failed to be the player the Pirates hoped he’d be, and of course, he’ll have a lot to prove after his suspension in his first full season, but it isn’t completely insane to think he might experience a resurgence.

Josh Bell had a breakout season for the Bucs in his rookie campaign, perhaps positioning himself to be the next face of the franchise. Bell registered a 1.4 WAR last year and 113 wRC+, a .338 wOBA, and an OPS of .800. He hit for significantly more power than was expected of him, blasting 26 cannonballs, which was 12 higher than his 2016 total in AAA Indianapolis, playing nearly every game (159) in 2017. If Bell continued to grow this offseason, it’s entirely possible he’ll repeat in some statistical categories, like home runs wOBA, and OPS, and improve in others, like BABIP (.278), making him a very legitimate threat in the middle of the order.

Joe Musgrove, whom the Pirates acquired from Houston, showed that he may have the stuff for a solid third in the rotation type pitcher. Musgrove appeared in 38 games for Houston last year, starting 10 of them, posting a FIP of 4.38, an ERA- of 113, and an xFIP of 4.03. Those numbers are about in-line for a 5 starter, most likely, but PNC is one of the most “pitcher friendly” parks in baseball. Also, I’m not one to chalk up occurrences to magic, but Ray Searage has worked some serious voodoo in the past, and that could likely be the case here, especially with Musgrove who is by no means a lost cause pitcher to begin with. Additionally, Musgrove throws pretty hard, last year registering his fastball around 93.5 mph, his cutter a tick over 90, and a slider around 92.

Colin Moran will likely see the most time at 3B this season, as David Freese’s production levels just don’t quite reach what they should to warrant starting everyday, especially with a young player like Moran waiting in the wings. Jeff Sullivan wrote an article highlighting Colin Moran’s swing change, and some of the numbers were glaring. During seasons 2013-2016, Moran sat around 50% ground balls, and with the way baseball’s evolved, that’s not really a good thing. But in 2017, that number was strikingly different. Moran hit a ground ball only 34% of the time. With his decrease in ground balls came an increase in home runs. He had a previous high of 10 in AAA with far more at bats than his 18 in 2017 during his AAA campaign.

Lastly, Michael Feliz, another piece from the Astros, comes to Pittsburgh after having posted interesting numbers in 2017. Firstly, Feliz throws hard, reaching the high 90s with his fastball, averaging nearly 97 mph in 2017. He posted a FIP of 3.78, an xFIP of 3.58, and an xFIP- of 81. Feliz will likely be a strong complement to Felipe Rivero out of the pen.

Help will have to also come from players being called up from AAA for the first time (Meadows, who suffered setbacks last year on the DL, Keller, perhaps Bryan Reynolds, among others), but if some things break the right way, the Pirates may experience more success than originally anticipated. Don’t misunderstand me, I’m not saying the Pirates will be in contention for the NL Central this year, or even a Wild Card spot. I’m saying the potential is there for them to rebound from last year and finish the season above .500 at 82-80, especially if they can capitalize on a flailing Reds team, as well as in games against the largely inept NL East.

But barring a major outbreak by a lot of guys, the Pirates will likely be an average to below average team (somewhere along the lines of 75-87 to 79-83). It wouldn’t surprise me for them to finish better than last year, if not just for the sheer manpower versus last year, and hopefully not having to deal with such setbacks.

But when is it most likely the Pirates will be able to actually contend? The front office will say 2019 at the earliest, and there’s some credence to that.

Mitch Keller is projected to make his debut sometime this season, ranked 16th overall, and is the Pirates best prospect. Austin Meadows, ranked 45th, is expected to make his debut this season, as well. The last of the Pirates top 100 prospects, Shane Baz (67th) isn’t expected to make his debut until 2021, and hopefully, the Pirates are competing before then.

From the Pirates own top 30 list, several potentially important players are expected to debut in 2018, including Nick Kingham and Bryan Reynolds (the latter of whom came over in the McCutchen trade). 2019 will see a string of more players, and if they make an impact right away could yield a winning ball club, like Ke’Bryan Hayes and Cole Tucker. If you combine their potential productivity with the progression of guys that are already there and guys that are debuting this season, the Pirates could be returning to a similar place as their winning years, 2013-2015, in as little as two seasons.

Although it should be noted, the Pirates most successful years weren’t necessarily fueled by prospects. When Gerrit Cole debuted in 2013, one of the Pirates most successful seasons, he was really the only major prospect getting to play at that time, while the majority of the roster was comprised of veteran holdovers from the season before.

What that could potentially mean is that perhaps 2019 isn’t necessarily a possibility in terms of being competitive. Perhaps a more realistic timetable is 2021. By that time, Starling Marte will be in the final year of his contract at age 32, and likely his last year as a Pirate, and assuming he’s able to rebound, will be in the latter part of his most productive years. Gregory Polanco, if he’s able to reach his potential, will be in his Age 29 season and possibly at the peak of his ability. Moreover, by 2021, most of the players we’ve discussed will have had time to fully develop, like Josh Bell and Jameson Taillon, plus any guys coming up over the next two seasons.

All of these guys won’t pan out, but there’s a pretty good chance some of them will, and that’s the best an organization and fan base can hope for (except for the Astros who have seemed to hit the jackpot in every regard). The team will also need to be supplemented by veterans, and not just the cheap ones. For the Pirates to make a run and win between 2019-2023, the front office is going to need to spend more money than they were willing with Gerrit Cole and Andrew McCutchen.

There are a lot of hypotheticals in the Pirates future, but there truly is a lot to be excited about. I know it’s a difficult thing to request of Pirates fans, but this transition will require patience. That, and the front office attempting to provide more from the outside in free agency or big trades, and probably both. There is a lot the front office has done right in the past; unfortunately, though, there is also a lot its done wrong. We’ve seen the front office make some truly good trades, having the insight to know when guys have passed their peak and flipped them at the right time (like the acquisition of Rivero). But there will have to come a time where they send prospect packages for big-time players; if not, the Pirates may not see a real contender until ownership changes.


Joe Biagini’s xwOBA and RISP Spread

Would you believe me if I told you that Joe Biagini did a better job minimizing contact quality last year than Marcus Stroman?  I didn’t believe it at first, but it turns out he had slightly better contact quality control on the whole. See the arranged summary table below: (min 500 pitches, showing data for batted balls)

player_name xwOBA
1 Danny Barnes 0.306589888
2 Aaron Loup 0.307355422
3 Roberto Osuna 0.326513158
4 Joe Biagini 0.334128342
5 Ryan Tepera 0.33518593
6 J.A. Happ 0.339169336
7 Dominic Leone 0.340634286
8 Marco Estrada 0.341392086
9 Marcus Stroman 0.355793677
10 Joe Smith 0.368621951
11 Francisco Liriano 0.371231373
12 Aaron Sanchez 0.37646281
13 Mike Bolsinger 0.378370079

xwOBA in this case is a statcast proxy for contact quality, based on launch speed and angle. I’d go on a limb to say it essentially imputes an expected number of wOBA based on the quality of how the hitter squared up the ball, irrespective of what happens after that. Last year, the average xwOBA for a Blue Jays pitcher included in this sample above was 0.344.

Interesting. Biagini’s contact quality was fourth best on the team, but his ERA was third highest among the group. The two higher ERAs were Liariano and Bolsinger (also 11th and 13th highest expected wOBA). This is an example of how situational pitching can ruin you if you let it. Let’s factor in runners in scoring position and compare the same analysis. Below is the same table, except now showing one for runner in scoring position (RISP), 0 for not:

player_name RISP xwOBA
1 Joe Biagini 0 0.299694737
2 Aaron Loup 0 0.302101695
3 Roberto Osuna 0 0.309736842
4 Ryan Tepera 0 0.325156463
5 Danny Barnes 0 0.339150794
6 J.A. Happ 0 0.350223214
7 Marco Estrada 0 0.350911628
8 Marcus Stroman 0 0.352419087
9 Francisco Liriano 0 0.363611702
10 Dominic Leone 0 0.364512605
11 Aaron Sanchez 0 0.369082353
12 Mike Bolsinger 0 0.372388235
13 Joe Smith 0 0.395754386
14 Danny Barnes 1 0.227692308
15 Dominic Leone 1 0.289892857
16 J.A. Happ 1 0.30239604
17 Joe Smith 1 0.30676
18 Marco Estrada 1 0.308904762
19 Aaron Loup 1 0.320270833
20 Ryan Tepera 1 0.363538462
21 Marcus Stroman 1 0.369462185
22 Roberto Osuna 1 0.376842105
23 Mike Bolsinger 1 0.39047619
24 Francisco Liriano 1 0.39261194
25 Aaron Sanchez 1 0.393888889
26 Joe Biagini 1 0.444393258

Look at the two Biaginis! At the very top and very bottom. Without runners in scoring position, Biagini was the best pitcher on the roster in terms of limiting contact quality. Put a guy in scoring position, and he starts getting lit up. Here’s that same table, but sorted by the differences.

player_name RISP.x xwOBA.x RISP.y xwOBA.y diff
1 Danny Barnes 0 0.339150794 1 0.227692308 -0.111458486
2 Joe Smith 0 0.395754386 1 0.30676 -0.088994386
3 Dominic Leone 0 0.364512605 1 0.289892857 -0.074619748
4 J.A. Happ 0 0.350223214 1 0.30239604 -0.047827175
5 Marco Estrada 0 0.350911628 1 0.308904762 -0.042006866
6 Marcus Stroman 0 0.352419087 1 0.369462185 0.017043098
7 Mike Bolsinger 0 0.372388235 1 0.39047619 0.018087955
8 Aaron Loup 0 0.302101695 1 0.320270833 0.018169138
9 Aaron Sanchez 0 0.369082353 1 0.393888889 0.024806536
10 Francisco Liriano 0 0.363611702 1 0.39261194 0.029000238
11 Ryan Tepera 0 0.325156463 1 0.363538462 0.038381999
12 Roberto Osuna 0 0.309736842 1 0.376842105 0.067105263
13 Joe Biagini 0 0.299694737 1 0.444393258 0.144698522

Biagini was not the same person on the mound when threatened with a runner past first. To offer some perspective, that very difference is larger than that between Mike Trout (1st @ 0.437) and Kevin Pillar (130th @ 0.302). You must wonder what some possible explanations of this could be .Sign stealing? The yips? Pitch selection? Let’s look at the 2016 differences table and see if this affected him at all. (min 500 pitches)

player_name RISP.x xwOBA.x RISP.y xwOBA.y diff
1 Jason Grilli 0 0.429316 1 0.229538 -0.19978
2 Drew Storen 0 0.475368 1 0.320645 -0.15472
3 Joe Biagini 0 0.345207 1 0.270319 -0.07489
4 R.A. Dickey 0 0.39697 1 0.337583 -0.05939
5 Aaron Sanchez 0 0.366077 1 0.328248 -0.03783
6 Roberto Osuna 0 0.386113 1 0.350638 -0.03547
7 Brett Cecil 0 0.411931 1 0.379067 -0.03286
8 Marcus Stroman 0 0.362472 1 0.334 -0.02847
9 Francisco Liriano 0 0.351901 1 0.369333 0.017432
10 J.A. Happ 0 0.363058 1 0.386705 0.023646
11 Marco Estrada 0 0.335267 1 0.359102 0.023835
12 Jesse Chavez 0 0.340885 1 0.48161 0.140725

Runners on second and or third in 2016, Biagini pitched to better contact quality.  He was coming out of the bullpen, but it still leaves our question of consistency from last year unresolved. It wasn’t Biagini’s pitch selection either. Based on the table below, his distribution of pitches with and without RISP last year was more or less the same. It’s not as though he wasn’t throwing the breaking ball with RISP.

pitch_type RISP n Frequency
1 CH 0 207 0.146393
2 CU 0 278 0.196605
3 FC 0 145 0.102546
4 FF 0 784 0.554455
5 CH 1 80 0.154739
6 CU 1 138 0.266925
7 FC 1 39 0.075435
8 FF 1 260 0.502901

I don’t know what the real explanation for this is. It likely could just be chance, but I’d like to think there’s a more probable explanation for it. I say the yips! Pitchers aren’t robots, some pitchers must get phased more than others by the pressure of potential runs scoring. But last year on the whole Toronto pitching allowed very similar contact quality regardless of having runners in scoring position.

RISP xwOBA
1 0 0.343178
2 1 0.345718

P.S. first time posting! let me know what you think. had a lot of fun doing this.


A Steady Slog Toward Three Outcomes Baseball

During this quiet winter of baseball, I’ve entertained myself with a mild obsession with the three true outcomes (not outfits).  Dave Cameron took note of the three outcomes trend in early April 2017, only one week into the new season.

 “…while samples are still tiny for players and teams, things tend to stabilize pretty quickly at the league level. And, not surprisingly, the first week of the season was filled with the two things MLB games are becoming known for; strikeouts and home runs.”

Cameron goes on to predict a record year for the three true outcomes in 2017.  He was right.

A steady slog towards three outcomes baseball

Figure 1 is an update of Bill Petti’s analysis back in 2012.  It looks at the average rate of the three outcomes by player for each season since 1913.  The top blue line shows the proportion of plate appearances that have resulted in either a home run, strikeout or walk across seasons.  I got here pretty easily: Like Bill, for each player, I added their home runs, strikeouts and walks in a season and divided that by the number of plate appearances.  That provides the proportion of three outcomes plate appearances for each player.  Unlike Bill, I used at least 170 plate appearances in a season as my cut off (rather than 500).  Then, for each season, I found the average proportion of three outcomes plate appearances for eligible players.  I followed this procedure for home runs, strikeouts and walks separately.

The trend of the blue line is clear: players’ average rates of three outcomes have increased starting around 1920, dropping off a bit in the 70s, and continuing on through 2017.  There has been a spike in recent years, and the 2017 average rate of 33% three outcomes is clearly the highest since 1913.

It is interesting to look at each outcome separately as well.  The tremendous growth in strikeout rates is clearly a big part of this story.  Average walk rates have consistently hovered around 8 or 9 % of plate appearances after peaking just over 10% in 1948.  Home run rates are increasing, but home runs are still rare compared to the other outcomes.  Through the 1940s average home run rates per player averaged around 1% of plate appearances.  They jumped to around 2% in the 1950s, and stayed pretty consistent until the mid-1990s.  Since then they have been increasing and peaked in 2017 with an average of 3% of plate appearances.

What does this trend towards three outcomes mean for the game?  Perhaps Cameron subtly showed his feelings about it when he titled his essay, “The League’s Continuing March Towards Three Outcomes Baseball.”  A march; a steady march.  Figure 1 suggests an uphill march.  Cameron could have called it the race towards three outcomes.  Or the growing excitement of three outcomes baseball.  Even the uphill battle of three outcomes baseball sounds more engaging than a march.  Is three outcomes baseball more of a slog than it is an exciting new dynamic in the game?


The Politics of Being a Baseball Fan

Sound the alarms folks, here comes yet another take by another internet oaf centereded around the “Worst Offseason of All Time”, the 2017-2018 offseason.  Please don’t run away just yet though! This isn’t going to be an article about how front offices are colluding, or how teams are getting smarter, or how players are greedy and want too much money. What I want to try to do here is attempt to show how an individual’s politics help shape the way they perceive the game of baseball and how it affects the way they root for the team or players they love. With this in mind, I want to stress this: I am not attempting to project my personal politics on any of you, the readers. I am simply going to use my political ideology as an explanation as to why I feel the way I do about this wonderful sport, and why I think my personal views have a bit of conflict of interest in the way the game is played today.

A few weeks ago, my favorite hometown team, the Minnesota Twins, signed reliever Addison Reed to a two year, 17 million dollar deal, which came as a bit of surprise. Rumor was that Reed was seeking a 3-4 year deal for the extra security, but ended up taking a spot in the Twin Cities to be closer to his wife’s hometown. I was thrilled when I learned this. My team, the Twins, got a great deal on a quality reliever. We basically paid market value for a reliever who has a good track record, except we didn’t have to worry about him regressing near the back of a long deal. In fact, we got Reed for less than the Phillies gave Tommy Hunter, and Reed is a more proven and arguably better reliever than him! Awesome! Okay…..but hold on a minute. Let’s back this up for a second and analyze this from a different viewpoint, a political viewpoint. For me, this deal and my reaction to it has a lot of conflicting views relative to my political beliefs. I consider myself a leftist, which, for the purpose of this article, means I am very pro worker’s rights and pro re-distribution of wealth downwards. Again, my views do not reflect yours, the players, or anyone’s, nor do I think any individual needs to or should have the same views as me. Just another reminder! Thanks.

The Twins are owned by the Pohlads, a triad of large adult sons who inherited their fortune from their now deceased father, Carl. Carl Pohlad made his living through banking and investing and bought the Twins in 1984 for $36 million. His three sons now own the team together, which is valued at roughly one billion dollars. Altogether, the Pohlad sons are worth $3.8 billion. I want to make something very clear here: all politics aside, you, or anyone else on this planet, does not need 3.8 billion dollars. Hell, you don’t even need one billion dollars. The main question I have to ask myself is this: why do I get excited when I find out that my team, owned by a group of people worth nearly four billion dollars, gets a good deal on a player because they gave him .4% of their net worth ($17 million divided by $3.8 billion) instead of something like .6% of their net worth ($24 million, or eight million per year at three years divided by 3.8 billion dollars). Addison Reed and players like him are the reason I go to Target Field and watch Twins games in the first place. If the Twins don’t sign Addison Reed, their bullpen becomes actively worse, the team performs badly, and they become less entertaining to watch as a group. Watching your team win games is fun, in fact, that’s the reason we’re sports fans in the first place! The purely tribal aspect of identifying with a group, watching them perform well, and being able to bond with other people as a result is what makes sports great. The only reason teams win games is because of the players they have. They are the entertainers, the figures we bond with, and the reason we go to the stadium in the first place. Again, why am I happy that the billionaire owners saved a couple million bucks?

One of the consequences of the rise of sabermetrics is now, we as a community and fans, have the ability to microscopically analyze and value players.

Moneyball was born from the idea that low budget teams could get good players and pay them less because of their skill set, like their ability to get on base, or OBP, a stat which a lot of teams didn’t have a good grasp on how to value at the time. These organizations were applauded and their techniques were copied, and as a result, every team in the MLB now embraces sabermetrics and sucking every ounce of capital value they can out of every deal they make. As this offseason has shown, teams are now becoming weary of handing out big contracts to older free agents. Whether or not collusion is happening is an entirely different story, and beyond the scope of this article. But right now, when the Twins sign someone Addison Reed to a surprising contract, or the Astros give up much less in value that what Gerrit Cole is perceived to be worth, or the Cubs refuse to give Jake Arrieta, the 2016 Cy Young award winner, a six-year contact, we have the opportunity to log on and shower praise upon these organizations for their tactical approach to the game, and their ability to embrace analytics. Then, when players like Albert Pujols sign gigantic deals and start to decline two-thirds of the way through these massive contracts, we log on yet again to explain why the Pujols deal is a cancer on the Angels and how terrible of a decision Jerry Dipoto made by signing him.

I’ll use my hometown Twins as another example here. In 2010, Joe Mauer signed an eight-year, $184-million dollar extension. In my opinion, it was a great story. Mauer, fresh of his MVP campaign of 2009, signed an extension which, at the time was a lot of money. He decided to stay and play catcher for his hometown team, not to mention the only team he has known his whole life. Since then, Mauer has suffered a variety of injuries, most prominently a concussion, and has changed his position to first base. Fans were not happy. Mauer was put on blast for being too injury prone, local sports writers like Jim “Hot Take” Souhan wrote pieces calling Mauer “coddled“. Mauer’s production suffered, and he quickly became much less valuable than he once was. The contract looked horrible. A lot of people were asking why the Twins should be giving so much money to a player who doesn’t play and whose value continues to decline. Again, let’s take a step back from this for a second. For some ungodly reason, just in sports, it is OK to put someone on blast for being hurt a lot.  Mauer had a line of work where balls came flying at the general direction of his head at 100 mph. Injuries happen, and when you catch, traumatic brain injuries like concussions will happen, and when you suffer a traumatic brain injury, there will be consequences. Because of the concussion, Mauer suffered blurred vision and was unable to track pitches for nearly two years after it had happened. If you can’t see the ball, you can’t hit it, and you can’t do your job. If you were (or are) a construction worker, and you got hit in the head with a falling cinder block, and you were wearing all your protective gear but still suffered a serious concussion, your employer, fellow employees, friends, and family would never call you soft, or say things like “well he gets hurt, so he deserves to get paid less now”. The fact that this exception exists for athletes purely because they make more money than other workers is crazy to me. They’re still human beings, and they still need to live healthy lives. Mauer has remained a villain for some Twins fans to this day, simply for signing a contract where he was rewarded for doing well. He and Albert Pujols are claimed as examples as to why long-term, expensive deals are bad.

Let’s keep these expensive deals in mind. Baseball is a very different sport because of the fact that there are no salary caps, either for teams total payroll, or for players and their individual contracts. Sure, there is a luxury tax that is imposed on teams that spend over a certain amount of money, but that hardly constitutes any sort of hard cap on spending. Because of this, baseball has a unique attribute where players can get paid as much as they possibly can, yet the market still sets a value for each win a player brings in. As of right now, one win is usually worth around eight million, because, well, that’s what was decided. When teams sign players for under market value, they are applauded, and they are ridiculed when they do the opposite. But why? Why aren’t we happy when our entertainment (the players) make the most money they can? On top of this, prospects and minor league players make below poverty wages, and are often forced to take other jobs during the offseason to provide for their families. Like I’ve said before, they’re the reason we come to the ballpark. They make the game fun to watch. Now you might be thinking, “Yeah but Will, what about payroll? These teams don’t have infinite resources and they’ll have to pay the luxury tax and get penalized for spending money!” My response to this? Who the hell cares. What’s stopping the Twins from offering Yu Darvish a 5-year, $200 million dollar deal? Obviously, this is a bit outlandish, but the idea that long, expensive contracts are out of teams’ price ranges simply isn’t true. Doing some math again, a $200-million dollar deal would be 5% of the Pohlads’ net worth. Darvish would be getting paid for providing entertainment to the masses, and the Pohlads would see an increase in attendance and participation at Target Field for bringing in exciting talent.  Even for a team like Brewers or Rays, this deal is feasible based soley on the income of the owners.

Another question you might be asking is why I think the Pohlads owe me entertainment, a random person who just happens to like baseball. Why should they have to use their own money to entertain me?  Here’s the thing: they do owe me, because I helped paid for Target Field. In fact, so did the entirety of Hennepin County in the state of Minnesota. Hennepin County taxpayers paid for 65% of Target Field, which turns out to be 350 million dollars. The Minnesota Twins organization paid for $150 million. Again, I had money taken out of my pocket for a private organization to build a stadium where they then get to attempt to give the shaft to their employees by paying them as little as possible to “find value.” This same scenario comes up across the league, with an egregious example being the latest sale of the Miami Marlins by their former owner, Jeffery Loria. Marlins fans paid for 80% of Marlins Park (which was financed through Wall Street loans, which now the county is stuck with) and got absolutely nothing in return; in fact, Loria sold the team and pocketed money taken from the citizens of Miami-Dade County. When I go to the stadium that I helped pay for, I want to see an entertaining team, and I want to see my fellow workers rewarded for their talent and efforts.

The fact that owners have been able to screw over players for so long while hoarding their money is simply unacceptable. It’s time for the MLBPA to take a step back and consider the possibility of a strike. The current free agent system hurts players by not allowing them to market their talents during the peak of their careers, thus leading to teams being wary of handing out longer contracts to older players. “Small-market teams” actively treat players like currency, soaking up the years of their prime by paying them nothing, then forcefully removing them by trading to another team for promising youth, therefore starting the cycle again. The luxury tax imposed on teams discourages paying players what they’re actually worth. The way the current CBA is constructed hurts players in a way like no other league, where now, players make just a little over 40% of all revenue. It’s a month until spring training, and they 2016 Cy Young award winner does not have a team yet. That is astounding. I’m not saying it’s time to start giving out $100-million dollar a year contracts to say, I don’t know, Cliff Pennington, but it’s time to take a step back and re-evaluate why we love baseball.

We should be celebrating the success of our fellow workers, not dragging them down for being hurt or signing big contracts. Sabermetrics may be a very neat tool for analysis, but we shouldn’t use it to try to degrade the value of the people that make this sport great. We can still use sabermetrics and advanced data to help players get better by improving a batter’s swing mechanics, optimizing defensive shifts, or creating the best pitch sequencing for a pitcher to follow, while still keeping in mind that players are the reason we love baseball.


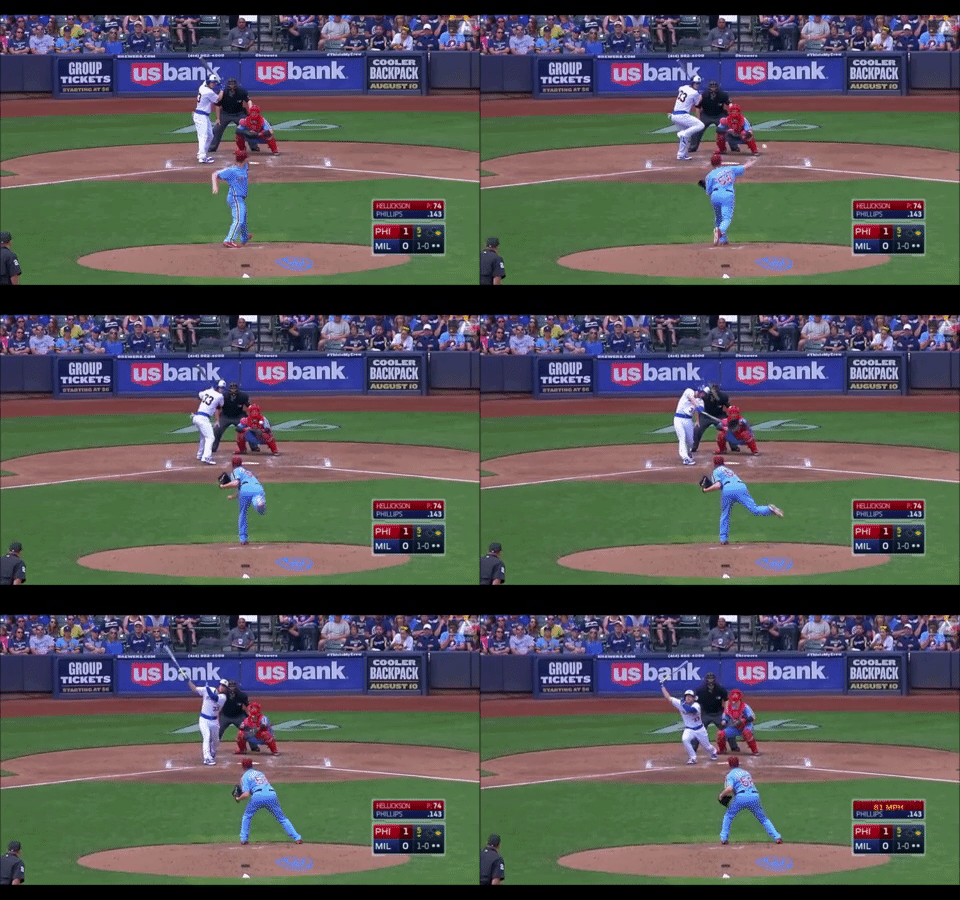
The Brewers Should Sell High on Brett Phillips

On Thursday evening Brewers have made some significant acquisitions to their outfield, notably acquiring Christian Yelich in a trade with the Marlins, and signing Lorenzo Cain to a five-year, $80-million deal. The Brewers have added around 7 Wins in a single day, at least according to Steamer, which has Yelich projected for 4.0 WAR and expects Cain to produce a WAR of 3.3. The point is, the Brewers have other outfielders such as Domingo Santana, Keon Broxton, and Brett Phillips, whose future with the team are now unclear.

One can make the argument that Broxton is perhaps more likely a bench player than the star player he seemed to be in his brief 2016 campaign. Keeping him as a fourth outfielder would not be an unreasonable expectation. Santana is likely at least an average outfielder, if not more, so keeping him around would be a waste of his talent, so trading him would make sense. Brett Phillip’s strong showing late in the 2017 season makes him a valuable trade chip, too, especially considering that he still has not exhausted his rookie eligibility.

Rumors of the possibility of the Brewers trading the two outfielders were confirmed by Bob Nightengale:

While Santana is no doubt an interesting player worth examining, Phillips is whom this article concerns. It seems that Brett Phillip’s value could be at its peak right now, for a multitude of reasons. An overarching theme of many transactions in Baseball this winter, or lack thereof, has been the seemingly increasing value of prospects to teams. This high value may be peaking right around now. First of all, contending teams with the need for an impact veteran player at the deadline will be less concerned about trading prospects at that time. However, also as a result of the reality that next winter there will be the star-studded free agent class, which should, in turn, facilitate more transactions throughout the baseball industry as a whole.

Phillips played in 37 games last season for the Brewers, yet he is still rookie eligible and is controllable through 2023, for the next six seasons. He posted a 104 wRC+, adding 2.2 runs on the bases, while accounting for 4.5 runs saved on defense. He showed off his cannon of an arm by throwing a ball 104-mph according to Statcast, and made multiple other throws from the outfield over 101-mph.

Those are all reasons why the 29 teams in baseball not named the Brewers should be high on him! He has done everything well in the Major Leagues thus far, so on the surface, there are not necessarily any real red flags in his profile. Though upon examining his brief showing in the big leagues last season more closely, there are reasons to be concerned about his ability to sustain the success he had.

Regression to the mean is always likely, and this is the essence of the story Phillips’ data is suggesting. What is so interesting about Phillips though, is that there is another player who seems to have a very similar skillset. Looking at the Major League hitters’ strikeout rates in 2017, Phillips and Drew Robinson both struck out 34.7% of the time. That is how the players were first connected by the author, which ended up being the basis for what has turned out to be a really interesting investigation.

Here are some of last year’s numbers for both players:

Player Team Games PA BB% K% ISO SLG wOBA wRC+
Brett Phillips Brewers 37 98 9.2 % 34.7 % 0.172 0.448 0.338 104
Drew Robinson Rangers 48 121 11.6 % 34.7 % 0.215 0.439 0.323 96

The performances are in a small sample, which is the primary reason to be doubtful that this comparison is necessarily very accurate. However, it is nonetheless captivating that the two players had such similar seasons in 2017. It gets better though! They both hit left-handed and throw right-handed, and take a look at how similar their swings are!

Phillips:

Robinson:

The swings are pretty similar, agreed? The finishes are slightly different, but the bat paths and leg kicks of both players are certainly quite reminiscent of each other. Phillips had an average launch angle of 13.27 degrees, while Robinson’s average launch angle was 14.29 degrees in 2017. Given such a finding, it would seem to make sense that they have relatively similar bat paths through the hitting zone. Consider the most recent tool grades given to each player by Fangraphs Prospect Analyst Eric Longenhagen:

Player Hit Raw Power Game Power Run Fielding Throw
Drew Robinson 40/40 55/55 40/45 55/55 50/55 60/60
Brett Phillips 40/40 55/55 45/50 55/55 50/55 70/70

Phillips has a better arm, and Longenhagen gave him a 45 FV, while he gave Robinson only a future value of 40 on the 20-80 scouting scale. Though one could reasonably argue that they are kind of the same player. At the very least, these are two players with very similar hitting abilities and performances thus far.

While Phillips produced a WAR of 1.0 during his 37 games with the Brewers in 2017, Robinson’s WAR was 0. What has to be kept in mind, however, is the fact that Phillips was riding a .408 BABIP, that is highly unlikely to occur again. Steamer projects both players to hit .229 in 2018, illustrating the similarities in their profiles. Phillips is expected to put up a 77 wRC+ figure, with Robinson actually having the edge with a mark of 86 wRC+ projected by Steamer in 2018.

These are two players that are similarly mediocre, in the writer of this article’s best estimation. The fact that Phillips does not have a good chance of getting any meaningful playing time in the outfield this season is already enough to justify Milwaukee trading him away.

The reality that his value is perhaps at its highest right now, as a result of a great debut performance with the brew crew in 2017, also strongly points towards the idea of trading him. Throw in the fact that he is controllable for six more years, and there seems to be little reason for his value to increase. The Brewers would do well to acquire some pitching in exchange for Phillips. The time is now to do so!

All Data used in this article was taken from Fangraphs, as well as MLB.com and Statcast.


Finding Nimmo, the Mets’ New Leadoff Hitter

As we all know, this has been a long, frustrating, mostly inactive offseason for the Mets. After a 92-loss season, they have done little to improve a pitching staff that finished with the second-worst ERA in the National League last year, other than the fairly risky signing of 32-year-old Anthony Swarzak.

They have holes or uncertainties at every position in the infield to some degree and have created a five-man outfield logjam with five starting-caliber, but injury-prone outfielders outside of Jay Bruce.

There are countless paths the Mets could take to try and build a competitive roster, but that’s a topic for another time. What I want to get into is a certain player who must be given a fair chance at a starting role, and that is 24-year-old outfielder Brandon Nimmo.

A first-round pick from 2013, some considered Nimmo a disappointment due to his lack of flashy tools, despite solid numbers throughout the minors. He always maintained a healthy OBP due to his high walk rate and solid contact ability. After a great 2016 season in Triple-A where he put all his tools together to hit .352/.423/.541, he put up a sub-par but not horrible 88 wRC+ in his first 80 plate appearances in the Majors.

Nimmo started to swing the bat more that year, so while his walk rate decreased a little bit, he hit a career-best .352 and still had a spectacular .423 OBP. He also hit for the most power he had ever hit for in a minor league season, and while some of that may be attributed to the hitter-friendly Pacific Coast League, it was still very encouraging and suggested that Nimmo could develop into a quality Major Leaguer.

With the Mets having a rough 2017 season, Nimmo’s playing time began to increase more and more throughout the year, and he made the most of it. The main thing about Nimmo that was so impressive was his consistent ability to have good at-bats. He has an elite eye at the plate and a unique ability to lay off almost any pitch outside the strike zone.

In fact, among hitters with at least 210 PA last year, Nimmo had the fifth lowest O-Swing percent in all of baseball. He also had the 10th best walk percentage in baseball, behind names such as Joey Votto, Aaron Judge and Mike Trout, and ahead of names such as Josh Donaldson, Kris Bryant and Paul Goldschmidt. He quietly was one of the most disciplined hitters in the league.

Another encouraging sign for Nimmo is how his power developed as the year went on. Never known as a slugger, he showed very little power in his brief 2016 stint with the Mets, and that continued into 2017 as he had just one extra-base hit in his first 25 plate appearances.

His power started to rise in August when he recorded a more respectable .100 ISO while hitting his second career home run (first of the year) along with three doubles, but his power output really started to rise in September and October, when he got the chance to play every day and put up a .219 ISO, which is not only respectable but above average.

To put that into perspective, Chris Davis, Justin Turner and Jose Altuve all had ISOs lower than .210 in 2017. Now, I’m not saying that Nimmo will ever have as much power as those guys, but it’s really encouraging to see how his power developed as he got more comfortable with major league pitching, and is a sign of his potential for the future.

One thing that could be improved about Nimmo’s game is his tendency to strike out. He struck out 27.9 percent of the time, which isn’t terrible, but it is high, and improving this facet of his game would make a huge improvement overall. He didn’t strike out because he was chasing pitches or swinging wildly.

As I mentioned earlier, Nimmo has one of the best eyes at the plate in all of baseball and has a simple, compact swing. The fact of the matter is that Nimmo may have actually been somewhat too selective, as he swung at only 59.3 percent of pitches inside the strike zone, compared to the league average 66.7 percent.

In the rare times that he did swing outside of the strike zone, he made contact 7.6 percent below average. When he swung at pitches in the zone, he made contact at roughly a league average rate, so there’s some room for improvement there as well.

While Nimmo does have some strikeout problems, his are much more easily fixed than the typical young player who comes up and slashes at everything in the dirt since Nimmo already has a great knowledge of the strike zone.

Contact isn’t a huge problem, his contact rate was one percent above average, it’s really just knowing when to take a hack at a hittable pitch, which is something that can definitely improve over time, especially for a hard-working, intelligent young hitter such as Nimmo.

With an improved strikeout rate, I could see Nimmo hitting for a higher average in 2018 even if his BABIP dips, which would add to his already impressive OBP.

But now to get to my main point, which is that the Mets need to give Nimmo a chance at an everyday role despite having five capable outfielders on their team. In his 215 PA last year, he hit .260/.379/.418 with a 117 wRC+.

Granted, he did have a somewhat high .360 BABIP that will likely regress, but Nimmo is someone who has been able to post high BABIPs in the minors, so maintaining an above-average BABIP is certainly feasible.

His .158 ISO is only slightly below league average, and the improvements he showed throughout the season suggest that he may even be able to add a little power in the future. Add league-average power to a great OBP, decent baserunning and passable defense, and you’ve got a starting caliber player.

Something that I think is getting overlooked, however (besides his surprisingly not-awful power), is just how valuable his ability to get on base is, and why the Mets need this guy at the top of the lineup consistently.

His 117 wRC+ was identical to Carlos Santana, Trey Mancini and Yasiel Puig, and was just one point behind Jay Bruce and Francisco Lindor. It was also higher than players such as Christian Yelich, Lorenzo Cain, Neil Walker, Lucas Duda and Ryan Braun. Getting on base is one of if not the most valuable skill there is to have as a hitter, and it is something in which Nimmo excels.

Watching him for the past couple years now, he seems to be constantly improving, leading us to believe that there is more in store for the soon-to-be 25-year-old. His 1.1 WAR stretched out to 550 PA equates to a 2.8 WAR, which is above average for a starter and greater than what the recently re-signed Bruce put up last year in 619 PA.

In fact, an argument could be made for starting Nimmo over Bruce, due to the fact that Nimmo provides much better value on the bases and in the field, where he can play all three outfield positions.

Regardless, the Mets need to realize that they have a quality player developing here, and in my opinion, it would not be wise to trade him considering his potential and five years of control left. If I were the Mets right now, I would have him be my Opening Day center fielder.

The Mets need to play Nimmo, and they need to bat him leadoff. Michael Conforto is a great hitter, but he’s not a leadoff hitter. Amed Rosario is not a leadoff hitter. Asdrubal Cabrera is not a leadoff hitter. Nimmo, however, is the embodiment of an ideal leadoff hitter which is someone who works the count consistently and gets on base.

They may platoon him with Juan Lagares, which is understandable considering Nimmo has struggled against lefties so far in his career and Lagares brings elite defense to the table, but no matter what, Nimmo has done more than an adequate job of proving that he is someone worth giving a chance to. Let’s hope for even more improvement from Nimmo in 2018.

Thanks for reading! If you liked this article, you can follow me on Twitter for Tweets about all things baseball, largely including but not limited to the Dodgers and the Mets. I am also a writer for MetsMerizedOnline.com, MetsMinors.net and The K Zone, where this article originally appeared.