What’s Happened to Gordon Beckham?

Once hailed the savior of the White Sox, Gordon Beckham has suffered from the dreaded “sophomore slump” in 2010. In 430 at-bats as a rookie, Beckham put up a slash line of .270/.347/.460. In the off-season, Beckham was shifted to second base, where he was expected to make a bigger impact with both his bat and his glove. While Beckham has provided value with his glove in 2010, as a hitter he has completely collapsed. Beckham’s current slash line of .206/.283./252 has left many White Sox fans wondering about the future of their former top prospect.

A look at the advanced metrics reveals some troubling trends. Beckham’s solid walk rate has dropped from 9.5% to 8%, while his strikeout rate has risen from 17.2% to 19.6% in 2010. His swing rates reveal that Beckham has chased pitches out of the zone with more frequency in 2010. His O-Swing% (or percent of pitches he has swung at outside of the zone) has risen from 24.7% to 30.4% this season. While Beckham has actually made more contact with pitches out of the zone in 2010, they are leading to an increased number of infield flies. Beckham’s 16.1% infield fly rate is currently the 11th highest rate in baseball. Also troubling, is Beckham’s poor 15% line drive rate. While BABIP is typically a good indicator of luck, in Beckham’s case, it’s hard to argue he’s been unlucky. Beckham’s current BABIP of .250 would typically suggest improvement, but with such poor line drive and infield fly rates, it’s hard to imagine a big improvement if his rates stay the same.

During the season, some Chicago writers have suggested that Beckham may be pressed after experiencing failure for the first time in his career. While I cannot assess the mental state of Gordon Beckham, his current rates are so out of line with what we would expect that, as a fan, you have to wonder if Beckham is pressing. Last season, Beckham slugged 14 home runs in 430 at-bats. This season, his slugging percentage is actually lower than Juan Pierre’s (.258-.272). Another troubling aspect of 2010 is Beckham’s inability to hit a fastball. Beckham feasted on fastballs last season, hitting them for 4.8 runs above average (per FanGraphs). In 2010, that number has plummeted to -5.7, meaning that batters are able to blow their fastball by Beckham. Looking at Beckham’s pitch values is quite depressing. As a rookie, Beckham hit four types of pitches for a positive value (fastballs, sliders, change-ups, and curveballs). In 2010, Beckham has a negative pitch value rate against every one of those pitches. While his struggles against fastballs are the most pronounced, his ability to hit sliders and change-ups have dropped substantially as well.

Are these the symptoms of a player struggling to cope with failure for the first time in his career? While the answer to that is unclear, this has certainly been a “lost” season for Beckham’s development. His numbers, particularly his infield flies, home runs, and complete loss of pitch recognition seem to suggest a complete breakdown in 2010. In the same way that Alex Rios’ numbers last season were not an accurate reflection of his true ability, it’s fair to say that 2010 has not been an accurate reflection of Gordon Beckham’s true ability. Unfortunately, there isn’t much the White Sox can do to rectify the situation right now. The Sox are hesitant to send Beckham down to Triple-A, and would prefer that he work out his issues at the major league level. Unless Beckham can rebuild his swing and regain his confidence, Sox fans might have to wait until 2011 before they see “the real Gordon Beckham” again.

*This article was originally published on my personal sports blog FoulPole2Foulpole.com


The Todd Helton Situation

As of June 15th the Rockies were 3.5 games behind the Padres for first place in the NL West and the general consensus is that the team is underperforming. With the pitching staff sporting a solid FIP of 3.67 (2nd in the NL) the finger pointing has turned to the offense. Whether or not the offense is to blame for the team’s “woes” (I’m somewhat skeptical, can you tell?) one thing is for sure, something is wrong with Todd Helton. Helton is experiencing what people are calling a “season long slump” (to which Chris Iannetta asks, “So does that mean there is such a thing as a ‘career long slump’?”) hitting .255/.361/.323 with 1 HR. He’s moved from third in the team’s batting order to sixth, and recently has moved back up to second in an attempt to get him kick started. Here I’ll examine what is different this year and why. First let’s take a closer look at what we already know: in 2010 Todd Helton sucks at hitting.

The first thing that should pop out at you here is not Helton’s subpar 2010 numbers, but how good his career numbers are. As a player ages and younger, faster, stronger, better looking players come along it’s easy to forget how great a veteran’s career has been, especially one as consistently good as Helton. Sure the T-1000 was super awesome with its mimetic metal alloy and shapeshifting and whatnot, but who paved the way for him? I’ll tell you who: Todd Helton.

Now look at those subpar 2010 numbers. Pretty bad. We are into June and Helton has accumulated a healthy 227 plate appearances. He hasn’t had a month with a wOBA higher than .335, in fact, he hasn’t had any period of anything close to resembling his career production all year. For a veteran player known for his solid swing mechanics and meticulous approach to hitting, it would seem that he would have figured it out by now. Or figured something out, it doesn’t even have to be IT. Just something.

“Maybe it’s just bad luck”, you say. Well, his BABIP is a pretty solid .309. Sure, it’s lower than his career mark of .336, but it’s not bad by any means. It’s not .318 wOBA bad. Of qualified players with BABIP’s between .300 and .310 only three of 19 have lower wOBA’s than Helton. Luck and BABIP have little to do with it.

Maybe he’s lost his great eye and is swinging at bad pitches. There might actually be something to this as it was reported that Helton was fitted with contact lenses on June 7th. However, nobody in that article seemed overly convinced they had fingered the culprit of Helton’s lack of production. Since getting fitted for the contacts his slash line is .292/.280/.333. Even in a small 25 PA sample, not exactly a ringing endorsement of the corrective lenses fix. The real question here is one of pitch selection, has there been a change? Given that his O-Swing% is 18% vs a career 17.6% chasing doesn’t seem to be the problem. If he were having problems recognizing pitch location or type his walk rates would most likely take a hit as well, but that’s not the case either. He has a solid BB% of 14.1% (career 14.5%). He seems to be seeing the ball just fine.

So what then? Where does that leave us? Is he really in a “season long slump”? A 227 PA aberration? Maybe, but let’s look at a few more pieces of data. One of the numbers that jumps out at me most is Helton’s 2010 K%. Known as someone who is a notoriously good two-strike hitter he has a career K% of 13.7% and has never had a K% above 17.7% (in 2001, when he posted an ISO of .349, so we’ll take it). As of June 15 Todd’s 2010 K% is 18.8%, the highest of his career and a far cry from the 13.4% of 2009. Helton has struck out 36 times in 192 AB in 2010, in 2009 he had 73 in 544. At his current pace he will accrue 102 strikeouts over 544 AB. He’s only ever K’d more than 100 times in a season once. Ok, now we’re getting somewhere: his balls in play are falling at a relatively normal rate, he’s not chasing pitches, he’s getting his walks, but he’s striking out at an abnormal rate. Maybe pitchers have changed how they approach Helton. Here is the pitch type data for 2009 and 2010 from TexasLeaguers.com:

2009

2010

Comparing these two tables gives us some interesting bits of information. If anything we can see that Todd is handling offspeed pitches better. Not only is he seeing more sliders (SL) and changeups (CH), but he is swinging at them less and whiffing less. This could be a pitch recognition issue, but I see something more glaring and problematic: fastballs (FF). Against fastballs his whiff rate is up, while foul and in play rates are down. Not only is he putting fewer fastballs into play, when he does put them into play he’s not doing much with them. Here’s what Helton did with fastballs put into play in 2009:

It’s clear that Helton sprayed fastballs all over the field pretty equally, and mashed mistakes to right field. Now take a look at 2010:

Big difference. The majority of the balls in play are to left field, and the mistakes he hits are obviously not going as far (as evidenced by his one home run). Granted, Helton has a history of driving the ball to the opposite field, but he has also shown the ability to hit fastballs to all parts of the park, something he is clearly not doing as effectively in 2010.

So what’s behind the Todd Helton Situation? All of this data suggests a slower bat. If you’ve watched him play you’ve no doubt seen him get beat by some pretty mediocre fastballs. Keep in mind Todd is going to turn 37 this year. Sure he played wonderfully in 2009 posting an OPS of .904, but that was coming off a year in which he only played in 83 games. Since 1961 only 22 players have had multiple seasons with an OPS of .900+ past age 35. The thing about bat speed is that once it’s gone it’s gone. The one hope is that there is a hitch or something mechanical in his swing that’s causing this, but, as I pointed out before, a hitter as good as Todd with the help of Don Baylor would have most likely identified a mechanical flaw by now.

As far as his numbers are concerned, if he continues to get regular at bats there does seem to be room for a small amount of regression (the good kind in this case). Will it be enough to keep him in the lineup? If not, what are the Rockies’ options? And what about next year and the year after that?


A Closer Look at Austin Jackson

Austin Jackson is off to a brilliant start in his major league career.  But any discussion of his hot start invariably leads to discussion of his strikeout total.  His 63 have him just one behind the American League “leader”, Carlos Pena.  Several National Leaguers (six) are ahead of him including perennial air conditioner, Mark Reynolds.  We are conditioned to believe that strikeouts are at least as bad as WMDs and possibly worse than British Petroleum.  But what should we really make of all of Jackson’s strikeouts?  Are all strikeouts created equally?  Is he just flailing wildly and piling up lucky hits when he does make contact but otherwise striking out?  Or is there more to the story than just the negative connotation of strikeouts?

The Strikeouts

Let’s dig deeper into Jackson’s 63 punchouts and see exactly what we are dealing with in the youngster.  He is averaging 4.8 pitches seen per strikeout which I guess is essentially 1.8 when you consider that every strikeout will be at least three pitches long.  Kevin Youkilis, who is renowned for his plate discipline, sees an average of 5.0 pitches per strikeout, just 0.2 pitches more than Jackson.  In fact, the MLB average on the 12209 strikeouts this season is 5.0 pitches per strikeout.  Jackson is just 4% below the average, hardly cause for concern.

Just eight of Jackson’s 63 strikeouts (13%) have been the worst kind: good morning, good afternoon and goodnight.  Jackson’s 13% 3-pitch strikeout percentage is much better than the league average of 17% (2021-of-12209) and a good bit better than the average of all leadoff hitters who check in at 16% (211-of-1339).  Also, 19% of his strikeouts have gone to a full count which is 3% better than the major league average.  Hopefully he can learn to turn more of those full count plate appearances into walks as the season wears on; that will be instrumental in his development as hitter, but especially as a leadoff hitter.

One of the biggest arguments against strikeouts is that it eliminates the chance for a “productive out” which is just an out that advances someone.  By striking out, a player doesn’t put the ball in play and leaves the runner where they were when the plate appearance started.  Of his 63 strikeouts, 38 have come with the bases empty (60%).  This eliminates the “productive out” argument from more than half of his strikeouts.  By comparison, 57% of the entire league’s strikeouts have come with the bases empty.

Finally, let’s look at Jackson during the first inning when he is leading off the game.  The job of a leadoff hitter is to draw the pitcher’s arsenal out and give the team an early look at what he’s got for that game.  While 14 of his 52 leadoff PAs have been strikeouts, only two (14%) were 3-pitch strikeouts as Jackson averages 4.7 pitches per leadoff plate appearance that results in a strikeout.  His 3-pitch strikeout rate is below the major league mark of 16%.

The Performance

We deep dove into Jackson’s strikeouts so now let’s deep dive into his overall performance thus far.  Jackson is seeing 4.1 pitches per plate appearance which tied for 2nd-best among American League leadoff hitters.  Elvis Andrus is leading the way at 4.2 and Jason Bartlett is tied with Jackson.  He is averaging slightly higher on leadoff plate appearances with a 4.3 mark.

In the first inning, Jackson has a .292/.346/.500 line with 14 hits, 14 strikeouts and four walks.  His 27% leadoff strikeout rate is significantly higher than the 19% for all of baseball, but he obliterates the league line of .246/.313/.355.  He has just one 1-pitch leadoff plate appearance (2%) and he ripped a double off of Dallas Braden, meanwhile the league’s rate is 7% on 1-pitch leadoff plate appearances.

For the season Jackson has just 19 1-pitch at-bats of his 249 (8%) and he is hitting .474 in those 19 ABs.  For the league, 11% of all ABs have been 1-pitch encounters and the collective batting average is .343 in those 7298 ABs.

The Conclusion

Jackson is off to great a start in his rookie campaign yet a lot of the focus lands on the strikeouts.  I am not here to say that he isn’t striking out a ton or that it’s awesome to strikeout that much.  In fact, he is on pace for 183 which would be 2nd-most for a rookie in MLB history (Pete Incaviglia, 185), but he is also on pace for 49 doubles, 23 stolen bases and a .316 batting average.  Let’s not crucify Jackson for two months of data.  He struck out in 24% of his minor league at-bats and he’s at 27% so far as a major leaguer.

He has a 28.1% O-Swing percentage according to FanGraphs.com which is a measure of how many pitches outside of the zone he has swung at thus far.  That is about average in the American League.  Of the 83 qualified hitters in Junior Circuit, Jackon’s rate is the 39th-highest.  As you can see, he isn’t just hacking away at the plate and some of his longer at-bats that are currently ending in strikeouts should soon turn to walks (or better) as he gets more and more comfortable as a big league player.

As we have seen, not all strikeouts are created equally.  With the proliferation of hackers in the big leagues in this era and their lack of shame associated with striking out, there is this desire to demonize the event for all players.  I definitely want to see Jackson strike out less if for no other reason than the fact that his BABIP of .432 will likely drop a bit more and thus he needs to put more balls in play otherwise his average will drop well below .300, but I also see that his strikeouts haven’t been a serious liability for the Tigers.  He has a pretty good idea of what he is doing at the plate, especially as a leadoff hitter in his first two months in the show.

He has acquitted himself very well at the plate while hitting leadoff and playing one of the most important defensive positions.  How often do we see guys much more hyped than Jackson perform significantly worse yet get pass after pass for their pedigree and excuses because the team has thrust them into a key lineup spot and/or primary defensive position?  It happens quite a bit.  (Matt Wieters anyone?)  So how about when someone actually performs well in a key lineup spot while playing elite defense, we actually applaud the performance instead of looking for the flaws to cut it down?  I am suggesting we ignore Jackson’s egregious strikeout total, rather make it a secondary headline or footnote to the overall picture with the central focus placed on his quality work in many other facets of the game.


What’s Behind A-Rod’s Power Outage: The Sequel

When Yankeeist last looked at Alex Rodriguez’s declining power numbers, I (and several others) came to the rather obvious conclusion that his paltry 8.3% HR/FB rate would soon escalate. Alex’s five home runs since that point in time have indeed bumped his rate up, but it’s only sitting at 12.1%, still well below his 23.3% career percentage.

A-Rod has eight home runs on the season to date; the lowest number through 58 games of his career and only the second time he has accumulated less than 10 this deep into a season — in 1997, he had nine through 58 games with the Mariners. So what’s going on with Alex?

The below table shows historical batted ball numbers for A-Rod, his year-to-date home run totals (in this case, through the first 58 games of each season), and his season home run totals (all data c/o Fangraphs and B-Ref):

Despite five big flies, Alex’s fly ball percentage is down from when I last looked at the numbers on May 10. Accordingly, his line drive percentage is also down, to 17.9% (though this is barely off his career rate) and his ground ball percentage is up, to 46.2% (pretty well above his 42% career rate).

As you can see, Alex has never had a Fly Ball % this low in a full season for as long as Fangraphs has recorded this data, which partially explains why his HR/FB rate has only risen by 3.8 points — he’s just not hitting as many fly balls as he usually does. Assuming his Fly Ball % normalizes to his career rate, we should see a corresponding uptick in the HR/FB percentage.

Here are the different pitch types A-Rod has seen:

Pitchers are obviously aware that A-Rod isn’t hurting the baseball as much as he usually does, as they are challenging him with more fastballs than ever before. Correspondingly he’s seeing less of every other pitch type since May 10, with the exception of a slight increase in changeups and split-fingered fastballs. Looks like the book on ‘Rod remains challenging him with the heater, which means he’s going to have to make some adjustments to his approach, as there’s no reason Alex shouldn’t be able to adequately handle a steady diet of fastballs.

And here are his swing percentages:

Since I last conducted this analysis, Alex is swinging at even more pitches out of the zone (25.8%) but making less contact with them (60.1%), and also swinging at more pitches in the zone (65.7%) and making less contact with those as well (91.8%, down from a crazy high of 97.3%). His overall contact percentage is 81.4%, still a good deal higher than his career rate of 75.5%.

It would appear Alex’s biggest problem is that he’s trying to make too many things happen with the bat right now — swinging at pitches out of the zone has contributed to an above-average (for Alex) contact rate, which is resulting in more balls being pounded into the ground than lofted into the air (hence the career-low Fly Ball %).

Alex has also eschewed his trademark patience during the past month. He had 19 walks through 31 games, but has only walked seven times since then over his last 27 games. His OBP has dropped from .381 on May 10 to .360.

While A-Rod still has time to improve his numbers, and ZIPS ROS projection has him hitting a robust .284/.378/.512, .392 wOBA and 18 home runs the rest of the way, that would still only get A-Rod to a full season line of .285/.371/.499 with a .381 wOBA and 26 bombs, which would mark his lowest SLG, home run total and wOBA since 1997.

Basically, A-Rod needs to stop swinging at bad pitches, take a few more walks and show pitchers he can still punish the fastball if we’re going to see significant improvements in the Fly Ball % and HR/FB rate and get his numbers anywhere near his career line of .304/.389/.573. I realize that’s a rather obvious conclusion that probably didn’t require a comprehensive statistical analysis, but it’s nice to see that the numbers support it.

Larry Koestler eats, drinks, sleeps and breathes the Yankees at his blog, Yankeeist.


Revisiting a Blown Call from the 2009 Playoffs

By now, just about everyone knows about how umpire Jim Joyce blew a call during Armando Galarraga’s start against the Cleveland Indians, which cost him the 21st perfect game in major league history. Instantly after Joyce’s error was discovered, fans were calling for Joyce to be fired. However, he certainly isn’t the first umpire fans have wanted removed from the game, and he certainly won’t be the last.

For those that remember, Tim McClelland had his own controversy during the 2009 ALCS between the New York Yankees and the Los Angeles Angels. Long story short, during Game 4, Nick Swisher was at third base when Johnny Damon lined out to center fielder Torii Hunter. Swisher tagged up and presumably scored, until the Angels appealed that Swisher left third too early. McClelland agreed with the Angels and called Swisher out. Here is the video of the play. (Only the first 45 seconds is necessary to watch.)

From personal experience, it seems like we blame an umpire for a bad call without ever attempting to understand why the bad call was made. From the video, it’s clear that McClelland wasn’t directly watching Swisher when Torii Hunter caught Johnny Damon’s fly ball, but no one, not even FOX announcers Tim McCarver or Joe Buck, even bothered to explain why he wasn’t looking at Swisher. Back in October, I found a possibility as to why McClelland blew the call, and I will walk you through my reasoning here.

1. McClelland’s Positioning

Note: I have worked two summers as a baseball umpire for a middle school league. I understand that middle school children and professional athletes are very different, but I still had to learn positioning for certain plays, similar to the MLB umpires. During tag-up plays, I’ve been taught to line up the runner and fielder such that I can see both when the catch is made and when the runner’s foot leaves the base. Basically, this is exactly what you’d expect.

From the video I posted above, if you time when Damon made contact to when Hunter made the catch, it’s about 3.75 seconds. Now, I assumed that McClelland hesitated before making an attempt to get into a position to accurately watch Swisher’s tag because he had to decide on an appropriate reaction to the batted ball (similar to a fielder deciding what he has to do to field a batted ball). This is understandable because a person cannot be expected to know where or if a batted ball is going to be caught the very instant it is hit. Therefore, I assumed that it took McClelland about half a second to decide where the ball was going to land and if it had a possibility of being caught, so he should have had about 3.25 seconds (3.75 seconds of ball flight – 0.5 seconds of hesitation) to react.  However, it’s tough to estimate this time because we don’t know exactly what he was thinking when Damon first made contact.

2

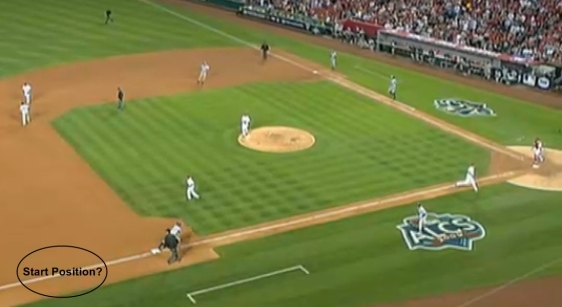
As for his starting position, it is virtually impossible to know where McClelland started because there isn’t any video I found that showed where he was at the beginning of the play. However, because of the rarity of a pickoff attempt at 3rd base and he was still in motion when Swisher left 3rd, I decided that he wasn’t close to the base when the play started. So, another assumption I made was that he was probably a distance from 3rd base that roughly mirrored the positioning of the 1st base umpire when Damon put the pitch into play.

The fact that McClelland was moving when Swisher left 3rd base poses a question: Why wasn’t he in position yet?

A. He hesitated longer than the 0.5 seconds I assumed and he didn’t move fast enough to compensate.

B. His hesitation was close to my 0.5 second estimate, but he was slow in moving to his position.

Look at the picture above again. The center of the oval where I think McClelland started to where he ended up at the time of Swisher leaving 3rd is roughly 1/4 the distance of the basepaths, or about 22.5 feet. Now, from my quick Google research, I found that the average walking speed is about 3 MPH and the average jogging speed is about 6 MPH. Accounting for McClelland’s age, I decided that his jogging speed was about 4.5 MPH. Doing the math, he should have taken about…

(4.5 mi/hr) x (1 hr / 3600 sec) x (5280 ft / 1 mi) = 6.6 ft/sec

22.5 ft / (6.6 ft / sec) = 3.41 sec

…to move from where he started to where he ended, which is very close to the 3.25 seconds I estimated earlier. So, I’m willing to bet that the correct answer was closer to B than A; he hesitated an appropriate amount of time, but didn’t move fast enough to get into position.

McClelland certainly could have gotten into a better position like I mentioned above, but only if he moved at a faster speed. However, from all of us watching many games, I’m sure we can all agree that umpires are not the fleetest of foot and rarely, if ever, even appear to move at a fast jog. I bet a jog for McClelland is probably a slow jog for the average person. Therefore, I think our answer evolves from B into a C that I didn’t even consider listing:

C. He did nothing wrong. The play just happened too fast, so he was in his best possible position.

2. McClelland’s Vision

No, I’m not recommending that he needed glasses (even after wrongly calling Cano safe at 3rd in the same game). Tim McCarver emphatically stated how McClelland wasn’t directly looking at Swisher, which caused his error in judgment. But what I couldn’t believe was that McCarver, nor Joe Buck, nor anyone else not even related to the FOX broadcast made any mention of peripheral vision in relation to this play. For this analysis, I found that this organization states that normal peripheral vision is about 180 degrees. Examine the following two pictures:

25

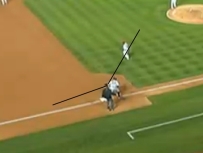
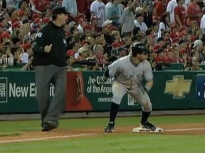
As you can understand, a person’s peripheral vision should decrease as he/she gets older, so I accounted for this by showing McClelland’s as being less than 180 degrees in the picture on the left. I know that I subjectively picked where the two lines are, but they are not intended to be exact nor did I even know what McClelland’s vision was like (neither should you), so I estimated that he saw at least part of Swisher before he left 3rd. Now, I’ve already shown that it was probable that the play in real time occurred too fast for McClelland to get into a good position to make an accurate call, so that was probably why he didn’t line up Swisher with Hunter when the catch was made. The picture on the right shows Swisher leaning forward in anticipation of leaving 3rd base. Once he started leaning, I think McClelland assumed that Swisher was off the base, and thus thought that Swisher had left the base before the catch was made. If the time of ball flight had been longer, McClelland could have gotten into a better position, and he most likely wouldn’t have wrongfully called Swisher out.

In review, I found that the time between when Johnny Damon made contact with Scott Kazmir’s pitch to when Torii Hunter caught Damon’s fly ball occurred too fast for Tim McClelland to properly move into position to line up Nick Swisher at 3rd base with Hunter in center field. With the probability that McClelland had declining peripheral vision, just like many people his age, he saw Swisher lean forward out of the corner of his eye, and thus thought that Swisher left the base much earlier than he actually did. Together, I feel that McClelland did the best that he could in making the correct call, but the play simply happened too fast for him.

Even if you feel that I made too many assumptions here, my main point of this article was for you to learn to understand why an umpire made a certain call before jumping to conclusions that he was out to get a certain player or team, or that he’s incapable of being a good umpire in MLB. You don’t need to go into as much analysis as I did here, but you can at least watch some replays on TV and see if they hint at why an umpire made a mistake. Umpires are not “out to get” particular teams or players. I want you to believe that these guys really are trying the best they can.

This article was originally posted on Off The Mark in October 2009. Portions of the article were rewritten for cohesiveness and relevance to the present.


The Year of the Pitcher? A Holistic Analysis

Thus far, the Year of our Sport 139 — or the Year of our Lord 2000 and 10 — curious whispers have grown to sly murmurs, and in unity they portend: the Year of the Pitcher. Already, fans have indulged in the sight of two perfect games and a third de facto perfect game. By contrast, this time last season, we fans were discussing Albert Pujols’ interminable Power and Joe Mauer’s surprising Pop, all the while swirling the snifter of Slugging; but this year, tales of a Resurgent Carlos Silva and the dazzling Kid Stephen Strasburg have seized our headlines. This, the media assures us, is the Year of the Pitcher.

But is it? Perhaps it is the year of the Pat Burrell — the aging slugger — or perhaps the year of the missing needle? One thing is certain: Our teams are scoring fewer runs. The 2010 MLB’s runs per game has reached pre-Clinton lows:

Of course, taken with a tankard of greater perspective, this recent descent does not appear too outrageous. It in fact puts us closer in line with historical performances:

Read the rest of this entry »


Larry Rothschild and Strikeouts

The legend of Dave Duncan is well known.  Pitcher A stinks and is released by his current team.  The Cardinals sign Pitcher A and he miraculously becomes a good pitcher.  Dave Duncan’s effect on these pitchers can be seen in the groundball rates.  Another NL Central pitching coach has a similar effect on pitchers’ strikeout rates.  Every year from 2001-2008, Cubs’ pitchers led all teams in strikeouts.  In 2009 they finished tied for second.  The northside pitching staff has seen plenty of turnover throughout those years, but the one thing that hasn’t changed is Larry Rothschild.  He has been the Cub pitching coach since 2002.

So does Rothschild really have an impact on his pitchers’ strikeouts.   To find out I compiled a list of all pitchers the Cubs acquired from outside the organization between 2002 and 2010.  According to the Sabremetric Library, K/PA becomes reliable after 150 batters faced.  After limiting my list to only pitchers who faced 150 batters as a Cub, I found their K% before they joined the team and during their time with Rothschild.  Here is the list.

Pitcher          K% Before    K% After    Difference
Matt Clement       17.60%       23.20%      5.60%
Antonio Alfonseca  14.70%       17.90%      3.20%
Shawn Estes        17.90%       14.70%     -3.20%
Mike Remlinger     22.30%       24.80%      2.50%
Greg Maddux        17.20%       15.50%     -1.70%
Glendon Rusch      16.70%       17.20%      0.50%
Latroy Hawkins     14.70%       19.90%      5.20%
Kent Mercker       15.60%       22.90%      7.30%
Ryan Dempster      18.00%       21.10%      3.10%
Jerome Williams    14.70%       12.30%     -2.40%
Bob Howry          20.30%       21.00%      0.70%
Scott Eyre         17.00%       23.60%      6.60%
Ted Lilly          19.60%       20.60%      1.00%
Jason Marquis      13.90%       12.60%     -1.30%
Neal Cotts         19.90%       22.70%      2.80%
Rich Harden        23.30%       29.10%      5.80%
Aaron Heilman      20.40%       20.80%      0.40%
Kevin Gregg        20.80%       23.80%      3.00%
Tom Gorzelanny     14.80%       23.70%      8.90%
John Grabow        20.50%       15.30%     -5.20%
Carlos Silva        9.80%       17.30%      7.50%

Only 5 out of the twenty-one pitchers in the list saw their K% decrease under Rothschild.  I assume Maddux didn’t learn anything he didn’t already know.  Clement, Gorzelanny, and Silva are the big ones.  Clement’s three best years were with the Cubs, and Gorzelanny and Silva were borderline major leaguers when they arrived in Chicago.  Even though he had Kerry Wood, Mark Prior, and Carlos Zambrano during the strikeout streak, we need to give Larry Rothschild credit for his influence on the high strikeout totals.


Strasburg’s Debut vs. 29 Other Clubs

What if Stephen Strasburg had debuted against a team that can actually hit? In what should strike anyone as a ridiculous criticism, there have been a few people to point out that Strasburg didn’t exactly face a “real” major league line up in his record breaking major league debut. (A friend of mine joked that he made his 7th AAA start on Tuesday.) Yes–record breaking. I’ll add to Jack Moore’s point: Since 1920, only there have been only 67 games in which a  pitcher has struck out 14 or more batters and walked none. Strasburg’s outing was noteworthy because his is the only one in which that happened with 24 or fewer batters faced. Given that only 66 other pitchers have ever done something like what Strasburg did in his debut, the level of the team he faced seems like a pretty trivial point. This was dominance like we rarely ever see.

Nevertheless, what if Strasburg had faced a “real” line up in his debut? One of the beauties of sabermetrics is that we get to have this argument with math. If, against a real line up, you think he would have looked ordinary and I think he would have looked pretty amazing, we can set aside arbitrary opinions, lay out some points of agreement, and use our calculators to answer the question. Well, that’s a stretch. But at least we can get a sense of the significance that the Pittsburgh lineup made.

Strasburg was obviously on last night. Did he bring his best stuff? Maybe. What we saw last night wasn’t his true talent level. Nobody is that good consistently. Let’s call the talent level Strasburg brought to his debut his instantaneous talent level. That instantaneous talent level faced was in the run scoring environment that the Pittsburg Pirates create. The comination of the two was a .194 wOBA.  Sabermetrics gives us a tool for calculating match-ups known as  a log5 calculation. If we assume that a .298 wOBA is the Buc’s real talent level, we can isolate Strasburg’s instantanous talent level and give the most rational possible answer to the question “what if he’d faced a real line up?”

I’ll cut to the chase and save you some algebra: his instantaneous wOBA-against was .218.

Going back to our log5 calculations, that means the Yankees, if they brought their MLB leading .361 wOBA to face Strasburg last night would have wOBA’d .248. That’s something like the Astros without Lance Berkman or Hunter Pence.

Here’s the same calculation for every other team in the league.

Yankees		0.243
Red Sox		0.240
Reds		0.234
Brewers		0.227
Tigers		0.226
Twins		0.225
Blue Jays	0.223
Rays		0.223
Braves		0.222
D-backs		0.220
Rangers		0.219
Cardinals	0.219
Phillies	0.219
Rockies		0.219
Royals		0.217
Nationals	0.216
Dodgers		0.216
Cubs		0.215
Marlins		0.213
Mets		0.213
Angels		0.212
Giants		0.212
White Sox	0.210
Athletics	0.210
Padres		0.202
Indians		0.202
Orioles		0.196
Mariners	0.195
Pirates		0.194
Astros		0.182

Anyway, we’ll never know what St. Stephen would have looked like against one of 29 other clubs on June 8th, 2010. That’s not the point. The point is that we witnessed one of the great pitching performances in the history of baseball. It was dominance. This post sheds a little light on what dominance means.


The Nationals’ Unique Fanbase

Tom Verducci, in a recent article on Bryce Harper, mentions that the Nationals averaged only about 12,000 households viewing each home game last season.

It occurs to me that the Nationals may be the only team in the country where the “fan base” is more likely to go to a game than watch it on TV.  After all, the Nationals to a certain extent positioned their new stadium as a prime location for D.C. power players to have business meetings and discuss the future of our Great Nation.  Of course, the Nationals have not been putting a great product on the field of late, which will diminish any team’s fan base.  But the Nationals’ current path, of increasing respectability borne on the back of several marquee names (Strausberg, Zimmerman, Zimmermann, and now Harper), is precisely the sort of attention-grabbing roster construction that would make an afternoon ballpark business meeting trendy.  Perhaps more than any other city, the Nationals have access to a unique demographic, one with money to spend but questionable rooting interest in the team.

To investigate this, I found stadium attendance and TV ratings from the 2009 season.  The bigger the ratio of game attendance to TV households, the larger the percentage of assumed fan base attends games:

The Nationals were the only team who averaged more fans in the seats than households tuning into the game (the shocking part of this is that their TV ratings were up 67% over 2008).  The Yankees and the Red Sox, as expected, were at the bottom.  The Marlins and Rays both had two different cable networks (FS Florida and SunSports) showing their games, which increased their household viewing numbers.  The Braves’ large number is due to their TBS days and two cable networks (FS South and SportSouth).  The source I used did not have television numbers for the Blue Jays.

There are a couple of factors likely working against the Nationals here.  One is that they are a recently-transplanted franchise which has not had the opportunity to build deep roots in its new city.  The team that arrived in Washington in 2005, and the stadium in which they first played, did them no favors.  Nevertheless, no other team comes even close to the Nationals’ ratio.

I’m no economics major, but these numbers seem to suggest that certain teams are pricing their tickets appropriately.  The Athletics and the Nationals’ average 2009 ticket prices, $24.31 and $30.63 respectively, resulted in the highest ratios of game attendance versus TV audience.  In those cities, it seems, ticket prices are encouraging fans to watch games in person.

There is another interesting aspect to this data.  Much has been written recently about how a new stadium no longer “saves” a team.  Baltimore and Cleveland’s new stadiums in the 1990s ushered in many years of big crowds and increased revenue.  Writers have pointed to Pittsburgh and indeed Washington as examples of how the novelty of a new stadium is wearing off faster these days.

Yet look at Baltimore and Cleveland.  They rank 4th and 9th respectively in ratio of game attendance to television audience.  Their beautiful ballparks are still saving them from an even more precipitous decline in fan base interest.

Sources: 

tv numbers: http://www.sportsbusinessjournal.com/article/63798

attendance numbers: http://espn.go.com/mlb/attendance/_/year/2009

A version of this article first appeared on my blog.


A Proposal for Replay in 30 Seconds or Less

You probably already know why I’m writing this post (but if you’re reading this in 2014, Armondo Gallaraga was robbed of a perfect game in the 9th with 2 outs on 6/2/2010.)

Replay gets discussed a lot these days, and there are those in favor of it and those against it. The main reason for it is that replay is more accurate than an umpire, which has been demonstrated over and over again. There are two reasons against it. One is the tradition of umpires, the other is that it will slow down the game. As far as I can tell, it’s futile to argue with people when they love the tradition enough: if you’re sufficiently committed to tradition, no other value will persuade you to give up your stance. I don’t share that love of tradition, but I won’t enter a futile argument here either.

The lost time due to replay is different. We can count seconds and we can try to balance lost time with increased accuracy. Moreover, as technology improves the amount of time lost rewinding tapes and whatever else they had to do in the NFL in the 1980s goes away. So, theoretically, 100% of time used for review is actually spent making a decision. How much time is worthwhile? We’d have to have a discussion about that, but I’m going to throw out 30 seconds. If we could have 30 second replay, it would be worth it. A controversial call on the field typically takes more than thirty seconds anyway, because umpires huddle (but never change the ruling) and managers come out on the field and argue the call (which never has any effect except to get the manager removed from the game.)

Still, it takes a long to time review the play from every angle to come up with the best judgment that the video evidence supports. You just couldn’t do all the work necessary in 30 seconds, so it looks like we’ll have to settle for a longer review time or sacrifice the accuracy we desire.

That is a mistake. The reason replay takes so long is that we think that the goal is to produce the best judgement that the video evidence supports, using time the way we should in a courtroom, where no minute is more valuable than the freedom of the innocent-but-accused. The reviewer must check the play from all angles. He must double check it. He must confer with other reviewers for their opinion, and then come to a consensus. It’s an inefficient system, which in criminal trials is fair and good, but it’s not good for entertainment.

Replay doesn’t have to be a courtroom. Give five reviewers access to all the available video. Give each 30 seconds to decide what the call should have been. Then the vote. They don’t talk about it, they just vote their own best judgment. No changing the vote once cast. The majority rules the day. Suppose for a moment that there is a .75 probability that each of them makes the right call. Then the probability that the majority is correct is .896. (Binomial distribution probability.) Such reviewers would botch the call (as a group) just 1 in 10 times. Furthermore, in the preponderance of replay cases, video evidence is completely clear cut and it takes less than 30 to make a determination that’s right with a probability of 1.

This 30 second replay system would eliminate the vast majority of all erroneous calls in baseball. It wouldn’t be a fail safe system. It would require that we abandon our standard of having evidence that fully justifies our conclusions to all so that no one could come to a better conclusion on the basis of the evidence. But we shouldn’t let perfection be the enemy of the good. And it’s a good thing to preserve perfection.