Is Pitcher BABIP All Luck?
This article was originally published on Check Down Sports.
For those of you who have been reading baseball content at Check Down Sports semi-regularly, you’ve probably seen one of us talking about players and teams we think are performing at a level far from expected.
A lot of times when attempting to explain the reasoning behind abnormal pitching performance, we cite a few reasons, and then attribute the rest to good or bad luck. Luck we usually associate with a batter’s batting average on balls in play (BABIP), which is agreed upon by most as beyond the control of the pitcher.
The influx of ball-tracking systems in MLB has allowed for a boatload of new measurements that, until a few years ago, were only dreams in the minds of analysts and evaluators. One of those — the velocity of ball exiting the bat (exit velocity) — is a popular, yet informative piece of data.
Intuitively, it makes sense that the softer the ball leaves the bat, the less likely the ball should result in a hit. A pitcher who suppresses exit velocity should allow fewer batted balls to become base hits than a pitcher who gives up a high exit velocity. Yes, bloops and seeing-eye ground balls will find open space, but on average, I think this assumption makes sense.
But thanks to Statcast and baseballsavant.com, this assumption doesn’t have to be an assumption at all. We can test it out.
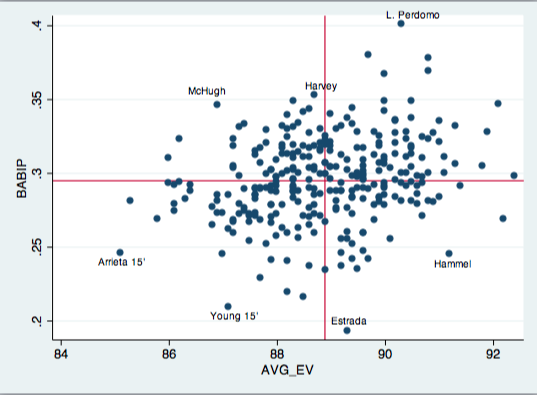
Baseball Savant has exit-velocity data since the beginning of 2015, so that’s where I started. I gathered average exit velocity against for pitchers with at least 190 batted-ball events in 2015 and 2016 (298 total). I then got the BABIP for those pitchers in those seasons from FanGraphs. Next, using STATA, I ran a simple linear regression with the two variables. Results are shown below.
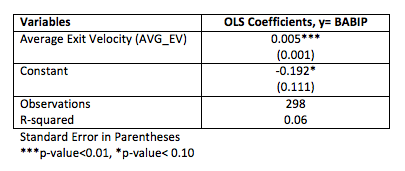
The scary math-stuff explained:
- A pitcher’s BABIP isn’t entirely caused by luck
- Exit velocity has a minor, yet significant, effect on BABIP
- 6% of a pitcher’s BABIP can be explained by exit velocity
- If a pitcher decreases his average exit velocity by 1 mph his BABIP will decrease by 0.005 points, on average (i.e. a pitcher decreases his average exit velocity from 90 to 89 mph — his .300 BABIP would fall to .295. In turn, this would lower his ERA)
- The bottom-left quadrant is ideal. Though, because of exit velocity’s small effect on BABIP, probably not sustainable. We’ve seen Arrieta and and Chris Young come back to earth a bit in 2016
- The top-left quadrant includes candidates for improvement in the second half of 2016 or 2017. Pitchers here have been unlucky in terms of BABIP. Their exit velocities suggest they should have a lower BABIP, and, therefore, ERA
I dunno, that’s a pretty massively scattershot data. Reminds me of the infamous “bee flying through data” graph:
http://www.thejabberwock.org/blog/2/roubik2.gif
I’ll buy that some of the absolute worst BABIP’s match up with the hardest exit velocities, but I don’t see any grand trend here.