Dusty Baker and Pitch Counts
Over the first week of my new blog, I’ve made a number of posts about Dusty Baker’s handling of Reds pitchers. I suggested that I thought Baker has done a better job of managing the workload of his starting pitchers this year. In that same post, I noted how Reds pitchers exceeded 110 pitches only five times at that point this season, and that after each such occurrence the starter was given an extra day of rest before his next start. The next day, he left Johnny Cueto in to throw 113 pitches in the fourth game of a twenty-day stretch with no off days. I then speculated that having Cueto throw so many pitches might cost the Reds before the stretch was over. Cueto had to leave his next start early with a blister. Then, of course, there is Homer Bailey. Yesterday, Bailey left his start early, and I pointed out that Baker has not been as careful in his handling of Bailey -particularly last year – as he has been with the other two youngsters in the rotation: Johnny Cueto and Mike Leake. Today, Bailey went on the DL with shoulder soreness. So, is Dusty managing the starters’ pitch counts better or not?
To help understand, I put together this chart (with data pulled from fangraphs).
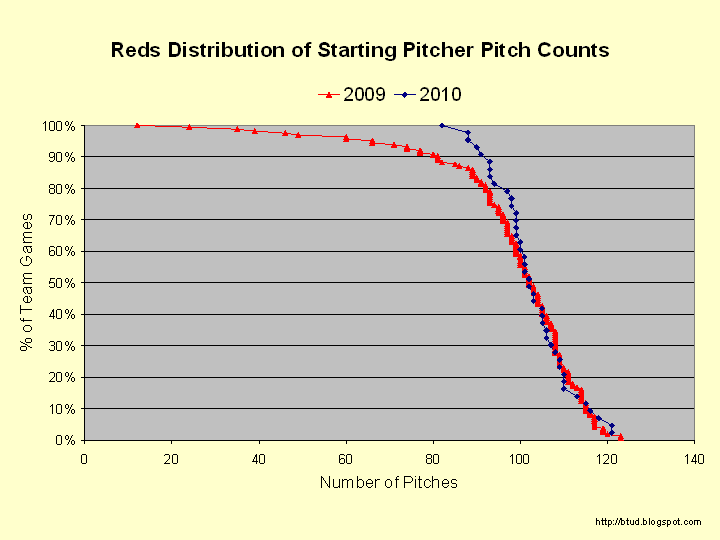
The chart shows the percentage of team games in which the starter pitcher threw at least the number of pitches on the x-axis. So, in 2009, Reds starters threw 80 or more pitches nearly 91% of the time. In 2010, the fewest pitcher a Reds starter had thrown in a game was 81 pitches. (I pulled this data the day before Homer Bailey’s injury forced him out early.) This chart makes clear that the 2010 Reds are not having as many low pitch count outings as the 2009 team. Low pitch count outings are driven by the injury bug and by ineffectiveness. The 2010 Reds have been generally healthy, Bailey’s injury notwithstanding. Plus, the 2010 Reds are in contention and have been pitching relatively well of late, so it stands to reason that they’ve had relatively few ineffective outings. It also doesn’t hurt that it is still early in the season before arms wear down.
While the factors mentioned above explain the low pitch count disparity between the 2009 and 2010 Reds, the manager makes a move in those cases out of necessity. What is more interesting are the high pitch count games, where the manager determines the pitcher has done his day’s work. Reds starters are being called on to throw between 103 and 113 pitches slightly less frequently than in 2009, but they are also throwing 118 pitches or more with greater regularity (albeit with a very small sample size). So, is Dusty abusing his rotation? It depends on where you draw the threshold for what constitutes overuse.
For comparison, let’s see how other teams are handling their starting rotation. First, here are curves for each MLB team in 2009.
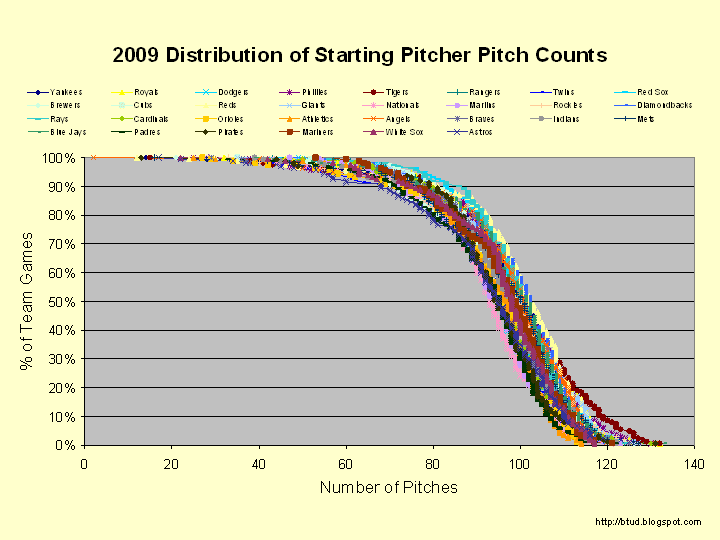
A few features jump out here. First, Astros starters (blue x) managed to get to 80 pitches only 23% of the time. That was considerably less than any other team. Second, Nationals pitchers (pink triangles to the left) reached the magical 100 pitch mark only 24% of the time, while the Diamondbacks (royal blue to the right) reached it a league-high 59% of the time. Finally, and most interesting of all, is that Tigers starters (maroon diamonds at the bottom right) were called on to throw more than 110 pitches with significantly greater frequency than any other team. Maybe Rick Porcello isn’t striking anyone out because his arm is about to fall off. 🙂
So, is 2010 any different?
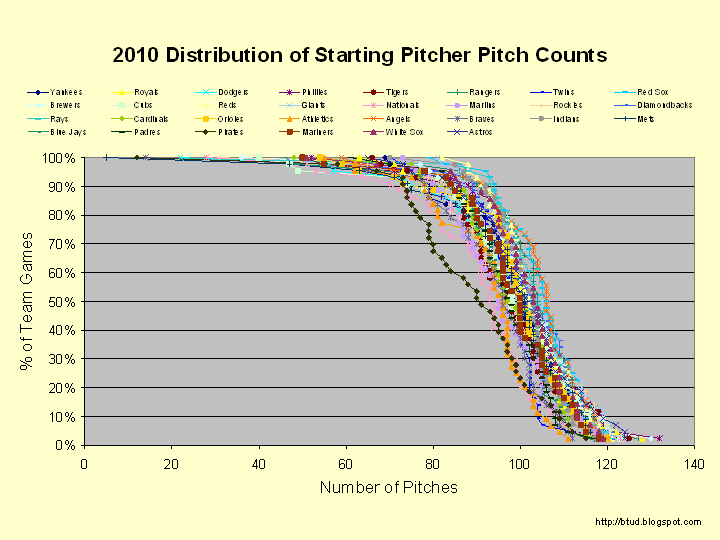
Boy, is it! Pirates starters (green diamonds) have made it to 90 pitches just 53% of the time. I had to look it up to make sure there wasn’t an error in my script. It is, in fact, correct. Other than Zack Duke and Paul Maholm, no one has been able to get to remotely deep into games with any consistency at all. Also of note is that pitchers are generally having fewer low pitch count games in 2010 than in 2009. This can be seen because the top half of the curve is generally to the right of the top half of the 2010 curve. I assume this difference is because of the fatigue that shows up as a season wears on. This trend even hold true in the high pitch count games, although it isn’t as clear from this chart. In 2009, just four teams had starters throw more than 115 pitches in 10% of their games. They were the Tigers (17%), Giants (12%), Royals (12%), and Reds (12%). In 2010, there are 13 teams whose starters have thrown 115 or more pitches 10% of the time. That group is led by the Rockies (19%), and includes the Giants (17%), Angels (16%), Astros (14%), Tigers (14%), Phillies (14%), Rangers (14%), Red Sox (14%), Brewers (12%), Dodgers (12%), Reds (12%), Cubs (11%), and Diamondbacks (11%).
By this measure, Dusty Baker is still working his starting rotation pretty hard but not any more than he did last year. Maintaining the status quo is still better than much of the rest of the league at this point in the season though, so maybe we should cut him some slack and see how the season plays out.
Putting the graphs in FanGraphs.
Astros starters (blue x) managed to get to 80 pitches only 23% of the time. That was considerably less than any other team. (sigh)
Yeah, sorry. I didn’t type what I meant. They managed to throw 80 or more pitches only 77% of the time. I’ll see if I can edit that.
That was also sloppy to say that it was “considerably less” than any other team. The Padres and Brewers were the next least frequent to go beyond 80. The Padres starters threw 80 pitches or more in 79% of their games, and the Brewers threw 80 or more in 80% of their games. The Astros had 37 games where they failed to get beyond the 80 pitch mark, the Padres had 34, and the Brewers 32. Out of a whole season, 3 games difference doesn’t amount to much, I suppose.
Of the Astros 37 games where they failed to get beyond 80 pitches, Brian Moehler started an incredible 11 of those games, Mike Hampton added 6, and Roy Oswalt added 5 (including outings of 17 and a 22 pitches in which he allowed no runs).
Yeah, if I can edit it at this point, I don’t see how. I’ve updated it on my blog though. http://btud.blogspot.com/2010/05/pitch-counts.html
Thanks for the catch.
This is a really nice way to visualize pitch count distribution, as opposed to average pitches, thanks!
I also noticed the trend of managers seeming to push their starters harder this season:
http://www.statspeakblog.com/2010-articles/may/pitch-counts-schmitch-counts.html
Hi there,
I like your post and especially your graph (got their from your red reporter comment on my reliever article.
I’m not sure I agree there’s significant cause for concern. The distribution seems to only depart from the previous season in games in which pitchers throw below 100 pitches. I know there’s nothing magical about 100 pitches, but I’m not particularly worried about starts below that number either. Maybe the Reds are just getting better (longer) appearances from their starters this year? My primary concern are appearances (and especially multiple appearances in a row) over 120 pitches (like Halladay being allowed to go 132 last week!). Dusty gets over 110 regularly, but 120+ pitch counts are pretty rare with him.
-j
And….re-reading, I see that was more or less what you concluded. Sorry, I guess I glossed past your final paragraph.
-j
I have to disagree strongly with your comments about Rick Porcello. At the end of last season, I did a forecast of Porcello for 2010 and my research uncovered that:
“Porcello, at age 20, took a 45 innings pitched leap compared to his 2008 minor league campaign (170 IP in 2009, 125 IP in 2008). This represents a sizable risk, but a pair of factors tend to abate these concerns. Despite posting 170 innings in junior circuit in 2009, Rick Porcello was not among the 150 most abused arms in baseball. Clay Buchholz had a more abused arm and he only pitched in the majors for like fifteen minutes last year. Porcello’s relatively low PAP rating is largely due to the fact that the Tigers did an excellent job regulating Rick Porcello’s workload per game in 2009. Porcello only topped the 100-pitch mark four times in 2009 and only once did he toss over 104 pitches (111, on 9/29).”
So as you can see, the Tigers may have abused their pitchers arm in general, but they were quite careful with Porcello.
Data and quote from:
http://gameofinches.blogspot.com/2009/11/fantasy-outlook-rick-porcello.html
Echoing Jeffrey Gross/David MVP Eckstein, the Tigers didn’t slag Porcello at all. They handled him brilliantly in fact. Great stuff by Mr. Gross, but furthering the point is that Porcello only reached 100 pitches four times and averaged 88 per start in his 30 starts. He’s not striking many out because he relies on groundballs for his primary success and he’s still not unleashing his FULL arsenal on the league. I wouldn’t be surprised if he became a 8-9 K/9 guy in a year or two and held that level for the prime of his career.
If Dusty Baker ever stops working his pitchers hard, we’ll know that his hatred of the Ulnar Collateral Ligament has finally abated. I, for one, do not see that happening so long as he walks the Earth.
Jeffrey and Paul,
You guys are absolutely right. My line about Porcello was not researched and just an off-handed comment in response to the findings about the Tigers. I intend to focus on the Reds on my blog, but since you all raised the point, I’ve added a post on my blog (http://btud.blogspot.com/2010/05/response-to-fangraphs-comments-about.html) that looks at the 2009 and 2010 Tigers use of their starting pitchers.
I concluded that looking at the general team profile to compare teams may not be sufficient, as some players on the same team may well be handled significantly differently. In the case of the Tigers, that’s especially true with Rick Porcello vs. Justin Verlander.
@badenjr
Very good analysis here, well written and intriguing. Just had to point out Porcello’s flaws are not pitch count related, so much as he’s walking to many guys this year. All of his numbers outside of BB/9 are identical
Go cubs, but keep up the good work. I like the blog.
“Pirates starters (green diamonds) have made it to 90 pitches just 53% of the time.”
Just….wow. I love when just one number can tell a whole story. Great article, really enjoyed it.
Thanks! Once the initial appeal of having a blog wore off, I stopped updating it, but it seems like people like this so I might submit a follow-up after the season to FanGraphs here. No promises though.
I wonder if Baker looks at a pitcher’s age, and says… wow, this cat is only 23 so he can easily throw 110 pitches through 7 innings. Not a hater really, but I think the guy isn’t a bad manager. It’s just he has no idea how to bring up young pitchers.
But Justin Verlander, Tim Lincecum, and many others have thrown far too many pitches considering their ages in today’s game(while not crying or getting hurt.) Maybe Baker just had more faith in Mark Prior and K Wood… they were two of the top 10 pitchers when he let them throw too many pitches. Torre is notorious for letting young relievers do this… no one cries. Nolan Ryan says pitchers are babied too often, and that’s the reason they get hurt.
Look at Jake Peavy, Brandon Webb, and other pitchers… they threw too many pitches for how many innings they finished, and where are they? Baker might haunt the dreams of young pitchers like Freddy, but is it totally his fault?