Dusty Baker and Pitch Counts
Over the first week of my new blog, I’ve made a number of posts about Dusty Baker’s handling of Reds pitchers. I suggested that I thought Baker has done a better job of managing the workload of his starting pitchers this year. In that same post, I noted how Reds pitchers exceeded 110 pitches only five times at that point this season, and that after each such occurrence the starter was given an extra day of rest before his next start. The next day, he left Johnny Cueto in to throw 113 pitches in the fourth game of a twenty-day stretch with no off days. I then speculated that having Cueto throw so many pitches might cost the Reds before the stretch was over. Cueto had to leave his next start early with a blister. Then, of course, there is Homer Bailey. Yesterday, Bailey left his start early, and I pointed out that Baker has not been as careful in his handling of Bailey -particularly last year – as he has been with the other two youngsters in the rotation: Johnny Cueto and Mike Leake. Today, Bailey went on the DL with shoulder soreness. So, is Dusty managing the starters’ pitch counts better or not?
To help understand, I put together this chart (with data pulled from fangraphs).
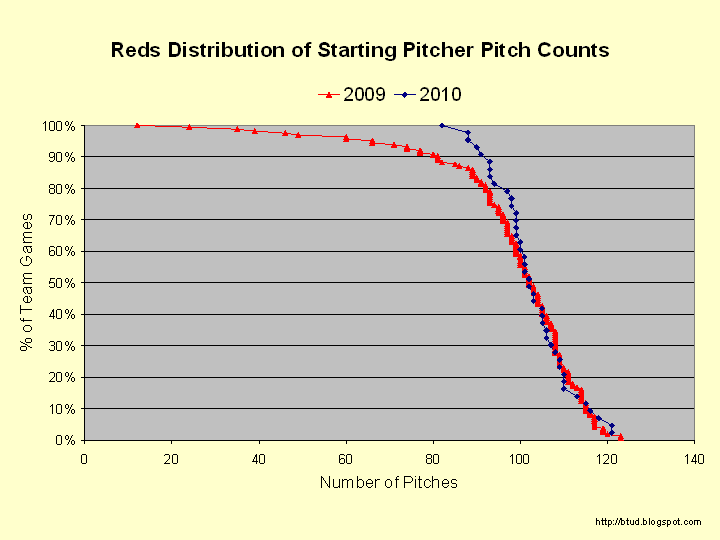
The chart shows the percentage of team games in which the starter pitcher threw at least the number of pitches on the x-axis. So, in 2009, Reds starters threw 80 or more pitches nearly 91% of the time. In 2010, the fewest pitcher a Reds starter had thrown in a game was 81 pitches. (I pulled this data the day before Homer Bailey’s injury forced him out early.) This chart makes clear that the 2010 Reds are not having as many low pitch count outings as the 2009 team. Low pitch count outings are driven by the injury bug and by ineffectiveness. The 2010 Reds have been generally healthy, Bailey’s injury notwithstanding. Plus, the 2010 Reds are in contention and have been pitching relatively well of late, so it stands to reason that they’ve had relatively few ineffective outings. It also doesn’t hurt that it is still early in the season before arms wear down.
While the factors mentioned above explain the low pitch count disparity between the 2009 and 2010 Reds, the manager makes a move in those cases out of necessity. What is more interesting are the high pitch count games, where the manager determines the pitcher has done his day’s work. Reds starters are being called on to throw between 103 and 113 pitches slightly less frequently than in 2009, but they are also throwing 118 pitches or more with greater regularity (albeit with a very small sample size). So, is Dusty abusing his rotation? It depends on where you draw the threshold for what constitutes overuse.
For comparison, let’s see how other teams are handling their starting rotation. First, here are curves for each MLB team in 2009.
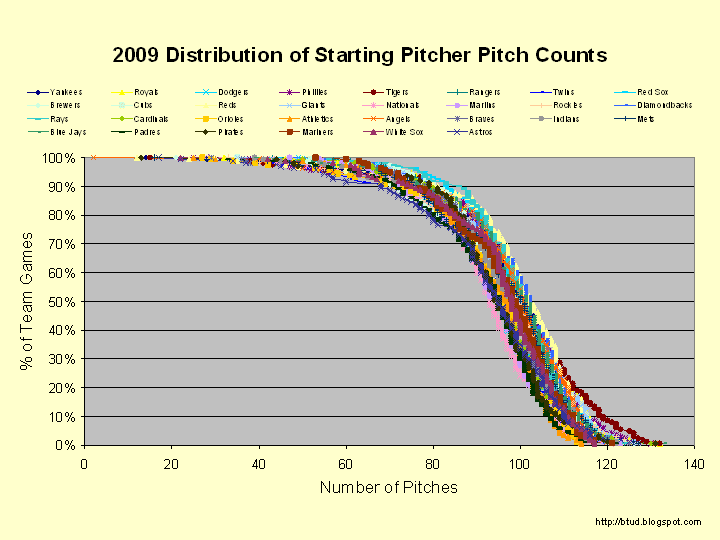
A few features jump out here. First, Astros starters (blue x) managed to get to 80 pitches only 23% of the time. That was considerably less than any other team. Second, Nationals pitchers (pink triangles to the left) reached the magical 100 pitch mark only 24% of the time, while the Diamondbacks (royal blue to the right) reached it a league-high 59% of the time. Finally, and most interesting of all, is that Tigers starters (maroon diamonds at the bottom right) were called on to throw more than 110 pitches with significantly greater frequency than any other team. Maybe Rick Porcello isn’t striking anyone out because his arm is about to fall off. 🙂
So, is 2010 any different?
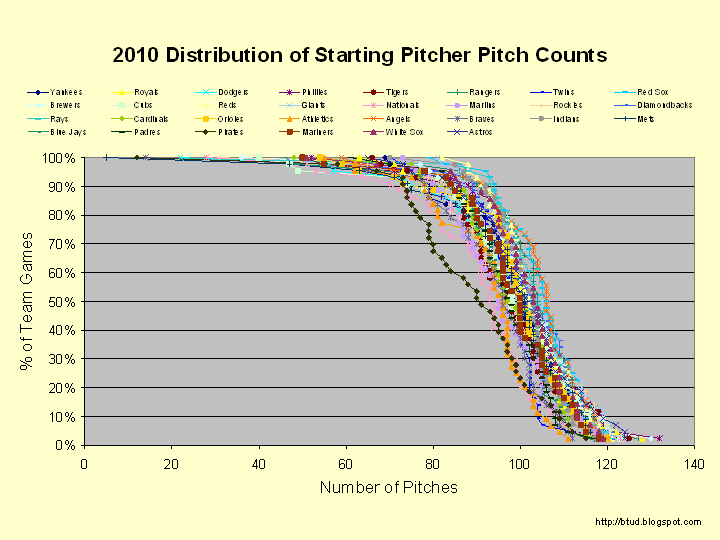
Boy, is it! Pirates starters (green diamonds) have made it to 90 pitches just 53% of the time. I had to look it up to make sure there wasn’t an error in my script. It is, in fact, correct. Other than Zack Duke and Paul Maholm, no one has been able to get to remotely deep into games with any consistency at all. Also of note is that pitchers are generally having fewer low pitch count games in 2010 than in 2009. This can be seen because the top half of the curve is generally to the right of the top half of the 2010 curve. I assume this difference is because of the fatigue that shows up as a season wears on. This trend even hold true in the high pitch count games, although it isn’t as clear from this chart. In 2009, just four teams had starters throw more than 115 pitches in 10% of their games. They were the Tigers (17%), Giants (12%), Royals (12%), and Reds (12%). In 2010, there are 13 teams whose starters have thrown 115 or more pitches 10% of the time. That group is led by the Rockies (19%), and includes the Giants (17%), Angels (16%), Astros (14%), Tigers (14%), Phillies (14%), Rangers (14%), Red Sox (14%), Brewers (12%), Dodgers (12%), Reds (12%), Cubs (11%), and Diamondbacks (11%).
By this measure, Dusty Baker is still working his starting rotation pretty hard but not any more than he did last year. Maintaining the status quo is still better than much of the rest of the league at this point in the season though, so maybe we should cut him some slack and see how the season plays out.