Archive for Uncategorized

Ottoneu Tools: Advanced League Standings

Ottoneu Tools: Advanced Standings (Part One)

Whether you’re brand new to Ottoneu or a “seasoned” veteran in your fourth year, your league’s Standings page is likely to become your best (or worst) friend over the course of a given baseball season. However, if you often find yourself cheering or panicking based on just a few days’ worth of small but evolving linear weights data without the proper, broader context with which to make meaningful decisions about your team, you are not alone. Welcome to the Ottoneu “Advanced Standings” dashboard. The brainchild and early creation of Bill Porter (@wfporter1972), the Advanced Standings dashboard will provide you with the sabermetric performance data you want with the detail you need.

How It Works:

Before you get started you will need to download the current version of the Advanced Standings dashboard here (http://goo.gl/Tozhy4). Note: You will need the most up to date version of Excel to take full advantage of the dashboard features. Also, this Advanced Standings dashboard only works with FGPoints Ottoneu format leagues (for now).

While it may look overwhelming at first, the dashboard is designed to be easy to use. In fact, it’s designed to be updated quickly and often without requiring a lot of Excelmanship. With as little as two easy steps you will be able to see “inside” your league standings in a way not available on the website.

First, go to your league’s traditional STANDINGS page within Ottoneu. From the bottom right of the standings stats (begin just to the right of the last P/IP on the right hand bottom corner), highlight all standings data with your cursor (including team names). Do not export the standings to Excel. Also, do not highlight the headings bar that includes the column titles (AB, H, 2B, etc.). COPY this information and then go to the first tab (“Advanced Standings”) of the Excel dashboard. In cell A4 (1st team name in column), PASTE SPECIAL and select TEXT. When pasted, your league’s standings will populate this tab and you will have visibility of many advanced statistics tailored exactly to your league.

Second, to have more accurate league standings information, go to your league’s REPORT page within Ottoneu and at the bottom of the page highlight all the information (excluding the column headings) in the “Projected Games Played and Innings Pitched” section. Once selected, COPY this information (including team names), and PASTE SPECIAL – TEXT this data into Tab 2 (“Reports”) of the dashboard spreadsheet, in cell A2.

Yeah, it’s that easy.

In Part Two I will revisit some of the key features of the Advanced Standings Dashboard and how it can be best used to analyze your league  You can also learn how to go much deeper into these advanced standings from reading Bill’s recent post on this subject here (http://goo.gl/XkDzXV). Until then, enjoy playing with the dashboard tool. If you have questions or want access to some additional Ottoneu tools, feel free to DM me on Twitter @Fazeorange and I will send you a link to the Ottoneu Dropbox folder.

Enjoy


Beating the Shift (& Physics)

After reading some questions in Dave’s chat today (May 7), and in response to never-ending questioning from un-informed commentators across baseball, I wanted to provide what I think is a very simple explanation for why groundballs are so often pulled. Here goes:

In terms of the direction a ball travels after hitting a bat, there are three factors:

  1. Vertical contact point on the barrel – below the sweetspot of the barrel is a groundball, above the sweetspot is more of a flyball
  2. Horizontal plane at contact – is the bat pointed directly perpendicular to the angle of the pitch and batter’s body, is the batter’s swing out in front, or is he behind?
  3. Vertical plane at contact – is the bat plane directly parallel to the ground, pointing slightly up towards the sky, or pointing slightly down towards the ground?

To start, let’s fix two of the three factors above and leave the third factor as the variable. Let’s assume that since we’re talking about groundballs, factor 1 will be set so that the contact point is slightly below the sweetspot of the barrel, resulting in a groundball. Let’s also set factor 2 and assume the batter squares up the pitch, so that in the horizontal plane his bat makes contact with the ball when it is directly perpendicular to his body. And now let’s focus on factor 3, the vertical plane.

In practice, the vertical plane is already set. Batters (almost*) always make contact with their hands above the head of the bat, so that it is vertically pointing downwards. So given that we’ve set factor 1 to be below the sweetspot on the bat and factor 2 to be square horizontally, we know that the groundball WILL be pulled. Why? Let’s look at it at the extreme to illustrate the point.

Visualize the vertical plane being taken to its extreme, so that the bat is pointing directly downwards. Now, since we’ve set the other two factors in place, we know that the ball will make contact with the bat slightly towards the batters side (which would be below the sweetspot were the bat at a more normal vertical angle). Which way will the ball deflect? Always towards the pull side, and it may actually hit the batter. Now clearly, this is an exaggerated example, because a batter wouldn’t make contact with a ball while his bat is completely vertical. However, the same physics apply when the bat is pointed only slightly downwards vertically, just to a lesser degree. So the point that we’ve established is that there is a structural, physics-based reason that groundballs tend to be pulled, because the bat is (almost*) always pointed slightly downwards at contact.

With that established, let’s take a step back to factor 2. This is the factor which most heavily influences whether or not the groundball will actually be pulled. If the batter is late or behind on the pitch, than in the horizontal plane (factor 2) the bat will be pointed more backwards toward the catcher than if it were exactly perpendicular. In this case, the ball would be pushed the opposite way. On the opposite end of that spectrum, if the batter is early on the pitch and his bat is pointing more forwards towards the pitcher than backwards towards the catcher, the groundball will be pulled more extremely.

So how early or late the batter is on the pitch is clearly an important determinant in whether the groundball will be pulled, pushed, or hit right back at the mound. But remember what we’ve already established – there is a natural tendency for groundballs to be pulled because of factor 3. So if a batter is to take a groundball the opposite way, he must not only be late on the pitch (factor 2), but he must be late enough to overcome the natural pulling force caused by factor 3.  And the more his bat is pointed downwards, the larger that natural pulling force is. The lower and more inside the pitch is, the more the bat will likely be pointed downwards, meaning that the batter must be that much later on the pitch to push it the opposite way.

I’m sure a lot of you will read this and say “duh”, because it is all pretty intuitive and this is FanGraphs after all. But for those of you who have just learned something, any time you ask why a batter can’t just push his groundball away from the shift, remember that he’s having to overcome the natural laws of physics, and, per Dave at 12:58 this afternoon, “it’s not easy to do.”

* All analyses exclude the superhuman skills of Evan Gattis


A Smarter Alternative to Signing Max Scherzer

Max Scherzer has gotten off to a great start in his defense of the 2013 Cy Young Award, but after rejecting a likely substantial contract extension a month ago every time he walks out to the hill is perhaps one less time fans have to see him pitch in a Tigers uniform. It seems more and more likely with each passing day that Mike Illitch, Dave Dombrowski and Co. will not extend Scherzer and will instead let  him test free agency.

After inking Miguel Cabrera to an eight-year extension worth $240 million through 2023 earlier this month, it would seem foolish for the Tigers ownership to try and squeeze another enormous contract onto the roster. If Scherzer were to hit free agency we could expect his contract to fall somewhere around Cole Hamels’ $144 million or Zack Greinke’s $147 million deal, somewhere around $24 million/year. Scherzer could get more, depending on the strength of other free-agent pitchers, amount of years a team wants to give him, and how much Scott Boras whines. That would mean Detroit is committing close to $75 million for three players, a burden for any team. Could there be an alternative, from the Tigers’ perspective, to signing another pitcher about to hit his 30’s to a $24+ million deal?

We know the Detroit organization has been in win-now-at-all-costs mode for years, but they just finished an off-season in which they made a very real effort to get younger and more flexible. We’ve seen a number of teams, the Braves and Rays among them, extend their young players to relatively team friendly deals a few years before they hit free agency. It just so happens that the Tigers have two perfect extension candidates on their roster.

Austin Jackson is perhaps one of the more underrated players in the Major Leagues. He’s been an above average center fielder by both DRS and UZR, an above-average base runner, has slashed .279/.345/.420 in his career good for a .336 wOBA, and been worth 15.0 WAR in just over four seasons with Detroit. He’s in his age-27 season and by all looks is just entering his prime years. Currently, Jackson is playing on a $6 million dollar deal and is due to hit free agency in 2016. If Detroit’s ownership believes he’ll continue to improve his plate discipline — Jackson struck out in 21% of his plate appearances last year although his .77 BB/K ratio is a significant improvement over the .28 mark he put up in his rookie year — and his power (.140 career ISO), then they should seriously think about locking him up sooner rather than later. If new manager Brad Ausmus continues to be more aggressive on the base paths with this team than his predecessor, Jackson could have the 20/20 season a lot of fans were hoping for, which would send his price through the roof if he’s left to test free agency.

When you remember Rick Porcello was a first-round pick in 2007 and the hype around him was such that he was expected to be Justin Verlander 2.0 in the Tigers rotation it’s hard not to be a little disappointed with the outcome of his career so far. When you also remember that he only pitched 125 innings in the low minors, came up at age 20, and has seen his ERA and FIP improve yearly as well as a surge in his strikeout rate and a decline in his walk rate it’s easy to see how he could eventually reach his mid-rotation ceiling. Porcello is still only 25 years old, playing on an $8.5 million deal and, like Jackson, is a free agent after the 2015 season.

An extension for Porcello would give the Tigers a rotation of Justin Verlander, Anibal Sanchez, Porcello, and Drew Smyly for at least three years after 2014. Jackson contributes a middle of the order bat along with premium defense in center field. If Scherzer were to sign with another team, the Tigers could extend both players for at most a few million over what Scherzer would make per year and that would be made up by the $14 million coming off the books from the Torii Hunter contract who is unlikely to re-sign. Instead of committing $75 million to three players, Detroit can commit that to two superstars, two above-average players with the potential to put up some star seasons in their prime, and perhaps another outfielder to cover for Hunter. If the Tigers are really committed to roster and payroll flexibility they will let the reigning Cy Young winner walk and lock up two young talented players entering the prime years of their career.


It’s Time to Lower the Mound…Again

We have seen an incredibly high number of Tommy John (TJ)[1] surgeries undergone already this season. The surgery is on pace to surpass any single-season total in history. This signifies that an unusually high number of pitchers have already gone under the knife and it is still just the first month of the season. Even with so many talented pitchers being sidelined for a season because of TJ, we have also seen league-wide offense falloff quite a bit. There are many reasons for each of these trends, and also many potential solutions, but I feel that the best solution to each problem is to lower the pitcher’s mound. I do not believe pitchers should pitch from a flat surface, which is even with the batter’s level. However, I do believe the mound should be lowered to just 6 inches above the plate. It may seem extreme or irrational, but it has been done before and it would help both issues that professional baseball is facing. One obstacle to finding a way to slow or prevent TJ is the procedure’s high success rate. It is also a difficult problem to solve because it is unclear what causes the injury and when exactly the injury begins. Nevertheless, these should not prevent the MLB from attempting to limit the growing number of pitchers requiring TJ surgery, especially when it can also increase the league’s offensive production.

24 pitchers have needed TJ surgery already in 2014, which has yet to complete its first month of regular season games. For reference, 28 pitchers received the procedure in all of 2013, and only 7 had undergone the surgery at this point last year. It is not surprising to see an increase upon last year’s total, as 2013 was actually a decrease upon 2012’s total of 55 TJ’s for pitchers. However, even in 2012, there were only 15 TJ surgeries by this point in the season. The procedure has been widespread in baseball for some time now, and it has saved many careers, which has made finding a solution unnecessary. Even with the surgery’s outstanding success rate, the time has come for the MLB to step in to protect its players.

Among the many factors that have influenced the increase in TJ surgeries of late is the procedure’s success rate. One study, completed in 2013, found that 83% of pitchers to undergo TJ return to the Majors and 97% return to pitch, at least in the Minor Leagues.[2] This success rate would not necessarily impact players that have a completely torn Ulnar Collateral Ligament (UCL), as they would have no other options to return to the mound, but it may influence pitchers with a partial tear of the UCL. In the past, many of these pitchers would turn to rehab instead of undergoing TJ. Adam Wainwright is a great example of this, as he rehabbed from a partial tear of his UCL, before undergoing TJ surgery 6 years later when he completely tore his ligament. However, because of the success of the procedure, there is little motive to attempt a rehab that may not work, and only delay the surgery, which pushes back the return date. As the Cardinals former team physician and orthopedic surgeon, George Paletta, said, “It’s become an accepted side effect of the job”.[3]

Another reason that is often cited is pitchers are initially beginning to injure their arms in youth baseball. High School pitchers are often pitching in showcases or in front of scouts, which puts extra pressure on them to throw as hard as they can and often pitch even when their arm in not entirely recovered from their previous outing. This was not the case as recently as 15 years ago, as High School showcases did not become common until the early 2000’s. This is one of the early waves of young pitchers that are reaching the Majors after going through the showcase process. From now on, the most, if not all, of the pitchers that reach the Majors will have been through this rigorous process.

Another issue facing young pitchers is that many of them are pitching in competitive games nearly year-round. Overuse is one of the many reasons pitchers experience arm injuries and pitching throughout the year has greatly increased the amount of use on pitcher’s arms. Once, many high school baseball players played multiple sports and were able to take time off from throwing; however, many pitchers now throw year-round without many breaks from throwing. Youth pitchers are also putting more stress than before on their arms because they are throwing harder than ever. This may seem to be a good thing, and it is for performance, but it puts extra stress on their ligament that is not fully developed. Dr. James Andrews says that High School pitchers throwing between 80-85 mph are in particular risk of arm injuries because they are putting too much stress on a ligament that has not developed enough. As Lindsay Berra explains, a pitcher does not rupture his UCL on one pitch:

Strasburg was probably in trouble from the get-go. He didn’t rupture his UCL on one pitch with the Nationals — even if a pitcher feels a pop on a particular pitch, his UCL was anything but pristine before the incident. Like a rope, Strasburg’s UCL probably started to fray the moment he began pitching off a mound, the extra height of which can compound the stress of each pitch. It likely got worse not only because of his mechanics. Kids who throw the hardest pitch the most: they get hitters out.[4]

While it is clear that TJ procedures are increasing, the exact cause of TJ is not clear, as many factors impact whether people require TJ. However, it is evident that pitching off a mound increases the stress put on the pitcher’s arm. Comparing just the number of TJ procedures for pitchers and for position players, it is clear there is a substantial difference. Since the first TJ surgery in 1974, 622 pitchers have undergone the procedure, while only 41 position players have received the surgery. There are more differences than merely the mound, but none of them account for such a large discrepancy between the two types of players.

Another common comparison for anecdotal evidence is pitchers compared to quarterbacks in football. According to a study in 2010, there had been 10 reported instances of NFL quarterbacks with damage to their UCLs, yet only one of these players underwent surgery. The other nine quarterbacks chose to use therapy to repair their injury and their mean number of days until their return was 26.4 days.[5] As with the differences between pitchers and position players, there are numerous differences between quarterbacks and pitchers. However, these differences do not account for such a significant gap between both UCL injuries and TJ surgeries.

Both of these examples contain too many confounding variables to draw any significant conclusions. However, a study completed in 2008 examined the effects that the 10-inch mound has on a pitcher’s mechanics and the stress that it puts on the pitcher’s arm in comparison to a mound at 8 inches, 6 inches and flat ground. The study, led by William Raasch, selected 20 from MLB organizations and Milwaukee-area NCAA Division-1 pitchers. The study found that pitchers throwing from a 10-inch mound compared to pitchers throwing from flat ground experienced extra stress on both their pitching shoulder and elbow.[6] They found that the greatest difference was at foot strike, as the mound changes the timing of the foot strike compared to the position of the pitcher’s arm. This study found that pitchers definitely experience more stress on their arm when throwing from an elevated surface than from a flat surface.

While the majority of this post has been dedicated to the effects the mound has on a pitcher’s health, lowering the mound will also improve the offensive production in the MLB. Of course, when the mound was first lowered to 10 inches in 1969, it was done in order to improve offense. After “The Year of the Pitcher” in 1968, the MLB saw the average runs scored per game increase by .65 in just one season. It is clear that lowering the mound had a significant impact on the league’s offensive output. Once again, we are in need of the mound to be lowered in order to improve the league’s offense. With better pitchers, defensive shifts and, most significantly, more stringent testing for Performance Enhancing Drugs (PEDs), we have seen a sharp drop off in offensive performance.  In 2013, the MLB R/G (4.17) was the lowest it has been since 1992 (4.12). This is not just a single-season aberration, as it has been experiencing a steady decline since 2006, when it was at 4.86. HR/G are also down quite significantly since 2006, when it was 1.11, and were just .96 in 2013. Easily the largest difference between 2006 and 2013 is the increase in strikeouts per game, as they have skyrocketed from 6.52 to 7.55 in 2013. By lowering the mounds, the MLB will be able to improve upon these numbers and return offense back into baseball.

Lowering the mound may seem to be a radical step to solve two things that some people may not seem like problems; however, it is the best of the few options the MLB has. While some will argue that this will not limit TJ procedures because many pitchers are already damaged goods by the time they reach the Majors, this is a change that will soon reach the NCAA, High School and youth baseball leagues if the MLB does it. This will have a profound impact on the number of TJ procedures once these pitchers reach the Majors, as they will have reduced the stress on their arm over a long period of time. The impact will not be immediate in the MLB, but when the next wave of young, talented pitchers reaches the Majors, there will be fewer TJ procedures.

The immediate impact will come from the increase in offensive production, as the lower mound will take away some of the advantage from the pitchers. As I have mentioned above, there are not many appealing alternatives. The most common solutions to the low offensive numbers is to juice the baseballs, similar to what Japan did this past season. While this would certainly improve offensive production and be less costly than changing the mounds, it would not help decrease the number of TJ procedures. A bit more radical of an alternative, that I do not believe could ever happen, is the MLB allowing the use of PEDs. While this would likely increase offense, it would almost force players to take PEDs or else they would be at a disadvantage to the rest of the players that do take PEDs. It is not fair to put athletes in this position, especially when we know how detrimental steroids can be to a person’s health.

Another option is to add a DH to the National League, which has been discussed and is quite possible. However, this also fails to help pitchers avoid TJ. Also, in 2013, the NL averaged just 4.00 R/G compared to the AL’s average of 4.33 R/G. Assuming the NL’s production would match the AL’s, the addition of the DH would add just 802 runs to an MLB season. When the MLB first lowered the mound in 1969, the league scored 2,527 more runs than the previous season and that was with only 24 total teams. By lowering the mounds again, the increase in offensive production would substantially increase beyond where it would with the addition of a DH in the NL. Among these options, I believe the best is to lower the mound to 6 inches above home plate.

The number of TJ surgeries continues to rise and it is time to make an attempt to limit this procedure. The best way to do this is to lower the height of the mounds in the MLB, as this will decrease the stress that pitchers suffer when they pitch. Once the MLB does this, all other levels of baseball will follow suit, just as they did in 1969. The purpose this time; however, will be two-fold, as the lower mound will also serve to take away some of the pitcher’s advantage, and therefore, improve the MLB’s offensive numbers. Knowing what we know about the mound’s impact on a pitcher’s mechanics and the extra stress that it exerts on the pitcher’s arm, we cannot idly watch as more and more pitchers suffer through a year of rehab from a surgery that can be limited.


[1] http://www.baseballheatmaps.com/disabled-list-data/

[2] http://www.newsday.com/sports/baseball/study-shows-pitchers-who-get-tommy-john-surgery-almost-all-pitch-again-1.7621000

[3] http://espn.go.com/mlb/story/_/id/7712916/tommy-john-surgery-keeps-pitchers-game-address-underlying-biomechanical-flaw-espn-magazine

[4] http://espn.go.com/mlb/story/_/id/7712916/tommy-john-surgery-keeps-pitchers-game-address-underlying-biomechanical-flaw-espn-magazine

[5] http://www.ncbi.nlm.nih.gov/pubmed/20609599

[6] http://www.sciencedaily.com/releases/2008/03/080323210203.htm


What Would it Take for Andrelton Simmons to Be the MVP?

Andrelton Simmons is awesome.

If you are reading this article on FanGraphs.com right now, this comes as no surprise to you. And I’m not using “awesome” in the way people use it to describe the latest episode of Pretty Little Liars or whatever vanilla bullshit thing they’re drinking from Starbucks. I’m using it in its literal definition of being awe-inspiring:

awe·some, adjective. inspiring an overwhelming feeling of reverence, admiration, or fear; causing or inducing awe: an awesome sight.

The reason you know Andrelton Simmons to be awesome is because of the things he does in the field while playing shortstop. Here, be inspired by awe:

Awesome.

But he’s not a bad hitter, either. In fact, right now, in 2014, he has been a pretty great hitter. His 146 wRC+ is sixth among shortstops and he has a higher wOBA than Hanley Ramirez. His .268 isolated slugging percentage exceeds Edwin Encarnacion’s mark from 2013, and Edwin Encarnacion slugged 36 dingers that year. In 45 plate appearances, Simmons hasn’t struck out one time. Andrelton Simmons, thus far, appears to be making strides at the plate.

When you’re the best defensive player in the major leagues, you don’t need to do much with the bat to be a pretty great player. Last season, you may be surprised to find out that Simmons, despite not even being a league-average hitter, racked up 4.6 WAR. That total was good for 13th in the National League, right next to teammate Freddie Freeman who finished fifth in the MVP voting and also made a really great stretch in that .gif up there.

Anyway, I’m really starting to bury the lede, although I guess really the lede is right there in the title, which I have to assume you read considering you clicked on it and are now here.

Simmons received a couple of 8th and 9th place MVP votes last season while being a below-average hitter. Simmons, thus far, appears to be getting better as a hitter. Just how much better would Andrelton Simmons need to be at the plate to be the best player in the National League?

Let’s begin:

Intro

First, we need to figure out what our endgame here is. We want Simmons to be the most valuable player in the National League. The average WAR of National League MVP winners over the last four seasons is 7.4. We’re going to see what improvements, in areas other than the field, we can make to Simmons’ game in an attempt to get him to at least 7.0 WAR to get him in the discussion. In order to accumulate the most WAR possible, we’re going to assume that Simmons plays all 162 games and racks up 679 plate appearances for the Braves in this hypothetical MVP season. He played in 157 in his first full-length season last year and figures to play pretty much everyday until something goes wrong. The 679 PA is simply an extrapolation of his 2012 plate appearances.

Batting average

Last season, Simmons batted just .248. Not many people win MVP awards with batting averages under .250. Lucky for Simmons, he appeared to be unlucky. His .247 batting average on balls in play was fifth-lowest of all qualified batters in 2013, and was 50 points less than the league average. We know he isn’t going to sustain a BABIP 50 points less than the league average. However, Simmons does have a flaw in his batting profile that makes him especially susceptible to a low BABIP. He led the MLB with 38 infield pop-ups last season. Infield pop-ups literally never go for hits, so it’s not as easy as just regressing his BABIP back to the league average. His career BABIP is .262 and the league average is .297. Let’s say he cuts into his infield pop-ups a bit and gets a little lucky on grounders finding holes over the course of the season. We’ll meet in the middle and call it .280.

Plate discipline

Simmons’ plate discipline was already the strong suit of his offensive profile and it appears to only be getting better. Last year, Simmons’ contact rate was 87.5%, a top-10 mark in the National League. As I mentioned earlier, he has yet to strike out one time this season, the only starter in the MLB who can still make that claim. Last year, Simmons’ strikeout percentage was 8.4%. Considering his strikeout-less streak to begin the season, we can expect improvement on that number. I’ll side with Steamer on this one, whose updated 2014 projection has him finishing with a strikeout percentage of 7.5%.

As is typical with a player that has such high contact rates, Simmons doesn’t walk much. Why take pitches when you’re one of the best in the league at putting the bat on the ball? Last year, Simmons had a walk percentage of 6.1%. With his improved strikeout rate, we can assume a little bit of improvement in the walk department as well, but not much. We’ll bump it up to 6.5%.

Power

This is the part of Andrelton Simmons’ game that surprised people last season. First, he’s a shortstop, and most shortstops don’t hit for power. Second, he didn’t hit for power in the minor leagues. In 1,042 minor league plate appearances — a little less than two full seasons — Simmons only hit six home runs and never posted an isolated slugging percentage higher than .126. Simmons burst onto the scene last year by hitting 17 home runs and posting an ISO of .149. This year, through 11 games, Simmons has already hit two home runs and his ISO sits at a ridiculous .268.

The power appears to be real and is a result of his approach at the plate, which is unique. Most players with contact rates as high as Simmons — guys like Alexei Ramirez, Erick Aybar or Jose Altuve — make their mark by hitting line drives or hard ground balls that find holes. You usually either sell out for contact by using this approach, or sell out for power by trying to elevate the ball. But not Simmons. Despite having the highest contact rate of any qualified shortstop last season, Simmons also hit fly balls more than almost any other shortstop, giving him the batted ball profile of sluggers like Jay Bruce or Giancarlo Stanton. This allowed Simmons to rack up 17 dingers with a HR/FB% of just 7.9% last year.

His career HR/FB percentage is 8.1%. As he is still in his age-24 season, let’s say he bulks up a bit and is able to muster out 9.0% of his fly balls for home runs in our hypothetical MVP season. With his batted ball profile and improved plate discipline, this gives us 21 HR for Simmons.

Base running

This was also a weird part of Simmons’ game last year, but in the opposite way than the power. In the minor leagues, he stole 54 bases in a little less than two full seasons of service time. He didn’t have an elite success rate (69%), but he clearly has some speed. In 2013, Simmons stole just six bases and was thrown out five times. That is terrible. He only ran 11 times, which certainly has something to do with his poor success rate, but he also wasn’t getting on base at a very good clip last year. With his improved on-base skills in this exercise, he would have more opportunities to run. Let’s say he improves his success rate a bit, too, and racks up about 15 SB.

Last year, Simmons’ baserunning was estimated to have cost the Braves about -1.6 runs. This includes not only steal attempts, but taking extra bases and being thrown out trying to take extra bases on balls in play. If we assume Simmons is a little more efficient at taking the extra base and steals 15 bags while only being thrown out six or seven times, it’s not hard to imagine Simmons’ baserunning score (BsR) going from -1.6 to +1.5. In other words, from very slightly below average to very slightly above average.

Results

Simmons AVG OBP ISO K% BB% BABIP HR/FB%
MVP Simmons .286 .331 .173 7.5% 6.5% .280 9.0%
Career Simmons .261 .307 .150 8.6% 6.1% .262 8.1%

That’s about all it would take. Really, not that drastic of a difference. It’s improvement in every category across the board, yes, but I don’t think there’s a single one of these that couldn’t happen or appears unrealistic for a really good baseball player in his second season in the MLB at age 24.

Convert his offensive numbers into run values and you get a wRAA of 15.2, a BsR of 1.5 (as we stated earlier) and on defense a UZR of 24.6 (his career average). Yes, this assumes that he repeats his ridiculous defensive numbers from last season which likely aren’t sustainable, but he is Andrelton Simmons, after all, and is kind of in unprecedented territory. If he’s done it once before, he can probably do it again. Adjust all of that for position and park and this gives us our magic number of 7.0 WAR.

With the defensive ability that Andrelton Simmons has showcased thus far in his career, he would just need to hit about .285 with a .330 OBP, 20 homers and 15 steals to be in serious consideration for the NL MVP. Consider, say, Andrew McCutchen and Buster Posey have slight off-years where they fail to accumulate at least 7 WAR and see both of their teams miss the playoffs. As long as the Braves make the postseason, Andrelton Simmons could bring home more hardware than just a Gold Glove in 2014.


Does a Velocity *Increase* Also Predict Injury? (A Primer)

Leading into the currently-young 2014 season, one of the biggest stories in baseball was the rash of pitcher injuries — with UCL injuries and Tommy John surgery seeming unusually frequent this year.

For Patrick Corbin’s case, in particular, my immediate thought was “Hm, I recall he increased his velocity last year”… which of course led me to wonder if the velocity increase actually caused his injury in some way.

I don’t know how common this line of thinking is.  So far as I can tell, the discussion of velocity and injury more frequently goes the other way, that a velocity decrease may be the first sign that something is wrong.  Or maybe this is actually a more common suspicion than I realize.  If nothing else, it seems to merit a closer look/increased discussion.

The logic here is simple: for most players, velocity only seems to decrease from year to year (although it may increase within a season).  So when a player bucks the usual pattern and increases velocity between years, you have to wonder what exactly he did.  At least some of the time, guys may be cheating a little (doing something not entirely sound, mechanically) to get that extra “oomph.”  This is of course is where the injury part enters.  If indeed some guys are cheating, maybe it’s only a matter of time before they blow out an elbow (or shoulder).

So can a velocity increase be a sign that a guy’s cheating and thus a future injury risk?  Answering this thoroughly takes some time and effort, more than I can probably spare this week, but I thought I’d at the very least get some reader thoughts.  Eventually I hope to look at guys from many different seasons,  comparing the injury rate of guys who did vs. did not see a notable velocity increase the preceding season.  (I’ll be using this list of TJ patients, which seems fairly complete.  Probably it would be better to add shoulder injuries, too, if someone has a list.)

For those curious, here are the 2012 and 2013 velocities for the five big names of this year’s “Tommy John cohort.”  Unfortunately there’s hardly anything that can be taken away from such a small list.  Harvey and Corbin had velocity increases (consistent with the conjecture), while the others did not.  But Beachy was coming off a previous Tommy John surgery performed in 2012, while Medlen’s 2012 was partially in the bullpen, so it’s not exactly clear what to make of their 2012 vs. 2013 velocities.

Name 2012 velo 2013 velo Change
Matt Harvey 94.7 95.8 1.1
Patrick Corbin 90.9 92.1 1.2
Brandon Beachy 91.0 90.2 -0.8
Kris Medlen 90.0 89.4 -0.6
Jarrod Parker 92.4 91.5 -0.9

(Overall FB velocities in this table.  Maybe it would have been better to just compare 4-seam vs. 4-seam, but I didn’t want to have to worry about composition for now.)

It might be a few weeks before I myself have time for a closer look.  BUT, if anyone else wants to spearhead the effort sooner, please feel free to do so, and I’m of course happy to help.  As always, reader thoughts and feedback are welcome!


What Your Fantasy Settings Say About You, Collectively

On March 31, Eno Sarris posted a RotoGraphs article analyzing what his fantasy settings and preferred players say about him. If fantasy settings were beer, Eno appears to view deep, auction format h2h keeper leagues with the same affection he holds for a High-ABV Pacific Coast Double IPA.

However, most fantasy baseball writing and analysis is tailored to a far more mainstream palate. The “standard 5×5” settings– shallow (10-12) mixed league rotisserie scoring on AVG, RBI, R, HR, SB x ERA, W, K, SV, WHIP–are the Coors Light of the fantasy world.

I created a simple Google Form to poll RotoGraphs readers on our preferred fantasy settings. After about a week and nearly 150 responses, I have first results to report.  With even more data this year–or collected across multiple years– we may be able to identify trends in the way fantasy baseball is played by, if not the public generally, the average RotoGraphs reader.

Original Form available here
Complete Responses are available here

Based on the first 148 responses, 26.3% are only in 1 league for 2014. 62% of respondents are in 2-5 leagues. While there are a dedicated few of us who are in more than 5 leagues, the overwhelming majority is clearly more capable of achieving a healthy fantasy baseball-life balance.

Here is a basic breakdown of the data as of April 4:

Total Leagues: 470
Head to Head: 205
Keeper: 234
Mixed: 403
Deeper than 12 teams: 140
5×5: 176
OBP or OPS instead of AVG: 222
Holds or Saves+Holds: 156
Auction: 158

Bonus Questions (that Eno didn’t ask himself)
Leagues using FAAB: 136
Leagues with Minor League Reserves: 126
Preferred sites:

  • Yahoo!: 67
  • ESPN: 60
  • CBS: 27
  • Ottoneu: 15
  • Other: 11

The primary takeaway, based on results as of this writing, is the number of non-“standard” leagues reported. One respondent is in 17 leagues, and all 17 are standard 5×5 format. That’s great for this sir or madame who is clearly an advocate of the more-is-more approach, but he’s really skewing our poll here by being so far from the mean. If we remove his response, the results show only about 35% of the league settings reported are standard 5×5. More data about the specific settings used, and the demographics of the respondents, would embiggen our collective understanding here. It may be that the responses captured are not from a representative sample of RotoGraphs readers.

But scientific rigor and caution have never been effective barriers when it comes to anonymous website readers providing criticism or opinion. So allow me to extrapolate wildly based on this extremely limited data set:

5×5 is a dinosaur. It is a relic. Dinosaurs and relics are a lot of fun, and can be pretty awesome, and really everyone loves dinosaurs and relics both. Just like most red-blooded humans can shut up and stomach an ice cold serving of the Silver Bullet on a given day, and some days feel refreshed.

There is a type of person, though, who is content to leave dinosaurs and relics in museums, and to tolerate a vent-mouth can of the taste of the Rockies only when it is the last option available in your brother-in-law’s fridge. Let us call this person “the RotoGraphs reader.” He or she is more apt to try a new taste, to reach for something a bit more complex and perhaps even more challenging. The stats represented in the standard 5×5 format no longer represent how this RotoGraphs reader evaluates the baseball player, genearlly. The brand of fantasy baseball she or he plays reflects this. Standard is no longer the standard.

And perhaps, just as the statistical revolution has won in the real measurement of performance for actual game of Baseball, it is on the cusp of a major victory in the virtual game of Fantasy Baseball. AVG and Saves have long been abandoned as helpful or relevant stats by discerning fans and front offices alike. For the RotoGraphs reader these stats are less relevant every day to his or her enjoyment of the fantasy game.

What do your settings say about you? This is the question Eno, in his wisdom, posed to us. Each of us will have individual answers, but collecting those answers can reveal possible answers to a bigger question: what do our settings say about the state of the game?


Baseball’s Biggest Market Inefficiency

A couple years ago, The Oakland Athletics extended the contract for general manager Billy Beane for an additional 5 years, securing him through the 2019 season. They did not release the specific details of the contract, but we can guess that it’s comparable to the $3-4m that Brian Cashman and Theo Epstein make per year. The A’s are paying Alberto Callaspo $4.1m this year. Neither Beane’s nor Callaspo’s salary is particularly surprising, since both roughly reflect the current market for a top-tier GM and a 30-year-old infielder with a career .273/.335/.381 slash line. But is this reasonable? Should the owner of a baseball team be more willing to pay a mediocre infielder than an elite general manager? If the following data on front office success is any indication, absolutely not.

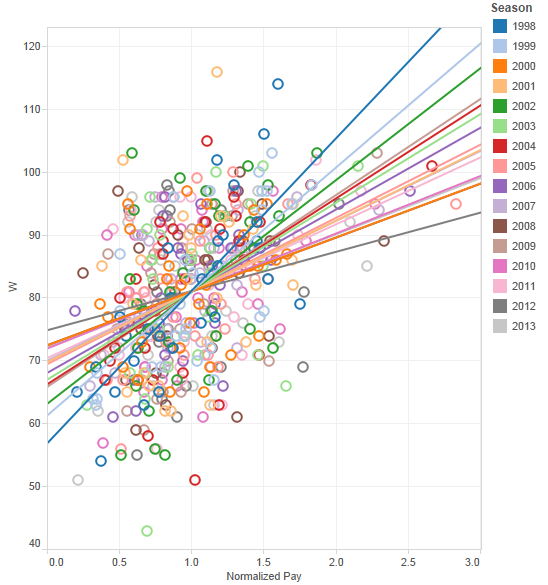
Using payroll data that goes back to 1998, I wanted to compare how well teams achieved success relative to the budgets they were given by their owner. In order to do so, I ran a regression model for every season to determine what sort of an effect payroll had on wins. For each season, the league average payroll is normalized to “1” to allow every season to be in this chart. As the graph shows, teams with more money tend to win more. If you’re adventurous and feel like interacting with the data you see below, click here and mouse over everything until you pass out.

Payroll Regressions

It’s no surprise that money leads to success, and the fact that certain GMs tend to outperform their budget shouldn’t stun you either. But the extent to which some general managers are better than others is enormous. There are plenty of GMs who did exactly what you’d expect given their budgets. In 9 seasons with the Expos and Mets, Oscar Minaya was given the funds to win 742 games. He won 739. Mark Shapiro was supposed to win 703. He won 704.

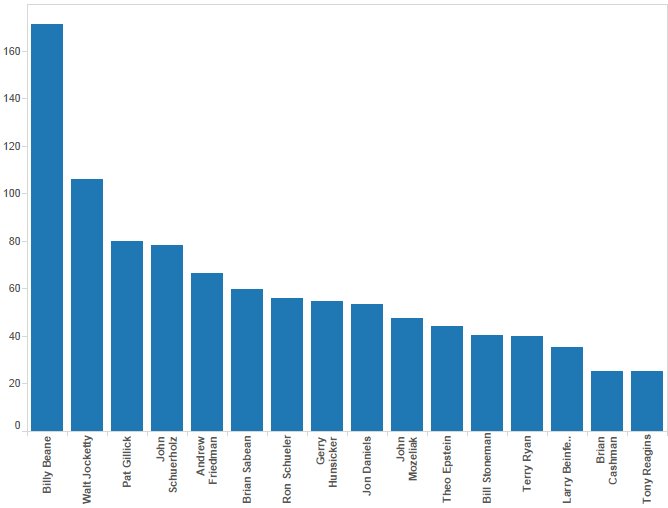
Some general managers have better reputations, though. Theo Epstein, former Red Sox GM and current Cubs President of Baseball Operations, was given the budgets that would have resulted in 795 wins from an average GM, but he turned that into 839 wins in Boston. Legendary Braves GM John Schuerholz led a Braves squad that won 78 more games than expected since 1998, when the data begins. The 2nd best on the list, ex-Cardinals and current Reds GM, Walt Jocketty, has been worth an astounding 106 wins.

Then there’s Billy Beane: the Billy Beane who the A’s are paying slightly less than Alberto Callaspo. Under his direction, the Oakland Athletics have won 171 more games than expected. Babe Ruth had a career WAR of 168. Ruth’s best season was worth an absurd 15.0 wins in terms of WAR. Billy Beane has had 6 seasons during which the A’s won 15+ more games than they should have. They’ve never had the money to win 50% of their games, but half their seasons have ended with 20 more wins than losses.

I could go on. But first, let’s look at some visuals.

Best General Managers

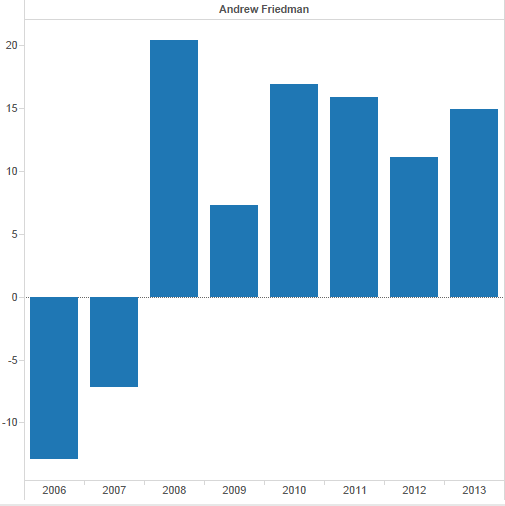
Here are the 16 general managers whose teams have exceeded their financial expectations by over 25 wins since 1998. If you want to look at every general manager’s wins and expected wins, explore this. One name I have not mentioned so far that has had an impressive stint as head of the Rays is Andrew Friedman. Since he’s been the GM of the Rays, they have been tied with St. Louis as the most cost effective winners in baseball. It’s even more impressive when you consider the dumpster fire he inherited.

Andrew Friedman

After ignoring the potential for mediocrity during his first two seasons and building for the future, Friedman’s Rays took off. In the past 6 years, the Rays have won 87 more games than they should have. While it’s not as good as Beane’s best 6-year stretch of 117, it has coincided with a relatively weak stretch for the A’s where they have only exceeded their budget-wins by 30 games.

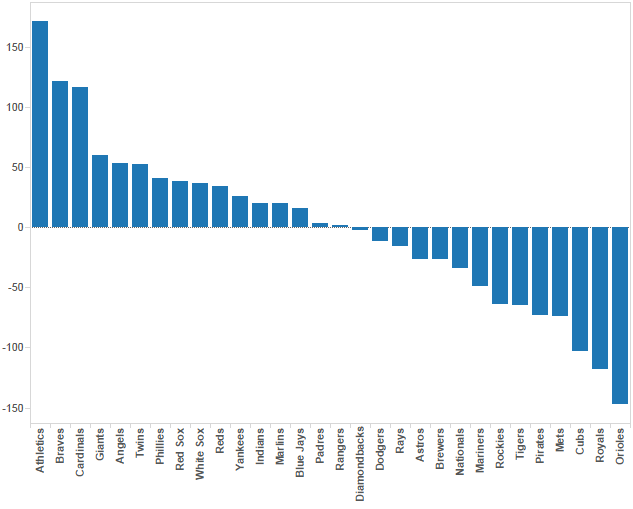
Unfortunately, not every team can have a Billy Beane or an Andrew Friedman. Some teams, like my Royals, have had more struggles. This chart, as much as anything else, shows the overwhelming need for effective front office management.

Team Front Offices

The A’s have been 300 wins more effective than the Orioles the last 16 years. If a win is worth $5m as recent free agency has suggested, then I don’t even want to type how much Billy Beane is worth. If you’re like me, it’s worth your time to explore this chart which shows yearly expectations and results for each team. A couple teams to look for, in addition to the ones I’ve talked about: the Cardinals and Braves have been unsurprisingly excellent, and the Cubs, Royals, and Orioles are worth looking at for less exciting reasons.

So how much should teams be paying their GMs? At this point, that’s an easy answer. $1 more than everyone else will pay, because they are tremendously undervalued right now. After that, the answer isn’t as clear, but I don’t see why they wouldn’t be similarly paid to players. One easy counter argument would be that if you pay the GM too much, he can’t do his job as well because he would have less money with which to pay players. But I think there is sufficient evidence that, for example, the Blue Jays would win more games with the team that Andrew Friedman could assemble with a $97m payroll than their current $117m team. The fact that the Rays will pay $57m this year for their squad should support that claim more than enough.

The free agent market would say that an elite GM could be worth $50-$100m a year. While that might strike people as unreasonable, it’s probably closer to their real value than the replacement level infielder-pay they are receiving now.


Expected RBI Totals: The Top 267 xRBI Totals for 2013

While there is almost zero skill when it comes to the amount of RBI a player produces, through the creation of an expected RBI metric I have found a way to look at whether or not a player has gotten lucky or unfortunate when it comes to their actual RBI total.

I hope I don’t need to do this for most of our readers, because it’s 2014 and you’re reading about baseball on a far off corner of Internet, so you obviously are more informed than the average fan who consumes ESPN as their main source of baseball information, but lets talk about why RBI, as a stat, and why it is not valuable when you look at a players’ talent. The amount of RBI a player produces are almost—we’ll get into the almost a little later—entirely dependent on the lineup a player plays in. If a player doesn’t have teammates that can get on base in front of them in the lineup, there aren’t very many opportunities for RBIs; that’s the long and short. Really, RBI tell more about the lineup a player plays in than the player himself.

Intuitively, this makes sense.  The more runners there are on base, the more chances the batter will have for RBI, and the more RBI the batter will accumulate. When I said, “The amount of RBI a player produces are almost…entirely dependent on the lineup a player plays in”, lets be a little more precise. My research took the last three years of data (2010 to 2013) and looked at all players that had 180 runners on base (ROB) during their at bats over the course of a season. Over the three seasons, which should be enough data—it was a pain in the ass to obtain the data that I did find—ROB correlated with RBI by a correlation coefficient of .794 (r2 = .63169), which is a very strong positive relationship.

But hey, that doesn’t mean that you can be a lousy hitter get a lot of RBI. That would be like if you threw a hobo in the Playboy Mansion and expected him to get a lot of tail; all the opportunity in the world can’t mask the smell of Pall Malls, grain alcohol and a lifetime of deflected introspection; trust me, I worked at a liquor store for three years in college, and I know.  In the same sample of players from 2010 to 2013 as used above, the correlation between wOBA—what we’ll use here to define a player’s ability at the plate—and RBI is .6555. So there is a relationship between a player’s ability and their RBI total, but nowhere near as strong as the relationship between their RBI total and their opportunity—ROB.

However, when we combine a player’s opportunity—ROB—with their talent—wOBA—we should get a good idea of what to expect for a hitter’s RBI total. Here is the formula for the expected RBI totals based on the correlations between ROB and wOBA, and RBI: xRBI =- 85.0997 + 262.7424 * wOBA + 0.1918 * ROB.

When you combine wOBA and ROB into this formula you end up with a correlation coefficient of .878 and an r2 of .771. Wooooo (Ric Flair voice)!!!!!  With the addition of wOBA to ROB we increase our r2, from .63 with just ROB, by fourteen percent.

2013 Expected RBI Leaders

Click Here to See xRBI Leaderboard

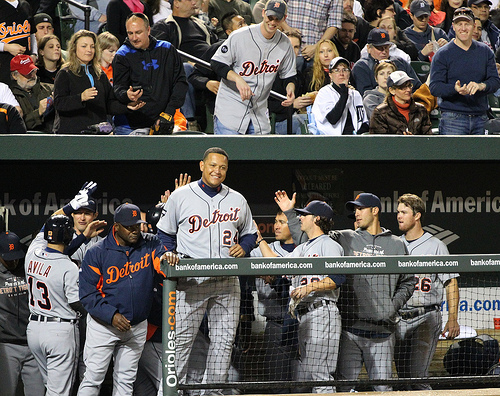
Miguel Cabrera
Photo by: Keith Allison

Let’s think about why Chris Davis xRBI is so much lower than his 2013 actual RBI total.

Davis had 396 runners on base while he batted in 2013, which is 140 ROB less than Prince Fielder who led the league with 536 ROB; Davis’ opportunity was limited.

Davis’ RBI total was considerably higher than what his opportunity would suggest his RBI total should be, and one of the reasons that he outperformed his xRBI total by so much was because of the amount of home runs he hit. Davis, or any batter, doesn’t need a runner on base to get an RBI when he hits a home run. But beyond home runs there is another reason why Davis and other batters outperform their xRBI totals: luck.

Hitting with runners on base is not a skill. A batter has the same probability, regardless of the base/out state, of a hit. Lets forget pitcher handedness and Davis’ platoon splits at the moment. With a runner on second base and two outs Chris Davis will get a hit .272 (27%) of the time—I averaged his Steamer and Oliver projections for 2014 together. Davis, and Alfonso Soriano for that matter, who was the only player to outperform his xRBI by more than Davis in 2013, was lucky and happened to have runners on base the majority of the 28.6%—Davis’ 2013 batting average—of the time he got a hit in 2013.

To put Davis’ 2013 136 RBI season into perspective, in the last five seasons there have been eight players to record 130 or more RBI in a season. Of those eight players, only two—Ryan Howard (2008-9) and Miguel Cabrera (2012-13)—were able to duplicate the performance the following year.

While the combination of ROB and wOBA has allowed us come up with a reliable xRBI, the next step, to increase the reliability of xRBI and account for players who produce a large amount of their RBI from home runs (i.e. Davis), is to include a power component in xRBI: HR/FB ratio.

Follow Me on TwitterDevin Jordan is obsessed with statistical analysis, non-fiction literature, and electronic music. If you enjoyed reading him, follow him on Twitter @devinjjordan.


Assessing George Springer’s Contract Situation

As many should know by now, George Springer is a highly touted and talented player, a huge part of the Houston Astros’ future. He has been on the brink of 40 home runs and 40 steals in both 2012 and 2013, shown that he could maintain his offensive output through each level of the minor leagues, and plays a premium position (center field) at an above average level; if he were to fix strike out issues, Springer would be seen as a top-10 outfielder in the American League coming into 2014.

Given the rules surrounding service time in the majors and the rapidly ascending price tags for premier talent, the Astros would have been perfect content with keeping Springer in Triple-A Oklahoma City to begin the season. Springer was with the major league team for Spring Training and in 31 at-bats was not terribly successful with only a .161 BA, but with much improved strikeout to walk ratio of 11 strikeouts to 8 walks; this should have firmly signaled a demotion to Oklahoma City. The Astros, though, tried to change it up a bit and offered Springer the richest contract for a player with his experience, a 7 year/$23 million contract.

Springer’s representatives countered that the 3 years of arbitration that the Astros were buying out were worth more than the $7.6 million per year that were essentially to be bought out, rebutting that he would be worth closer to $10 million in arbitration. Springer’s declining of the Astros offer sent him back to minor league camp and he will now come to Houston sometime this summer when he is able to move his arbitration clock forward. There are a few questions that arise from this valuation of Springer and also Springer’s decision to not accept the offer.

The most rudimentary, yet essential, aspect to look at in regards to Springer is what the Astros valued George Springer as for the last 3 years of his contract. For better or worse, the contract that the Astros offered was geared towards buying his arbitration so it is not fair to value this contract at $3.3 million a year because it is a ridiculous premise that the Astros assumed he was worth that money now. In fact, arguably the best player in baseball, Mike Trout, was only valued at $1 million a year pre-arbitration and it is a difficult argument to make that Springer is worth more than 3 times of Trout.

That being as it is, this contract should fairly be valued at $7.6 million for the 28-30 year old seasons for Springer. To assess what Springer’s price tag would buy the Astros on the open market, a thorough analysis of trends of free agent outfield salaries from 2006-2013 needed to be conducted. This analysis looked at all outfielders that were signed for $6-$10 million per season. A quick analysis of the data shows that a 34 year old outfielder with a 2.5 WAR would get roughly the same amount of money on the open market as Springer would have received in the proposed extension. Furthermore, out of the 24 player sample, only Cody Ross and Coco Crisp have been better since they signed for a similar amount as what was offered to Springer and each was over the past two seasons so there is very little of an inflation factor.

There are a lot of outside factors and reasons why these players received the amount of money that they did and there is also the fact that $23 million would represent the most money given to a player with minimal experience, Evan Longoria received $17.5 million in 2008; a lot of the liability of this deal was in the hands of the Astros, as Springer is more of an unknown than a proven commodity. The Astros are at a position with their franchise where they would take this liability; Houston is one of the strongest markets in the US, there is a new ownership group in place that has shown a willingness to spend, and by 2017 the team expects to contend. To take it a step further, the team is almost willing to take nearly a $10 million financial hit, assuming that the team is not successful on the field for the 2014-2016 seasons, just to be able to save that money for 2017 and 2018.

The final point may be where Springer’s agents had flawed logic; they are looking at the best wishes of their client as well they should, but in fact this may be a good deal for Springer. The Astros have shown that they are building for the future and are not going to spend money to be decent — there are many that see the Astros as tanking but really they are looking at their present day weaknesses and making them future strengths — so the team spending $10 million on a prospect while the team is still developing should be taken as a huge victory. Springer’s agents are right in assuming that he is going to lose money in arbitration and, if he did sign that contract, he would have been a free agent at 30 years old which is outside of his athletic prime of 27 years old.

This may be outside of his athletic prime, but definitely not outside of his financial prime. Since 2000, fourteen outfielders have earned in excess of $17 million over at least five years of a contract.  Assuming that Springer produced about 4.5 WAR per year from 2014-2018, a common projection for Springer, he could earn $21 million per season in the open market according to the averages set by those player’s contracts.  There are tremendous issues in that valuation of Springer, namely a shift in the market and a regression in Springer’s talents, but judging by recent trends, Springer would still be very well on his way to being one of the wealthiest outfielders in baseball history.

This contract is an outlier and was a fantastic idea for the Astros in attempting to fund their future and assure that Springer was a well paid player for his production. The Astros knew that Springer would outplay that contract and may very well have had provisions in the contract for enhanced performance, but at the onset, all of the liability was on Houston. There is very little reason why Springer needed to be on the 2014 Astros and the team’s financial shrewdness and outstanding player development are main reasons why pundits predict a bright future for the team; Springer was offered this contract as a statement towards the future and it may be short-sighted for Springer to have declined this fair offer. As seen with the case of Longoria, players that outgrow their contracts are usually paid handsomely by their parent teams. By signing this deal, Springer would have opened the pipelines for better negotiations between himself and the team. Declining the deal may be good for Springer in the short term but may be a major blow for negotiating a massive extension for the future.