Archive for Uncategorized

Living in Dangerous Times

Let’s start with the surprising conclusion: Batters are getting hit by pitches at near-historic rates. For all that you hear about pitchers who won’t pitch inside, and umpires issuing warnings that make it impossible to throw at hitters, and batters being unwilling to take one for the team, we’re seeing batters get hit by pitches at the highest rate since the turn of the last century.

I looked at each decade since 1901, the first year there were two leagues. Using FanGraphs’ Leaders page, I calculated the number of hit batsmen per 100 games played:

   1901-1910  6.5

   1911-1920  4.9

   1921-1930  3.6

   1931-1940  2.6

   1941-1950  2.4

   1951-1960  3.1

   1961-1970  3.4

   1971-1980  3.1

   1981-1990  3.0

   1991-2000  4.7

   2001-2010  5.8

   2011-2014  5.3

Baseball was kind of a wild game in the early days, with all sorts of shenanigans on the ball field, including throwing at batters. Hit batsmen were already in decline when, on August 16, 1920, Carl Mays hit Ray Chapman in the head with a pitch, killing him. Hit batters declined through the next three decades, bottoming out at 2.14 per 100 games in 1946. They stayed around 3 or so per 100 games through the 1980s, and then they took off. Here are the 30 years with the most batters hit by a pitch per 100 games:

    1. 1901  8.0       11. 1907  6.1       21. 2008  5.5

    2. 1903  6.9       12. 2004  6.1       22. 2011  5.3

    3. 1905  6.9       13. 1909  6.0       23. 2009  5.3

    4. 1902  6.8       14. 2003  6.0       24. 2013  5.2

    5. 1904  6.6       15. 2006  6.0       25. 1913  5.2

    6. 1911  6.5       16. 2005  6.0       26. 2010  5.2

    7. 2001  6.2       17. 2007  5.8       27. 1999  5.1

    8. 1908  6.1       18. 2014  5.7       28. 1998  5.1

    9. 1910  6.1       19. 2001  5.7       29. 2000  5.1

   10. 1906  6.1       20. 1912  5.5       30. 2012  5.1

Isn’t that strange? Every year from 1901 to 1913 and every year since 1998. Nothing from the intervening 84 seasons. It raises two questions:

  1. What’s going on? Why have hit batsmen increased despite efforts to cut down on beanball wars? It really has turned on a dime. There were 3.8 hit batsmen per 100 games in 1992, the 68th straight year below 4.0. It hasn’t been below that level since.
  2. When will it change? Andrew McCutchen’s plunking was a big story but didn’t lead to any calls for change. Amid laudable efforts to improve player safety, from batting helmets to neighborhood plays to home plate collision rules, hit batters are returning to levels not seen since the year before Babe Ruth’s rookie season. There have been some pretty terrible beanings, like Jason Heyward’s last year. Let’s hope it doesn’t take something worse than that to reverse the trend.



Scouting Buck Farmer’s MLB Debut

Thanks to sudden injuries to Justin Verlander and Anibal Sanchez, the Tigers were forced to scour their minor league affiliates’ rotations in order to find a replacement on short notice. Whether due to his rather fun name or the fact that he happened to line up to pitch on Wednesday, the Tigers selected Buck Farmer from Double-A to make the start against the Pirates.

Although Farmer was a four-year college pitcher out of Georgia Tech, he hadn’t thrown a pitch above Single-A until August 1st of this year. This fact, coupled with his lack of pedigree as a prospect, would lead one to believe that Farmer’s MLB odds for the 2014 season weren’t looking particularly bright, let alone existent, a few short weeks ago.

As a 23-year-old in Single-A, Farmer did exactly what he would be expected to, posting 10.07 K/9 while walking only 2.08 batters per nine. He’s mostly a groundball pitcher, and the long ball (0.52 HR/9) hasn’t been a problem for the big right-hander.

The Tigers believed that Farmer is advanced enough to compete (for one start, at least) against major league hitters, and he proved himself worthy of the challenge. While his final line wasn’t necessarily pretty (5 IP, 6 H, 4 ER, 4 K, 1 BB, 1 HR), he pitched much better than the numbers might indicate.

Farmer relied mostly on his fastball, a two-seamer that he threw 53% of the time. The pitch sat at 93 mph and topped out at 95 mph while exhibiting mild sink. He only got one whiff with the fastball, and four of the six hits he allowed came on the pitch. The two biggest hits of the game, an RBI double by Russell Martin and a two-run HR by Travis Snider, came on fastballs up in the zone. Farmer struggled to keep the pitch down in the zone, where it is most effective since it doesn’t garner whiffs.

His best pitch throughout the night was his changeup, which flashed plus at times. Farmer throws the changeup at various speeds, from 80-86 mph, and he used it as his main strikeout pitch, especially against left-handed batters. The pitch showed nice fading action, sinking more than his fastball did. He threw it from an identical motion, and most hitters were off balance when offering at the changeup. Both of his swinging strikeouts were a result of the changeup.

Farmer’s slider wasn’t particularly impressive, and he struggled to get right-handed batters to chase the pitch out of the zone. Varying in break and velocity (79-83 mph), the slider sometimes looked more like a curveball, often exhibiting far more vertical than horizontal movement. Yet he was able to throw it over the plate to steal strikes, and he mixed pitches well for the most part.

What really hurt Farmer was his (or, more likely, Alex Avila’s) stubbornness with the fastball. In the fourth inning, Farmer had retired the first batter before backing Pedro Alvarez — who he had struck out on three consecutive changeups in the third inning — into an 0-2 hole. Avila called for a fastball, which Farmer placed perfectly on the lower edge of the zone. Alvarez lined it into center field for a base hit, setting things up for Jordy Mercer and Travis Snider, who tripled and homered, respectively — both on fastballs. Farmer retired the next two batters using his slider.

Overall, Farmer was more than decent for a kid making only his third start above Single-A, not to mention his first big league start in the thick of a pennant race. He was confident enough to throw any pitch in any count, and he was in or around the zone for the most part. When he did miss, however, it was often up in the zone. That’s not going to work against MLB hitters, especially since he probably won’t get many whiffs with the fastball.

The slider needs more polish, but it looks to be an average pitch. His high strikeout rate won’t translate to the major leagues, unless he adds more bite to the slider in order to get right-handed batters to chase. But the changeup is a nice pitch and he throws hard enough, doesn’t hurt himself with walks, and gets enough ground balls to be a No. 4 starter in the big leagues, maybe even in 2015.


Extreme Teams Past and Present

The way a team is built is always at the heart of discussions of free agent acquisition, trade analysis, optimal lineup construction, etc.  It is what general managers are paid to do, and there are some very divergent philosophies that are espoused by folks like Brian Sabean or Jeff Lunhow.  A few teams each year by happenstance or design end up having one unit, offense or pitching and defense (p/d), far outstrip the other in performance, and these are what I want to look it today.

In this instance I am stripping teams down to a function of two activities, how many runs do they score and how many do they give up.  Some teams have innate advantages to one or the other of these activities based on fun things like park effects or deep pocket books, but that’s okay.  What I did was pull the last ten full seasons (2004 through 2013) first and find out what the average runs scored/given up by a team was for that year.  Then for each team I gave them a plus minus for runs scored and given up so a team that scored 20 more runs than the average gets a +20 and if they also allowed 20 fewer runs than average they get another +20 and their extremeness rating is 20 – 20 = 0, so their units of offense and p/d are balanced and not extreme.  The most extreme differences for the two units over those ten years are as follows:

 photo ExtremeTeams_zps6989f530.jpg


What stands out is that the most extreme teams tend to not be very good because one unit tends to be very, very bad creating an insurmountable obstacle to success.  The Rangers of 2008 are by leaps and bounds the most extreme team because the had the best offense in major league baseball at 148 runs more than the average team, but they also allowed the most runs that year giving up 214 more than average and thus one 79 games and an extremeness rating almost 50% above second place.  The 2005 Red Sox are the only team that made the playoffs with one dominant unit, and their pitching staff was bad, but not extremely bad as we will see in a bit.  Their 2011 team was similar, but the 90 wins was not enough to get them into October.

Another interesting thing in this group is that almost all of them skew toward hitting.  Only the 2010 Mariners, and the Giants teams 2009 and 2011 were pitching oriented with no offense to speak of.  Also, 2005 was evidently the year for being extreme as there are three teams from that season in the top 10.  Now let’s look at teams that are most extreme in one or the other category rather than the combined.

If we look at just extreme offenses there is a lot of success.  The top offense of the last 10 seasons was the 2007 Yankees who scored 190 more runs than the average team that season.  I was looking at the top 15 offenses by this measure and the Yankees show up 6 times and Boston does 4 times.  Money can buy you a great offense, and it can get you to the playoffs.  A full 80% of the top 15 offenses above average made the playoffs with only the aforementioned 2008 Rangers and 2011 Red Sox along with the 2005 Rangers missing the postseason.  Those three teams all had negative p/d production relative to average that kept them out, though the Red Sox team was close.

Before moving to p/d extreme teams, I also looked at the records of these teams versus their Pythagorean expectation and they seem to perform as you would expect.  Seven of the 15 were below expectation, so conversely eight above and on average the actual and expected were very close to being the same.

The teams that were best by runs allowed look very different.  At +165, the 2011 Phillies’ “Best Rotation Ever”, was at least the best rotation of the past ten years by runs allowed versus the average.  The volatility of pitchers prevents particular organizations from dominating this list like the offensive list.  Only the Giants and Padres show up more than once with the three and two seasons respectively, thanks PECTCO!  That means the top 15 offenses of the past decade belong to only four organizations versus 12 different teams being represented on the pitching side.

This probably shows that teams are being smart (or unsuccessful) in trying to build a team with extreme pitching dominance too.  Only eight of the 15 best p/d teams made the playoffs, so better than naive probability of getting there, but a lot worse than the dominant hitting teams percentage at a little over 50% versus the 80 we saw before.  Three of the playoff teams did manage to cover up below-average offenses, but generally you need a decent offense to go along with dominant p/d.  A big reason for the difference is that the offenses tend to diverge from average to a greater extent as we can see in the top 2, top offense +190 and top p/d only +165.  This difference is consistent though decreasing in magnitude moving down the top 15s.

If you compare the pitching extreme teams’ actual wins versus their Pythagorean expectation it does not behave like the extreme offensive group did.  Out of the top 15 pitching extreme teams, 11 had fewer wins than expectation.  The two tail p-value on a paired t-test for actual versus expected is 10.4% which doesn’t make for a strong conclusion, but probably means this needs some more attention.  So what does all of this mean for this year’s playoff race?

The extreme run scoring teams for 2014 are Oakland, LA Angels, and the Blue Jays.  Detroit was close, but they also just traded away some offense, so I will save them for another day as I think they are interesting right now too.  Oakland is a lock for the playoffs and are the only team on pace to crack the top 15 of the past ten years with the offense trending toward being about 125 runs above average though the departure of Yoenis Cespedes may bring that back a little.  The Angels are also looking pretty good for the playoffs, but probably as a wild card due to Oakland.  Toronto is 2 games out of the wild card and needing to jump two teams, so they are in some trouble as their p/d is not doing so well.  Their only trade deadline move of note was to add Danny Valencia so they have not shored up the pitching much though Marcus Stoman and Aaron Sanchez have come up and maybe Daniel Norris will as well.

The extreme p/d teams so far this year are Seattle, Washington, Oakland again, and a couple of almost teams like Cincinnati and San Francisco.  Seattle is there with Toronto only flipped as they have a below average offense.  They added Kendrys Morales and Austin Jackson and Chris Denorfia to try and help, but all have struggled so far for the Mariners.  Oakland of course added lots of pitching in Jeff Samardzija and Jason Hammel and then Jon Lester, so don’t be surprised if they end up with the best offense and defense by the end of the year.  Washington added Asdrubal Cabrera to a very average offense and Matt Thornton to their bullpen, but since they are almost a lock for the playoffs they weren’t needing large upgrades.


Can the Cubs Draw an Ace?

A major league baseball franchise exists to serve one of only two purposes: (1) win a World Series; or (2) line the owner’s pockets without regard to the quality of the team on the field. Since this post isn’t about the Miami Marlins, I’ll focus on the first purpose. It is almost axiomatic that a championship team needs at least one ace-caliber starting pitcher. Cubs president Theo Epstein has been acting as though he would single-handedly battle a battalion of Imperial storm troopers if that’s what it would take to get an ace. And indeed, many of you felt a minor disturbance in the Force when the Cubs claimed Cole Hamels off waivers from the Phillies tire fire. No trade was consummated, but is Theo right to obsess over finding an ace?

Here are the best starters from each of the last 10 World Series winning clubs, along with their ERA+ for that year, their career ERA+, and age that year. I’m using ERA+ to wash out park effects as well as the effects of the last decade’s gradually desiccating run environment.

Year   Pitcher                     ERA+ (WS season/career)           Age

2004  Curt Schilling (BOS)                   148/127                   37

2005  Mark Buehrle (CHW)                 144/118                   26

2006  Chris Carpenter (STL)               144/118                   31

2007  Josh Beckett (BOS)                     145/111                    27

2008  Cole Hamels (PHI)                     141/125                    24

2009  CC Sabathia (NYY)                     137/120                    28

2010  Madison Bumgarner (SFG)   131/114                   20(!)

2011: Kyle Lohse (STL)                         109/99                     32

2012: Matt Cain (SFG)                          126/117                     27

2013: Clay Buchholz (BOS)                234/110                    28

So while a team can be championship caliber without a dominant starter, it hasn’t happened often in the last 10 years. The 2011 Cardinals were the only team in this (admittedly miniscule) sample to scrape by with a pedestrian #1 starter (and remember, this was the year that Cards managed to win the pennant only by imprisoning the Atlanta Braves in a shipping container). Buchholz is a bit of an oddity in that he pitched only 108 innings, but man, they were 108 damn good innings. Lester and Lackey had weaker rate stats but pitched many more frames.  Every other team had a clear ace who beat the league ERA by at least 25% — most did even better.

What this list also shows is that aces don’t ace it every year. Most of these guys beat their own career ERA by roughly 10-30% in their World Series seasons. These are, for the most part, very good pitchers who had an occasional great season, but not guys who can crank out stifling dominance year after year. Almost nobody can do that. The other thing to note is that 7 of the 10 were under 30, and only Schilling was putting his teeth in a glass at night. Dominance is generally a younger man’s game.

All this suggests that the best way to get an ace season is to get two or three young quality starters with upside, and hope that at least one of them has an explosive season when the rest of the team is also doing well. But for a team like the Cubs, who have a plethora of low-ceiling starters in their system, this big bang approach probably won’t work.

So if they’re going to get an ace season, they need to import. Unfortunately, imported front line starters generally don’t come young, and never come cheap. The big obtainable names include the following (numbers are career ERA+/ current age):

Free agents at the end of this year

Max Scherzer (118/30)

Jon Lester (120/30)

Free agents at the end of next year

David Price (123/28)

Zack Greinke (116/30) (Greinke has an opt-out after the 2015 season, but he’s signed through 2018.)

I’m a celebrity! Get me out of here!

Cole Hamels (125/30)

And here they are ranked by 4-seam velocity this year:

Price             93.4

Scherzer       92.7

Hamels         91.8

Lester            91.6

Greinke         91.6

If I were Theo I’d probably start at the top of this list and work down, but Price may never become available if the Tigers lock him up. Scherzer and Lester will cost lots of money but no current talent, and will both probably be available in 2 months. The Cubs don’t have a front-line starter anywhere in the organization, but they do have around eleventy quillion dollars in payroll space, which will get even larger after the ad revenues from the new jumbotron start rolling in. Buying two of these guys and teaming them up with C.J. Edwards, Corey Black, and what looks likely to be a young, cost-effective, video game offense could finally make Cubs fans forget about 1908. Or the free-agent contracts could be giant albatrosses that make Cubs fans forget about Alfonso Soriano. That’s why they call it gambling.


Another Way to Show that Mike Trout’s Athleticism is What Separates Him

We all know Miguel Cabrera and Mike Trout are elite hitters.  Yes, I am going to compare the two.  And yes, I know that’s been done many times before.  However, I’ve come up with a stat that really separates the two. I’ll be looking at their complete offensive package, so this is not at all related to WAR, as it does not include defense.

Cabrera has won the MVP for the past two years, and Trout is putting up seasons never seen before from 20-22 year olds.  When you compare what they’ve done since 2012, they are very similar hitters. (Stats through Aug. 9, 2014)

Trout: .317/.408/.563 with a 172 wRC+, .247 ISO, .415 wOBA (1860 PA)

Cabrera: .330/.403/.592 with a 167 wRC+, .263 ISO, .420 wOBA (1828 PA)

As you can see, they’re almost identical.  Cabrera has a slight advantage in the power department with a 16 point advantage in ISO and a 29 point advantage in SLG. What I want to do is take this a bit further and analyze how much speed and athleticism gives Mike Trout an advantage.

WAR takes everything a baseball player can do into account.  Trout has had the edge over Cabrera since 2012 with a 26.5 mark compared to Cabrera’s 17.7, a pretty significant gap.  Many people don’t buy into WAR, so I wanted to show how speed changes Trout’s offensive game.  Again, I am not looking at defense for this piece.

As we know, SLG is total bases divided by plate appearances.  However, it does not include every single base a hitter collects.  For example, walks and HBP are not included.  There are many more things that it does not include, and that’s what I looked at in order to create a new stat, adjusted SLG, if you will. I used FanGraphs and Baseball Reference to find every single base an offensive player can collect, whether it’s after they hit the ball or after they reach base. In addition to hits, walks, and HBP, I looked at extra bases taken, reaching on errors, net stolen bases, pickoffs, and double plays grounded into.  I included double plays because they make a huge impact.  It’s two outs on one play, so I took an extra base away for each double play, as it eliminates another base runner.  For extra bases taken, I included five things:

  • Times a runner is on first, then reaches third or home on a 1B
  • Times a runner is on first, then scores on a 2B
  • Times a runner is on second, and scores on a 1B
  • Bases taken on fly balls, passed balls, wild pitches, defensive indifference, balks
  • Minus outs made at bases (doubled off, trying for double/triple/HR, advancing on fly balls, wild pitch, passed balls)

Other things to keep in mind; I added up every single base, then subtracted a base for when a guy gets picked off or bounces into a double play.  For the final percentage, I took all the bases each player collected and divided it by plate appearances.  It’s a very simple stat, once you gather all the information needed.

Here is a table for what I calculated (ROE—reached on error. NSB—net stolen bases. XBT—extra bases taken.  PO—pickoffs.)

PA (TROUT) BB HBP ROE NSB 1B 2B 3B HR XBT PO DP TOTAL ADJ SLG
1860 239 20 24 82 297 99 22 82 161 6 19 1390 0.747
PA (CABRERA) BB HBP ROE NSB 1B 2B 3B HR XBT PO DP TOTAL ADJ SLG
1828 200 9 9 6 319 102 2 105 120 0 63 1230 0.673

As you can see, the speed of Trout has pushed him way over the top when it comes to being a complete offensive player.  He has reached on an error 15 more times than Cabrera (24-9).  Speed has a lot to do with this by putting pressure on defenders, especially infielders, who often rush throws when a speed guy is running down to first.  Trout also has 76 more net stolen bases than Miggy (82-6) as he has racked up 94 steals since 2012 while being caught just 12 times.  He also grounds into a double play far less than Cabrera, with 19 since 2012 compared to Cabrera’s whopping 63.  Trout also takes more bases while on the base paths.

When you consider that Trout and Cabrera both get hits, extra-base hits, and walks at a fairly similar rate, it’s alarming to see how much Trout goes ahead of Cabrera when you take speed and baserunning into account. Trout’s “adjusted slugging percentage” (or fill in another creative name here) is .747 since 2012, compared to Cabrera’s .673, a very noticeable difference of 74 points.  This percentage, and all of the counting stats that are included with the table, is reliable because they both have almost the same number of PA since 2012, with Trout at 1,860 and Cabrera at 1,828.

Everybody loves to compare Trout and Cabrera.  This is just another way of showing that Trout is ahead of Cabrera, because it shows how well Trout does the things that are smaller and often unnoticed things well.


The Curious Case of Chris Coghlan

Jed Hoyer and Theo Epstein have been praised over and over for how well they draft and how they sign pitchers like Scott Feldman and Jason Hammel to one-year contracts and flip them for Jake Arrieta, Addison Russell, and Billy McKinney.  The hype they have created about the Cubs farm system is unimaginable and deserving.  But I’m not here to talk about how great the farm system is, it’s been repeated to us a million times.

Chicago’s 2013-2014 offseason signings were headlined by players like Nate Schierholtz and Emilio Bonifacio (especially after his hot start), but the best free agent pick up came from a minor league contract and has been undervalued by the Cubs fan all season.

I’m here to talk about the Curious Case of Chris Coghlan.

Chris Coghlan was the Rookie of the Year in 2009 when he played for the Marlins.  He put up a .321/.390/.460 line and had a wRC+ on 127.

In 2010 Coghlan became an average hitter putting up a pedestrian line of .268/.335/.383.

His decline continued until he hit rock bottom in 2012 only playing 39 games with the big club and putting up numbers that shouldn’t be uttered.  But just so you don’t have to go look them up yourself: .140/.212/.183.  *He did miss a lot of time due to injury

In 2013 Coghlan put up numbers comparable to his 2010 season and the Cubs front office must have liked the upward trend because they signed the 29-year-old to a minor-league contract that gives them team control until 2017.  This was not an investment but a very low-risk speculation, and right now the Cubs have their second-most productive hitter only making ~$500,000 this year.

Yeah, I said it: Chris Coghlan is the Chicago Cubs’ second-most productive hitter. (Behind Rizzo)  Not Castro, not Baez (yet, needs more PA), not Ruggiano, the only player relatively close was Bonifacio.

Coghlan has put up numbers that are comparable to his Rookie of the Year season:

2009:                                                                                   2014:

BABIP: .365                                                                      BABIP: .333 (2nd on Cubs)

wRC+: 127                                                                         wRC+: 135 (2nd on Cubs)

wOBA: .374                                                                       wOBA: .369 (2nd on Cubs)

Walk Rate: 10.9 %                                                           Walk Rate: 10.6% (2nd on Cubs)

K Rate: 13.6%                                                                    K Rate: 16.9 % (1st on Cubs)


Right now Chris Coghlan realizes 35% more value in Runs Created than the average position player.  And although he doesn’t have enough PA to be qualified for the FanGraphs leaderboards, plugging his numbers in would put him in the class of players like Carlos Gomez, Matt Kemp, Melky Cabrera, Ryan Braun,  and Ben Zobrist.

What those players will be making this year followed by their wRC+ and wOBA:

Carlos Gomez: 7 Million, 135, .370

Matt Kemp: 21 Million 133, .358

Melky Cabrera: 8 Million 137, .374

Ryan Braun: 10 Million 129, .362

Ben Zobrist: 7 Million 132, .356

Chris Coghlan: 500k, 135, .369

The Chicago Cubs are paying 500k dollars for the offensive production of Carlos Gomez.  It’s almost scary how similar their numbers are:

Name                    Slash                                      wRC+                    wOBA

Gomez                 .289/.352/.490                   135                         .370

Coghlan                .288/.367/.477                   135                         .369


With the assumed call up of Soler in September, there is one outfield spot left for Coghlan.  And with the development of Almora stunted a little bit in his call-up to AA it seems Coghlan has some more time to prove himself, and also prove he brings value to the Cubs in other ways.

With the army of prospect the Cubs will be calling up these next couple years it would be downright crazy to believe that some players aren’t going to struggle.  I really don’t feel like I have to draw the conclusion for you but I will anyways.  Even if Coghlan’s playing time and numbers decrease next year, the Cubs will have a 30-year-old who has been Rookie of the Year while also having a 30-year-old player who has gone through major slumps and bounced back. Chris is (hopefully) somebody who can be a mentor for the up and coming while still giving value of somewhere between 115-120 wRC+.

For all of the things that Theo and Jed have done for the Cubs, I think I’m right here to argue that the signing of Chris Coghlan has realized the most value of any position player signing they have made.  The Chicago Cubs are paying $500k for Carlos Gomez offensive output, let that sink in.

Maybe the Curios Case of Chris Coghlan is just like The Curious Case of Benjamin Button (but with better alliteration) in the fact that Coghlan is playing younger as he’s getting older.


Yankees Rotation: Playoff Bound?

When Spring Training rolled around the Yankees had one the better rotations in baseball on paper. CC Sabathia lost weight, Huroki Kuroda was back for another season, Ivan Nova was poised for a breakout and they had two new big additions to the staff. Masahiro Tanaka was fresh off setting records in Japan and signing a massive contract and Michael Pineda was healthy and finally ready to contribute. However, at this point in the season Kuroda is the only one who remains from that highly touted staff. Nova and Sabathia have suffered season ending injuries with Tanaka out since the All-Star break and his rest of season and possibly even 2015 season in question. Pineda is currently on a rehab stint and could rejoin the rotation as soon as Wednesday after missing most of the season to this point with a multitude of injuries.

However, despite all of these injuries Brian Cashman has made a few minor moves and some strategic callups to help build what has become a very successful rotation. Kuroda has still remained part of the rotation with Cashman adding Brandon McCarthy and Chris Capuano and calling up pitchers like Shane Greene and Chase Whitley. David Phelps had also joined the rotation replacing the injured starters yet he himself has also gotten injured and found himself on the disabled list. They also added Esmil Rodgers who in a spot start on Friday pitched well earning himself a win and potentially another start until Pineda returns.

The question remains though although this rotation has been extremely successful to this point can they maintain the success enough to carry the Bronx Bombers to the playoffs? The Yankees currently sit six games out of first in the division while also trailing in the race for the second wild card spot by 1.5 games need to the rotation to pitch well in order to make a run at October.

As of right now the four guys poised to remain in the rotation for the foreseeable future are Kuroda, McCarthy, Capuano, and Greene with the fifth spot likely being Pineda’s when he returns, likely in the next two weeks.

Kuroda has pitched much like the Yankees had expected of him throwing to a 3.97 ERA, which is slightly above his 3.46 career ERA, but it is an anticipated regression for a pitcher in his age 39 season. For his career Kuroda although he has thrown less innings had been a better second half pitcher (3.52 ERA vs 3.39) and this season the trend has continued with Kuroda throwing to a 4.10 ERA in the first half and he has a 3.42 ERA so far in the second half. The Yankees have tried to limit the aging Kuroda’s pitch count and innings so far this season wanted to ensure the right hander was stronger down the stretch run as Kuroda faded in 2013 late in the season. If Kuroda figures to maintain his career splits and pitch better in the second half he should be able to maintain his success to this point in the season and be the pitcher he was expected to be early on in the season.

The two minor trades that Cashman made before the trade deadline are also going to factor into the Yankees postseason chances. Thus far McCarthy and Capuano have been huge for the Yankees pitching to a 2.21 and 2.84 ERA respectably over 9 starts combined and have a combined 5-1 record in those 9 starts. So far over his 36 innings as a Yankee McCarthy is pitching much better than his career averages in K/9, BB/9, and HR/9. He has faced 155 batters as a Yankee meaning only his K rate has stabilized (70 BF). Thus the other two statistics especially his HR rate which is currently at .74 is much improved compared to his career 1.03. The improved HR rate is likely what has caused his vast success to this point, and pitching down the stretch in the power-hitting AL East and in Yankee Stadium, chances are this will regress back to his career averages and McCarthy will once again be a back-of-the-rotation starter, as opposed to the ace he has been for the Yankees so far since the trade.

Although Capuano’s sample size has been smaller than McCarthy’s his success has been similar. According to career averages Capuano is striking out around a half batter more per nine and walking about a half batter less. Those don’t account for the increase in success he’s had. So far in 19 innings in New York Capuano has yet to allow a home run. However, looking back at his time earlier this season with the Red Sox his season HR/9 is at .53 significantly lower than his career 1.20. Unless at the age of 35 and in his 10th season Capuano has magically figured out the secret to keeping the ball in the ballpark he will likely regress back and beginning pitching more like he has in the past with his ERA moving back into the range of his xFIP which currently sits at 3.35 as a Yankee and 4.07 for his career.

Lastly, that leaves the rookie revelation that has been Shane Greene. As Eno Sarris points out, looking at Greene’s pitch mix gives him a few good comps of successful major-league starting pitchers. However, Greene’s minor league track record did not signal anything similar to this type of success he’s had since being called up. However, there is room for excitement as Greene has posted the lowest K/9 rate since his call up than he did at any point in his minor league career meaning that rate could see an increase. Also, his walk rate seems to be on par with his minor-league record, especially when looking at his numbers over 2013 and the first half of 2014.

Where Greene has succeeded in the big leagues has been with his ability to limit BABIP (.268) and his low HR/9 numbers. Throughout his minor-league career the highest HR/9 Greene posted at any stop was in rookie ball when he posted a .79 rate over 23 innings. Thus far in 37 big league innings Green’s HR/9 has been .72. He has a track record of being very successful at keeping the ball in the ballpark. However, what remains to be seen is if his BABIP comes back down to Earth and his K rate remains low. If he doesn’t retain the ability to strike batters out like he did in the minors and regresses to his minor-league BABIP numbers — only one stop lower than .330 — Greene figures to regress to the below-average pitcher he was in the minors

Over the last month the Yankees’ makeshift rotation has been keeping them alive in the playoff race. However, looking at each member of their rotation, there is reason believe that significant regression is coming with Kuroda being the only one performing near his career averages. Unless each of these arms continues this unprecedented success or Pineda and potentially although unlikely Tanaka return and pick up right where they left off it doesn’t seem like this current Yankee rotation has what it takes to reach the playoffs.


Why is Bryce Harper Not Hitting for Power in 2014?

Bryce Harper has been disappointing so far in 2014, both before and after he launched three home runs in one AA rehab game.  The highly touted left-hand hitting outfielder has been pretty bad for a guy with a .346 BABIP.

As of August 7, 2014, he’s still been walking a lot (11.2%), but he’s striking out far too often (27.4%).  His ISO is just .121, which is lower than Dustin Ackley, Alexei Ramirez, and Billy Hamilton.  He’s also slugging just .374.

Yes, it’s only 215 PA so far.  That’s about a third of a season however, so I’m going to dig into to something that may contribute to why he’s struggling and hitting for next to no power.

First I will look into the types of pitches he’s getting.  Harper is seeing significantly more fastballs in 2014, and a lot less curve balls.  He is seeing 56.2% fastballs in 2014, compared to 45.9% in 2012 and 49.9% in 2013.  He is seeing 9.1% curve balls in 2014, compared to 13.1% in 2012 and 12.4% in 2013.

Now that we know that, let’s look at what Harper has actually produced with these pitches.  His HR/FB is less than half of what his career mark is.  This year, his HR/FB rate is 7.1%, down from his career mark of 15.6%.  This is interesting because he is hitting more fly balls than he ever has, at 34.4%, which is about 1% above his career average.  The final difference in his fly ball rates are infield flies.  He’s hitting infield popups 9.5% of the time, up from his career percentage of 7.6%.

So what does all this mean?

Harper has gone through a lot in 2014.  He’s changed his stance a couple times and he’s missed time with a thumb injury.  These two factors, especially the thumb issue, could be causing Harper to be late on fastballs.  There’s evidence that shows he is late on some pitches as well.  His ISO is just .071 when he hits the ball to center field and .118 when he goes to the opposite field.  For his entire career, his ISO is .209 to center and .188 to the opposite field.  That’s a pretty significant difference.  Most of his fly balls are going to center and left as well, as you can see here, which suggests he’s not driving the ball the other way with as much authority as he usually does.  His contact has clearly been weaker when taking the ball up the middle and the other way.

Let’s all remember he’s still a 21 year old kid.  He’s learning. He will be fine.  This is just a blip on the road and an area in which he’s struggled with this season.

The fact that Harper is getting pitched differently means he will need to make an adjustment, just as pitchers have clearly made an adjustment to him.  With his talent, he will certainly make that adjustment.  Once his thumb is fully healed, he will be able to drive the ball better as well.  These are also still short samples too, so if you’re a Nationals fan, there’s no reason to think Harper’s non-existent power will continue.


Home Run Skewness, Babe Ruth, and Maybe PEDs

The breaking of baseball known as the dead-ball era is generally considered a phenomena of the 1919 Babe Ruth season where he hit a record 29 homers for the Red Sox.  That was a good year, but not something jaw dropping as three players had managed 25+ homers at that point and Ned Williamson’s record from 1884 was only two behind Babe.  The next season was the unprecedented explosion when Ruth redefined power posting 54 home runs doubling up anyone else who had ever played in the big leagues.

It only took a few years for the trajectory of offense, and especially home run production, to change drastically.  In 1922 Rogers Hornsby hit 42, Ken Williams 39, and Tilly Walker 37 all besting The Bambino’s paltry 35 that season.  Over the next several decades home run production shifted drastically as power re-shaped the game.

 photo HRSkew_zpsb90e19d4.jpg


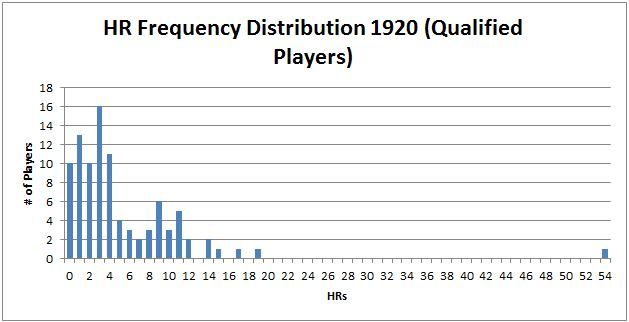
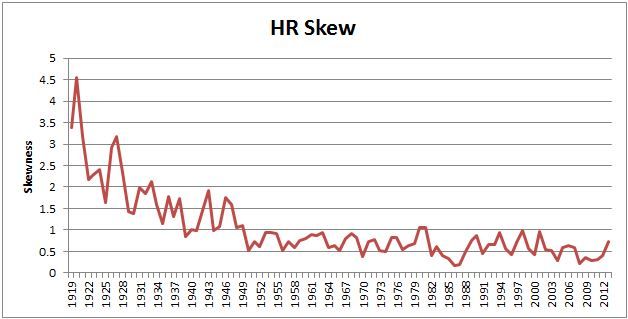
Skewness is based on the Excel formula where anything between -1 and 1 is not skewed, and since we have no negatives here we will focus on above 1 to start, or positive skewness (long right tail).  As you can see, the peak of skewness in HR production was that 1920 season where Ruth was an extreme outlier, see below:

 photo 1920HRs_zps20fcd686.jpg


You can see the skewness, a long right tail, and most of it is being driven by one observation.  Positive skewness was always present in early baseball due to the large cluster of players at or slightly above 0, but this took it to a new level.  If you go back to the previous chart though, you will see that as the league started hitting more long balls the skewness quickly dissipated, and by the late 40s went away.  Only twice since 1949 did we see a skewness above 1, in 1981 and 1981 where the skewness shows up as 1.05 and 1.04 respectively, so right on the dividing line between truly skewed or not.  Interestingly, the skewness leaves and stays away shortly after the talent pool widened with an influx from the Negro Leagues which may have cut out some of the lower end that was causing it.

One of the things to keep in mind for all of this is that a lot of people look at the steroid era as another period where baseball was broken with scientifically enhanced freaks blasting way more home runs than should be seen.  Yet, in the data we don’t see a large spike in skewness through that period, which of course leads to a lot of ambiguity and no answers as you could read it in multiple ways including the two extreme views:

1) See, EVERYONE was cheating in the steroid era, so the entire distribution shifted enough to prevent even 1998’s home run chase ending with two players breaking the all-time record from becoming a skewed distribution.

2) Despite the cheating nothing was all that greatly affected.  There happen to be  a couple of cheaters who succeeded, but mostly the cheaters stayed with the pack and thus we see no skewness.

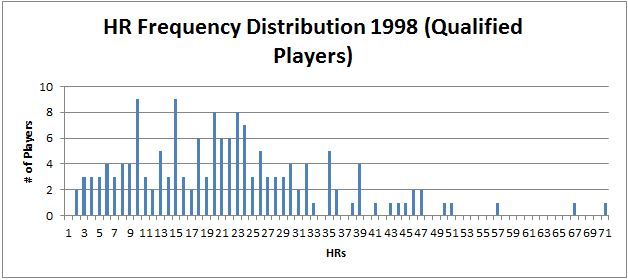
So what did the distribution look like in 1998?

 photo 1998HRs_zpsc52198d3.jpg

Rather than the highest frequencies being 0 to 4 home runs and then tapering off quickly like 1920, we now see that every qualified batter came up with at least 1 HR and that the largest mass is from 9 to 23 home runs.  This means that Mark McGwire’s 70 HRs was about 3.5 times the average and median which were 20.7 and 20 for the year.  In comparison, Babe Ruth hit 10 times the average of 5.3 HRs in 1920 and 18 times the median of 3, so you can see how much farther from the pack he was.

Whether or not PEDs broke baseball again is not something I am prepared to answer here, but we can at least say it didn’t break it to the degree that Babe Ruth did when he signaled the end of the dead-ball era.  What we can tell from home run production is that it seems to be distributed fairly evenly and has been for more than half a century of baseball in which time we have seen many changes to the game.  All that leaves me with is more questions in reality, and that is just fine by me.


Best/Worst Starting Pitchers According to ISO

ISO is used to determine a hitter’s ability to get extra-base hits as it is a measure of slugging percentage minus batting average.  So using the same idea and with the help of slugging percentage and batting average against we can evaluate the best pitchers at limiting extra-base hits.  First we will look a the 10 best starting pitchers in 2014 according to ISO.

PLAYER ISO
Garrett Richards 0.069
Chris Sale 0.077
Felix Hernandez 0.083
Chris Archer 0.083
Sonny Gray 0.084
Adam Wainwright 0.089
Jose Quintana 0.089
Clayton Kershaw 0.092
Tyson Ross 0.093
Jarred Cosart 0.094

As would’ve been expected the top ten includes some of the best pitchers in the league.  Guys like Wainwright, Kershaw and many of the others are also found near the top of the ERA leader-boards.  However, one name more than the others does not quite fit with the others on this list, Jarred Cosart.  The hard throwing right-hander who was traded at the deadline from Houston to Miami has been one of the best pitchers in the league at limiting extra-base hits.  However, his ERA — 4.51 — does not match.

Cosart’s lack of success despite his ability to limit hitters to singles is due to two areas where he struggles.  The first is stranding runners.  Cosart’s LOB% of 67.4 is 9th worst in the league.  Although Cosart has excelled in mainly allowing singles he has not done a good job of keeping those hits from coming around to score.  However, the main area that Cosart has struggled this season is his control.  His BB% is tied with A.J. Burnett for third worst in the league at 10%.  Thus Cosart’s high frequency of baserunners due to his walk rate and his struggles in stranding runners have caused the hits he has allowed to do more damage.

Player ISO
R.A. Dickey 0.174
Josh Beckett 0.175
Wei-Yin Chen 0.177
Edwin Jackson 0.177
John Danks 0.184
Chris Young 0.186
Eric Stults 0.188
Jake Peavy 0.191
Dan Haren 0.202
Marco Estrada 0.234

Again not surprisingly, several of these pitchers are among the worst qualifying starters in terms of ERA in 2014.  With the bottom 4 pitchers all with high-4 ERAs and Jackson pitching to a 5.66 ERA.  However, there are also a few outliers in terms of success with Beckett and Chris Young both pitching to much better ERAs than their ISO allowed would suggest.  Beckett’s 2.88 ERA is good for 19th best in the league with Young’s ERA placing him in the top 40 among starters.

Where both pitchers have succeeded this season is in stranding runners.  Beckett ranks number 1 in the league in LOB% while Young finds himself at 4th.  Both pitchers have been very successful at pitching themselves out of jams this season.  For that reason both pitchers have been able to allow a large amount of extra-base hits and still be among the best in the league at preventing runs.