Archive for Uncategorized

The Ballad of Brett Lawrie

He’s not a good enough 3B and he doesn’t hit well enough to play at any of the easier defensive spots.

1261 PA, .273/.348./450, 102 OPS+

“He” is Edwin Encarnacion, then of the Cincinnati Reds, and those are his stats through his age 24 season (2005-2007). Just three years into his major league career, Encarnacion had yet to attain 600 PA in any one season, and questions were already be raised about his viability as an every day player. The quote above comes from here, and, to be fair, it represented the judgment of only some E5 observers. But despite having the opportunity to act out one of the best baseball revenge fantasies ever, Encarnacion never fully put those doubts to rest while he was with Cincinnati. Following what seemed to be a possible breakout season at age 25 in 2008, E5’s power disappeared the following year, and the disgusted Reds shipped him midseason to America’s Hat in exchange for the Ghost of Rolen Past, who gave Cincinnati the final 3.5 seasons of his career, 1.5 of which were useful.

North of the border, Encarnacion’s power returned in 2010 even as his OBP continued to regress; his production overall rebounded to the level it had been in 2008 (109 OPS+ and wRC+). He continued to maneuver around third base as though it were a point singularity, however, so in 2011 the Blue Jays began transitioning him to a 1B/DH, giving him 92 starts in those slots as opposed to just 30 at third. The results at the plate were encouraging: his average and OBP made substantial gains without giving away too much power. Then, in 2012, Encarnacion finally went off, commencing a three year tear during which his OPS has never been below .900 and his worst HR total was 34. Today, Encarnacion can hit in the middle of any major league lineup. If Alex Anthopoulos is working for the MLB Network in 2016, it won’t be Encarnacion’s fault.

***

He started off cold as ice … before getting hurt sliding into second base.

1361 PA, .250/.331/.415, 97 OPS+

“He” is Alex Gordon, and those are his stats through his age 24 season (2007-2009). Just three years into his major league career, Gordon’s stellar offensive production in college already seemed a distant memory, and questions were being raised about his viability as an every day player. The quote above comes from here, and while that writer was ready to give up on Gordon, to be fair, many others were calling on the Royals to remain patient with the second overall pick in the 2005 draft. In 2009 Gordon’s power, never substantial in the majors to that point, really began circling the drain, and after getting off to an anemic .685 OPS start in April 2010, the disgusted Royals demoted Gordon and banished him to left. He would never appear at third base again.

He would, however, rediscover his stroke. Gordon hammered 16 homers in just 321 PAs at Omaha, good for a steak-sized 164 wRC+. He returned to The Show on July 23, and while the remainder of his 2010 season did little to quiet his critics (he finished with a wRC+ of 85, actually two points worse than the previous year), in 2011 he began a four year rampage, headlined by 96 doubles during 2011-2012, as well as ironman durability. Since opening day 2011, Gordon is third in the majors in plate appearances, behind only Ian Kinsler and Elvis Andrus. Gordon’s durability and on-base skills have made him a key offensive cog in the Royals somewhat surprising resurgence. He’ll never have to go to back to Omaha unless he has relatives there.

***

He’s been injured numerous times, suspended and has underperformed with the bat once pitchers began taking advantage of his lack of patience at the plate.

 1431 PA, .265/.323/.426, 104 OPS+

“He” is Brett Lawrie, and those are his stats through his age 24 season (2011-2014). Just four years into his career, his first 171 blistering plate appearances of his career have disappeared in the rearview, and questions are being raised about his viability as an everyday player. The quote above comes from here, and was written before Lawrie strained his oblique (once again) last year, ending his season and, as it turned out, his tenure with the Blue Jays.

Lawrie plays baseball as though he’s being chased by an enraged Sumatran tiger. In his first brief season in the bigs (when, incidentally, he replaced Encarnacion as the Jays’ starting third baseman) this paid off with a .293/.373/.580 slash line.  Since then, however, he has been unable to translate all that energy into baseball achievement. That kind of intensity can wear thin unless it’s backed by production, and Lawrie’s rate stats have gone generally backwards since 2011. He’s had a fractured finger, repeated oblique injuries, and a bad slide into second, among other injuries.  Lawrie blames the turf at Rogers Centre, but the turf lawyered up, and Lawrie’s case proved at best inconclusive.

As the career paths of Encarnacion and Gordon suggest,  one way to resuscitate Lawrie’s bat might be to move him to the left end of the defensive spectrum. That won’t happen in Oakland; after the Donaldson trade the A’s third base depth chart (Renato Nunez aside) looks like the Fallujah skyline. Billy Beane has little incentive to try Lawrie anywhere other than third. And maybe it will work. The hopeful comp here might be Gary Gaetti, whose stat line through age 24 (1981-1983) looks similar to the other guys in this post, viz:

1241 PA, .237/.293/.428, 94 OPS+

But Gaetti was already a superior defender, and became a durable, full time starter at age 23. His plate appearances are light because he only had a shotglass of coffee in 1981.

Gaetti was good. Real good: a 42 WAR career during which he amassed 2,280 hits and 360 homers while adding defensive value almost right up to the end. It’s certainly worth Beane’s time to see if he has that kind of player on his roster, especially since it appears that the A’s are going to be running a talent show rather than a pennant race next season. My guess is that if Lawrie develops at third, he’ll have slightly more bat and slightly less glove than Gaetti, though to be fair, both men had exactly the same career minor league OPS (.851).

It’s less clear whether participating in this particular rat race is the best outcome for Lawrie. Like E5 and Gordon, he might be better served by moving to a safer corner where he can concentrate on developing his offensive skills without placing his body’s soft tissue in excessive danger. I’m sure if you asked him he’d say he wants to stay at third. My guess is that Encarnacion and Gordon once thought that way too, and Lawrie’s career to this point looks more like theirs than Gaetti’s.

Brett Lawrie, like Repo Man, is always intense. I have a hard time not rooting for him; he attacks his job with an explosive, exuberant passion that would get me (and probably you) fired. I want him to succeed. I’m not at all sure he will.
Adjusting to the New Reality

Adjusting to the New Reality

The level of offense in baseball has been dropping for some time now. In the 1980s and into the early 1990s, teams scored around 4.3 runs/game (with the exception of 1987, when offense jumped up to 4.7 runs/game for one year, then went right back down in 1988). Offense started to rise in 1993 and first jumped over 5 runs/game in 1996. Run-scoring peaked at 5.1 runs/game in 2000, then leveled off to around 4.8 runs/game through 2007. Since 2008, offense has gone down steadily, with 2014 seeing an average of 4.1 runs/game. You have to go back to 1981 to find fewer runs per game in baseball (4.0 runs/game).

This has implications in the world of fantasy baseball. Consider the table below that shows the ERA in Major League Baseball by year, going back to 2001:

YEAR ERA
2001 4.42
2002 4.28
2003 4.40
2004 4.46
2005 4.29
2006 4.53
2007 4.47
2008 4.32
2009 4.32
2010 4.08
2011 3.94
2012 4.01
2013 3.87
2014 3.74


Some would point to PED testing for the lower level of offense, some would blame a bigger strike zone, some would peg it on the increasing number of relievers throwing 95+ for an inning or two. Whatever the reason, this is the new reality and sometimes it can be hard to adjust to new realities.

Let’s look at the numbers shown above in more detail.

Over the stretch of years from 2001 to 2009, MLB had an ERA of 4.39. Over the three-year stretch from 2010 to 2012, ERA dropped to 4.01. The last two years have seen big drops each year, from 4.01 to 3.87, to 3.74.

This has repercussions in fantasy baseball. With ERA dropping quickly, we need to reevaluate the pitchers we take on draft day and during the season.

Let’s go back to 2009, when MLB had an ERA of 4.32. The top 60 starting pitchers in ERA (minimum of 160 IP) combined for an ERA of 3.54. The median ERA for this top 60 was 3.77. There were 11 pitchers with an ERA under 3.00.

Fast forward to 2014. Last year, MLB had an ERA of 3.74. The top 60 starting pitchers in ERA (minimum of 160 IP) combined for an ERA of 3.14. The median ERA for this group was 3.33. There were 22 pitchers with an ERA under 3.00.

2009 2014
ERA in MLB 4.32 3.74
ERA of Top 60 3.54 3.13
Median ERA of Top 60 3.77 3.33
Pitchers under 3.00 11 22


In 2009, the median guy in the top 60 was someone like John Danks (3.77) or Jarrod Washburn (3.78). Last year, the median guys in the top 60 were Jose Quintana (3.32) and Chris Archer (3.33). [Caveat: I know ERA isn’t the only way to judge a pitcher in fantasy baseball. I’m keeping it simple.]

Six years ago, when scouring the waiver wire, that pitcher with a 4.00 ERA was a potential pick-up. These days, you don’t want to look at that guy, he’ll just hurt your team. This may seem obvious, but it really is a change in mindset when you’re looking to improve your team. What we once thought was good is no longer good.

One of the side effects of a big drop in the run environment is the difficulty for projection systems to keep up. If we go back to the 2010 season, we can see a stark example. If a pitcher had league average ERAs in 2007 (4.47), 2008 (4.32), and 2009 (4.32), we could do a simple 3/2/1 weighted average for his three seasons and project an ERA of 4.35 for 2010. League-wide, though, ERA dropped from 4.32 in 2009 to 4.08 in 2010. Most projection systems will project ERAs that will be in line with the previous few seasons’ run environment. In this case, the projections will be well above what the actual ERAs were for the 2010 season (unless a projection system can anticipate such a drop in offense).

Let’s do the same for more recent seasons. If we take a pitcher with league average ERAs in 2011 (3.94), 2012 (4.01), and 2013 (3.87), and do a simple 3/2/1 weighted average, we get a 2014 projection of 3.93. The actual ERA in MLB in 2014 was 3.74, so pitchers as a group are going to be forecast with ERAs around 0.20 higher because the drop in offense was so drastic.

With this in mind, I looked at last year’s projections from four systems: Steamer, ZiPS, Davenport, and Oliver. I looked at all pitchers who were projected by each of the four systems who pitched 30 or more innings in 2014. There were 326 pitchers in this group and they finished 2014 with a combined ERA of 3.58. You can see how each of the projection systems forecast these players prior to the 2014 season:

2014 SEASON
Actual ERA 3.58
Davenport projection 3.76
Oliver projection 3.81
ZiPS projection 3.90
Steamer projection 3.91


When looking at the data, what you shouldn’t do is say that Davenport had the best projections. What is true is that Davenport best anticipated the run environment. Looking at the table, it would be easy to assume that Davenport and Oliver had the best projections, as they were closest to the actual ERA of this group of pitchers. In reality, if you are trying to assess which system better projected individual players, you would first want to adjust them all to the actual run environment, then compare the differences between projected ERA and actual ERA for individual pitchers.

In the case of the 326 pitchers used above, the table below shows the average absolute difference in actual ERA and projected ERA for each individual pitcher, using projections adjusted to the run environment of this group of pitchers.

Adjusted Projections
System AvgAbsDiff
Steamer 0.85
Davenport 0.86
Oliver 0.88
ZiPS 0.90


Looking at it this way, it’s easy to see that the different projection systems were very close on this group of 326 pitchers and Davenport and Oliver are in the middle of the pack, with Steamer moving from the bottom to the top.

What does this mean for 2015? If you’re the type of fantasy baseball player who likes to create your own projections by combining projections from other sources, you will first want to know what level of offense those projections are expecting (ERA in this example). If you think 2015 will be much like 2014 (3.74 league-wide ERA) but the projections expect an ERA much higher or lower, you should adjust all pitchers by the amount the projections are high or low. With these new adjusted projections, you can now combine your projections.

As an example, I took those same 326 pitchers from above and compared their actual combined ERA from 2014 to their 2015 Steamer projections. This group of pitchers had a combined ERA of 3.58 in 2014. Steamer is projecting them to have a 3.84 ERA in 2015. The difference is 0.26 in ERA. I don’t know the run environment Steamer is basing their projections on, but this would suggest that it’s higher than what we saw in 2014.

Based on the disclaimer that accompanies each team’s ZiPS projections, we know that ZiPS is projecting based on the AL having an ERA of 3.93 and the NL having an ERA of 3.75. This would be a slight increase from the 2014 season (AL: 3.82 ERA, NL: 3.66 ERA) and is, essentially, a 3/2/1 weighted average from 2012, 2013, and 2014.

I looked at the starting rotations for the five teams that we have ZiPS projections for so far. There are 25 pitchers and they are projected by ZiPS to pitch 3985 innings with a 3.73 ERA. These same 25 pitchers are projected by Steamer to pitcher 4039 innings with a 3.98 ERA. Steamer is high by 0.25. Steamer projects higher ERAs for 23 of these 25 pitchers. This is a small sample of just 25 pitchers, but it would appear that you will want to adjust the Steamer pitching projections down if you do any sort of combining of projections in your fantasy baseball prep.

In addition, if you’re in a keeper league and have access to last year’s data for your league, you may want to project your keepers and potential additions for 2015 and compare your team projections to last year’s stat categories. This way, you will have an idea of how competitive your team will be. For example, I’m in an 18-team, 25-man roster league. We have nine starters on offense, four starting pitchers, and two relievers in our active lineups, and a 10-man bench that can be made up of players from any position. Teams in this league averaged around 1000 innings last season, so when I create projections, I can plug in the stats for my keepers and potential additions to see how my team looks for the upcoming season. In order to compare my projected 2015 team to 2014 stat categories, I want my projections to be adjusted to the level of offense of 2014 (in this case, ERA).

Offense in baseball has been dropping for a few years now. Successful fantasy players will have to adjust to this new reality when doing their pre-season prep work, on draft day, and when adding players from the waiver wire.


Will Neftali Feliz Be Back to Form in 2015?

On August 3, 2009, Neftali Feliz made his major league debut against the Athletics, pitching two perfect innings with four punchouts. In those innings, he mowed down hitters with 23 fastballs that averaged 99.45 mph, 4 changeups that averaged 91.13 mph, and 3 sliders that averaged 82.43 mph. He would end his rookie season with a 1.74 ERA (2.48 FP), a 33.3 K%, and a 6.8 BB%. As a 21 year-old, he already looked like a bonafide bullpen ace for the Rangers.

Fast forward to the end of spring training in 2014. Feliz is 25 years old and in the prime ages of his baseball career. And he’s starting in AAA. With a fastball that is 91-93 mph. Rangers’ General Manager Jon Daniels said of him, “He’s healthy and his work ethic has been solid, but he needs some work and the best place to get him that is in Round Rock right now. I expect he’ll be back as soon as he’s ready to help us.” A team whose bullpen for opening day included Seth Rosin thought that Feliz wasn’t ready to contribute for them out of the gate. Clearly something was off.

On August 1, 2012, Neftali Feliz underwent Tommy John surgery. Tommy John surgery generally requires at least 12 months for recovery, and he was back in the majors by September 2013. He averaged 94.19 mph with his fastball during his 6 games in September 2013. While his velocity was a step down from his 97+ mph heat in 2009-2011, pitchers often have to slowly build their arm strength up again to pre-surgery levels and there was no reason to believe he wasn’t on track to doing so. When his velocity failed to reach that level through most of his 2014 campaign, though, it became unclear if he would ever regain his pre-surgery stuff.

By some measures, his time in AAA was a success. He struck out 9.73 batters and walked only 2.51 per 9 innings. He produced a 3.14 ERA compared to the Pacific Coast League’s league-wide 4.64 ERA. His biggest problem was home runs—he gave up 6 in only 28.2 innings. When was he called back up to the major league squad on July 4, there were reasons to be cautiously optimistic that he could find some success again as a reliever. The Rangers noted that he was throwing in the mid 90’s some games while in others he would sit in the low 90’s.

Feliz didn’t exactly dominate during his early outings. Through July 23, he had pitched 10.1 innings with only 4 strikeouts, 3 walks, and 2 home runs given up. Yet, out of the playoff race, Texas dealt their closer Joakim Soria to the Tigers and anointed Feliz their new closer. While it’s possible that the team merely liked his shiny ERA at the time over his FIP (2.61 to 5.75), perhaps they started to see some signs of life in him. Regardless, his 1.69 ERA and 13 saves out of 14 save opportunities the rest of the way probably made them feel validated in their decision. With his end of the season performance, it appears likely that he will be the Rangers’ opening day closer.

Projecting into 2015, Feliz’s 4.90 FIP and -.1 WAR from 2014 provide red flags. His home run rate also look to be an issue. His extreme flyball tendencies (51.1 FB% versus 27.3 GB%) resulted in 1.42 HR per 9 innings despite a fairly ordinary 11.1 HR/FB% rate. His 17.2 K% and 9 BB% doesn’t exactly inspire confidence, either. Steamer isn’t a fan and projects him for .1 WAR in 65 innings.

But there are reasons for optimism, too. He kept up his low BABIP streak at .176 (.215 career) thanks to his impressive 20 IFFB% (17.8 career). Among relievers with 200 innings since his debut, he has the lowest BABIP, the 6th lowest LD%, and the highest IFFB%. Steamer projects him for a .284 BABIP next year, but I’m willing to bet his will be much lower than that figure and will continue to let him beat his FIP by around a full run.

Next, we’ll look at his home run rate. His 2014 figure was the highest of his career, caused primarily by his 11.1 HR/FB% (6.9 career). What may have caused that? Well, it may have been caused at least in part by his changeup. A changeup is a pitch designed to fool hitters who are looking for a fastball: it is supposed to be thrown with identical arm speed as the fastball to make it harder to pick up, and then its velocity and/or movement difference makes it effective. For a pitcher throwing in the upper 90’s with hitters already struggling to catch up to their fastball, a changeup may be less effective because the velocity reduction may sometimes help the hitter instead of hurting him (of course, there are exceptions). When Feliz was throwing in the upper 90’s in 2009-2011, he threw his changeup just 4.4 percent of the time. When Feliz was throwing in the low to mid 90’s in 2014, he threw his changeup 12.4 percent of the time. For his career, opponents have a .212 ISO against his changeup compared to a .119 ISO against his fastball.  In 2014, hitters had a .429 ISO against the pitch, including 3 of his 5 home runs given up on the year.

His velocity provided another reason for optimism as well. While his early- to mid-season velocity wasn’t great, he improved as time went on: in July he averaged 92.88 mph; in August he averaged 93.7; and in September he averaged 95.81. The ISO against his fastball decreased each month as well (from .107 to .107 to .053), even as he increased his usage of his fastball (from 64.7% to 77.36 to 77.78).  His velocity increase had an added bonus as well: it allowed him to use his changeup less (from 14.72% to 11.32 to 3.17). The biggest question is whether he can maintain his September velocity, or even improve upon it.

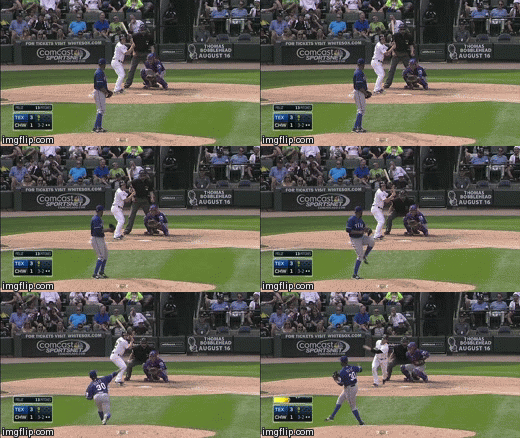
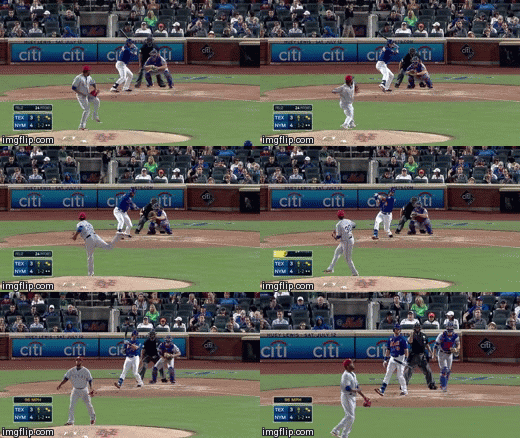
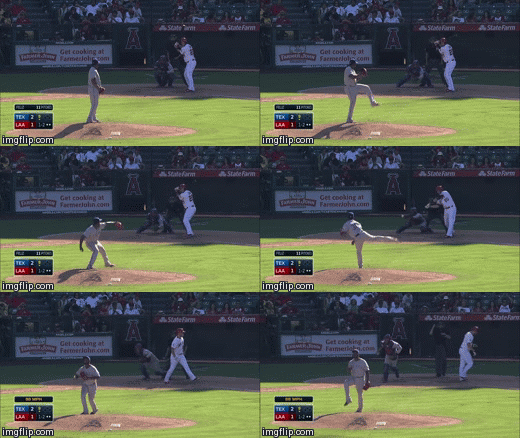
Overall, I don’t think Neftali Feliz is a safe bet to be great in 2015. But I do think that he has a real chance to be much better than the projections project him to be. To end this post, I’ll post a few gifs of Feliz at his best in 2014:

* All pitch usage, velocity, and movement numbers are obtained from Brooks Baseball. All pitch results numbers are obtained from Baseball Savant.


Giants Shouldn’t Overspend on Headley

When the Red Sox locked up Pablo Sandoval a few weeks ago, Giants fans immediately began to wonder who San Francisco would turn to at third base. After all, Sandoval had just wrapped up his seventh season with the Giants, and the Panda had become a fan favorite for his postseason success. With a free agent market saturated with several bench pieces and only one legitimate option in Chase Headley, the Giants began to focus on Headley as a potential replacement. With Headley seeking a four-year deal, worth close to $50 million, the Giants have to ask themselves, is this the best option?

No.

While Sandoval will always be a beloved figure in the Bay Area, let’s not overestimate his value with the club. From 2009-2011, the Panda was worth 12 wins. His WAR over the next three years? 7.9.

Sandoval from 2009-2011:

.857 OPS, .198 ISO, 129 wRC+

Sandoval from 2012-2014:

.759 OPS, .144 ISO, 115 wRC+

Whether or not the Red Sox overpaid on Sandoval is a discussion for another day, so let’s focus on the Giants’ potential options here. If Opening Day was tomorrow, Bruce Bochy would have to decide between Marco Scutaro and Joaquin Arias as his starter at third base. Scutaro, entering his age 39 season, is coming off a major back injury that limited him to just 5 games in 2014. On top of that, Scutaro has made just 15 starts at third base since 2008, and all 15 of those came in 2012. Arias adds some intriguing value in more of a platoon role, but we’ll get to that later. Now let’s take a look at the Giants’ top option on the free agent market, Chase Headley.

Defensively, Headley is widely regarded as one of the top performers in all of baseball. For his career, Headley boasts a 10.8 UZR/150, along with a 2014 season that included 13 DRS, second only to Josh Donaldson’s 20 DRS among AL third basemen. Everyone knows of Headley’s breakout season in 2012: .874 OPS, 31 HR, 145 wRC+, 7.2 (!!!) WAR, and everyone is just as quick to point out the downfall in the next two seasons. But Headley hasn’t been that bad.

Headley in 2013 and 2014:

.725 OPS, 26 HR, 109 wRC+, 8.0 WAR

As we have always known with Headley, his defense increases his value. In 2012, it was merely an afterthought to a career season at the plate. Headley would add solid production the Giants’ lineup, but could they get similar production at a cheaper cost? One step towards that would involve a trade with a team that will break in a top prospect at third base at some point in 2015. Enter the Chicago Cubs and Luis Valbuena.

Valbuena, who will soon be replaced by top prospect Kris Bryant, is projected to make somewhere in the neighborhood of $3 million in 2015. He would make an excellent platoon partner with Arias, for a total of $5 million, or half the price of Chase Headley. But why go with these platoon players when you can add a proven everyday guy in Headley? Because the Giants could use the money to help pay for improvements elsewhere, such as left field, or the starting rotation. They could even save the Headley money for the 2016 season, when the Giants lose over $40 million in annual salaries to the likes of Tim Lincecum, Tim Hudson, Jeremy Affeldt and Scutaro. But a platoon of Valbuena and Arias is not just half the price, it’s equal the production. Let’s take a look:

vs RHP in 2014:

Headley .690 OPS, 99 wRC+

Valbuena .811 OPS, 124 wRC+

vs LHP in 2014:

Headley .721 OPS, 110 wRC+

Arias .720 OPS, 107 wRC+

Now it is worth noting that Headley’s ISO was very consistent from both sides, posting a .130 vs RHP and a .132 vs LHP. Valbuena posted a .208 ISO vs RHP, while Arias was just .076 vs LHP. If the Giants did choose this platoon, the power would be limited from Arias. But what about the defense from each player?

Career UZR/150

Headley 10.8 (6,366.2 innings)

Valbuena 10.2 (2438.2 innings)

Arias 15.6 (800.1 innings)

Even when you combine Valbuena and Arias, the total time at third base is roughly half the time Headley has seen at the MLB level. With that being said, both are very good defenders at third base.

Would a platoon of Valbuena and Arias produce better results than Chase Headley in 2015? Maybe, maybe not. But it is very possible that the Giants get equal the production, at half the price, and spend some of that extra money elsewhere. Maybe the extra $5-6 million lands them a pitcher they couldn’t quite afford if they had Headley under contract? Maybe it helps them make space for a Justin Upton in left field in 2015? Either way, the Giants would be wise to find a cheaper option at third base.


The Mariners’ Deficiency

This trade, at least in its basic terms, has been well covered. I personally don’t believe that one of these players is really any better than the other, not in any significant sense. The Mariners gave away a roughly league-average player and received a roughly league-average player in return, but as a result paid a penalty in salary and in team control — for essentially no reason. Jeff has gone over all of that on two different websites. It’s a nice deal for the Jays. It’s less than that for Seattle.

Where it gets ugly is at the far periphery, the tertiary implications of this deal that, on its face, really indict a disparity between the Mariners’ front office and the rest of baseball.

The Mariners now need a right fielder, having just traded theirs. A right fielder is an everyday player theoretically assigned for about 1500 defensive innings and 700 plate appearances; and therefore someone who will be competing, on average, against a very high threshold of performance. From 2012-2014, the average full-time right fielder produced 2.6 WAR/600 per FanGraphs. The market price for 2.6 WAR, at the established pre-season price of $7M/win, is approximately $18M. This is about in line with what’s been observed to date. The 2015 cost of these players on the open market:

Player Projected WAR 2015 Salary (M) $/Win Additional Costs
Hanley Ramirez 3.6 $22.00 $6.11 2nd Rd. Pick, length
Victor Martinez 2.7 $17.00 $6.30 1st Rd. pick, length
Nelson Cruz 1.5 $14.50 $9.67 1st Rd. Pick, length
Nick Markakis 1.5 $11.00 $7.33 length
Torii Hunter 1.7 $10.50 $6.18 None
Jason Heyward 5.0 $7.80 $1.56 Shelby Miller, tm. control
Justin Upton 3.0 $14.50 $4.83 ???

In order to obtain someone to meet this threshold, you have to pay. You have to pay a lot. Nick Markakis just signed for 4 years and $44M. Nelson Cruz signed for $57M to knock out just one half of the workload, also costing a draft selection. Victor Martinez signed for $68M to knock out just one half of the workload. He didn’t cost the Tigers a draft selection, but that’s unique to the Tigers. For someone who can do it all, you’re looking at Hanley Ramirez, and then you’re looking at nine figures. The $/win for the four free agents above is $7.12M. Their average salary for 2015 is $15.0M for 2.2 WAR. Four of the five signed for 4 years or more, the exception being Torii Hunter, who is likely to retire.

The Blue Jays now need a #5 starter, having just traded theirs. A #5 starter starts more-or-less every 5 days. About once every 4 or 5 weeks, his start might be skipped thanks to an off day. An average #5 starter makes roughly 30 starts for roughly 180 innings per year. On average, this type of pitcher meets a very low threshold of performance. From 2012-2014, there have been 257 qualifying seasons for starting pitchers. The average performance of this group is 2.7 WAR/200 IP. Population sections of 20% amount to 51 or 52 individuals per section, the lowest ranked section theoretically accounting for the #5 slot. The average performance of this section is 0.9 WAR/200 IP. At the established pre-season price of $7M/win, the market price for 0.9 WAR is approximately $6.5M. The cost of these players on the open market:

Player Projected WAR 2015 Salary (M) $/Win Additional Costs
Colby Lewis 0.6 $4.00 $6.67 None
JA Happ** 1.2 $6.70 $5.58 Michael Saunders, tm. cont
AJ Burnett 1.7 $10.00 $5.88 None
Jerome Williams 0.4 $2.50 $6.25 None
Brad Mills None Minor League NA None
Jeff Francis None Minor League NA None

**Option picked up

To obtain players who can meet this threshold, you can generally pay fringe talents for 1-year deals or look to candidates from minor-league affiliates for league-minimum salaries. This position is not often filled by a singular person, as teams rarely have that many reliable starters on a roster due either to scarcity or to budgetary constraints. The Mariners themselves filled their 5-slot in 2014 with a combination of Erasmo Ramirez, Blake Beavan and Brandon Maurer, winning 87 games. This is not uncommon. The Orioles, Angels and Athletics all employed variations of this theme.

The average $/win for the above free agents given guarantees is $6.3M. The average guaranteed salary for 2015 is $5.8M. None of these players is signed beyond 2015.

The Blue Jays took their high-cost need and exchanged it for a low-cost need, transferring the balance onto the Mariners.

This is not to say that the Blue Jays have to sign a #5 starter. If someone better presents themselves at a price they can incur, they absolutely have that option. But if they decide to follow the standard rotation model, that’s okay too, because most of baseball either does or has to. The penalty for playing down to the average #5 starter is relatively small.

The Mariners no longer have this luxury. There’s no such thing as a #5 right-fielder. If you were to place the terms of this concept on the right-field position, you’d have a replacement player, the penalty for which is a couple wins. The Mariners, at least in their position, can’t afford that.

This isn’t about obtaining talent for talent, salary for salary, years for years. This is about understanding your market, about being able to let your environment work for you. We don’t have to sugar-coat this. There are people who get it and people who don’t. Jack Zduriencik, for whatever reason, just doesn’t get it.

But the Mariners aren’t constrained to budget limitations in the way the A’s and Rays are. They don’t struggle in the draft the way the Yanks, Astros and White Sox do. The Mariners, for all of their issues, have a winning team with a young core to credit them, and Zduriencik has quite the hand in that. That his knack for strategy might be among the lower tier of his peers is a singular constraint among many working parts, and the hope is that the rest of the machine can overcome the deficiency — the same way a lot of teams do.

But I won’t blame you for cringing at what might be next. Their propensity for this kind of deal is matched only by their propensity to compound one mistake with another. And given their shiny new need, they may not have much of choice.


High-End Free Agents: Do They Exist?

A common refrain during this point in baseball’s calendar is that the free agent market isn’t what it used to be. The underlying premise is that more and more teams place more and more focus on locking up their young, talented players to long-term contract extensions.  In turn, fewer and fewer young and talented players are reaching free agency. With the free agent market drying up, teams must pay a significant premium for the few players that do reach free agency that are both relatively young and relatively talented. Ken Rosenthal highlighted this line of thinking in an article last year:

One of the game’s rising young stars recently told me he was concerned about the flurry of contract extensions in baseball. The player didn’t want to be identified, but his thoughts intrigued me, in no small part because he is a candidate for an extension himself. The player’s point was this: Free agency helped make the players union into a powerhouse. But now, with fewer top players reaching free agency, who is going to drive the top of the market? Shouldn’t players feel a sense of responsibility to those who came before them and those who will follow? Fair questions, particularly if you look at the next two free-agent classes, which are almost devoid of stars. But when I expressed the player’s concerns to the head of the union, Michael Weiner, and a prominent agent, Scott Boras, I didn’t get the answers I expected. Neither views the trend as necessarily a problem.

But is this really a trend at all? Let’s look at that question more closely. Let’s begin by looking at the 2014-2015 crop of free agents.  Baseball Reference has a list that is published here. As of this writing, that list contains 306 players. These 306 players have an average age of 31.6 and a median age of 31.0. The average WAR is at 5.54, which reflects outliers at the high end (like Ichiro and Jason Giambi); the median WAR for these 306 players is only 1.90. Of these 306, there are only six players that both (a) are 30 years old or younger (using Baseball Reference’s midpoint method to calculate ages, this is the age the player will be on July 1 of the next season), and (b) have achieved 12 wins above replacement in their career. These six players, in order of descending career WAR, are (i) Pablo Sandoval, (ii) Billy Butler, (iii) Asdrubal Cabrera, (iv) Melky Cabrera, (v) Colby Rasmus, and (vi) Max Scherzer.

If you are general manager looking to fill multiple holes in your roster, this is not the most inspiring group, especially when considering the cost of doing so. This group does reflect the current narrative — there does appear to be a dearth of high-end talent available on the free agent market. But how does this group compare to prior free agent cohorts? Has the free agent market really dried up, or has it always been dry?

Again, Baseball Reference is helpful. On its site, it lists the free agent signings for each year. For example, its list of 2013-2014 free agents is published here. Using the same criteria as before (30 or younger, and 12 career WAR or better), the 2013-2014 free agent crop had seven relatively young and relatively talented players: (i) Josh Johnson, (ii) Brian McCann, (iii) Jacoby Ellsbury, (iv) Ubaldo Jimenez, (v) Scott Kazmir, (vi) Chris Young (the hitter), and (vii) Matt Garza. Perhaps a bit better than 2014-2015, in general, but not markedly different. Looking back further, in summary fashion, here is a look at the free agent market during the ten seasons leading up to this one:

Total Number of Signings/Free Agents* Average Age Median Age Average WAR Median WAR Relatively Young and Relatively Talented (30 and younger; 12 bWAR or better)
2004 493 31.5 31 5.27 0.3 12
2005 420 31.5 31 5.03 0.5 6
2006 411 31.4 31 6.06 0.4 10
2007 391 31.3 31 5.41 0.4 1
2008 433 31.1 30 5.44 0.4 6
2009 443 31.2 31 5.14 0.6 6
2010 445 31.2 31 5.76 0.6 4
2011 417 31.3 31 5.46 0.6 7
2012 426 31.3 30 4.74 0.7 8
2013 413 31.1 31 4.96 0.9 7
2014 306 31.6 31 5.54 1.9 6

As for a list of the remaining names of the relatively young and relatively talented players appearing in the table above, they are:

2012-13:  Zack Greinke, Russell Martin, Michael Bourn, B.J. Upton, Melky Cabrera, Anibal Sanchez, Edwin Jackson, Stephen Drew

2011-12:  Jose Reyes, Grady Seizemore, Dontrelle Willis, Francisco Rodriguez, Aaron Hill, Prince Fielder, Kelly Johnson

2010-11:  Carl Crawford, Dontrelle Willis, Mark Prior, Jhonny Peralta

2009-10:Matt Holliday, Jon Garland, Rich Harden, Coco Crisp, Hank Blalock, Austin Kearns

2008-09:  CC Sabathia, Mark Teixeira, Jon Garland, Mark Prior, Francisco Rodriguez, Adam Dunn

2007-08:  Aaron Rowand

2006-07:  Barry Zito, Kerry Wood, Mark Mulder, Marcus Giles, Jeff Weaver, Wade Miller, Randy Wolf, Juan Pierre, Aramis Ramirez, Aubrey Huff

2005-06:  Rafael Furcal, Jeff Weaver, Wade Miller, Ramon Hernandez, Paul Konerko, A.J. Burnett

2004-05:  Carlos Beltran, J.D. Drew, Adrian Beltre, Troy Glaus, Edgar Renteria, Matt Morris, Richard Hidalgo, Eric Milton, Kevin Milwood, Placido Polanco, Wade Miller, Richie Sexson

What can we learn from looking at information from the ten free agent classes before this year’s free agent class?

  1. The free agent classes have looked very similar, on average, for the past ten years.
  2. Over the past ten years, free agency has not yielded the bumper crop of talent that has been suggested.  The locking up of young talent prior to free agency does not appear to be a recent trend.
  3. The appearance of high-end talent, particularly high-end talent in the fat part of an aging curve, is at best sporadic (occasionally yielding a young high-end bat, such as Carlos Beltran, Adrian Beltre, Matt Holliday, or Prince Fielder, but almost never a pitcher with his best years ahead).

Based on this look, it has always been difficult to find players in their prime on the free-agent market. They exist, but they are rare. This does not appear to be a new trend.* The number of free agents in 2014 does not include the players that have not been tendered a contract for arbitration. Once this group of non-tendered players become free agents this winter, it will both inflate the number of available free agents and depress the average and median WAR figures shown in the table.


A Gif-tastic Review of Arizona Fall League Pitching Prospects

Rogers Hornsby was once quoted as saying, “People ask me what I do in winter when there’s no baseball. I’ll tell you what I do. I stare out the window and wait for spring.”  While staring out of a window for several months may be a worthwhile way to spend our limited time on Earth, I wish to propose a marginally more enjoyable choice: watching gifs of top pitching prospects.

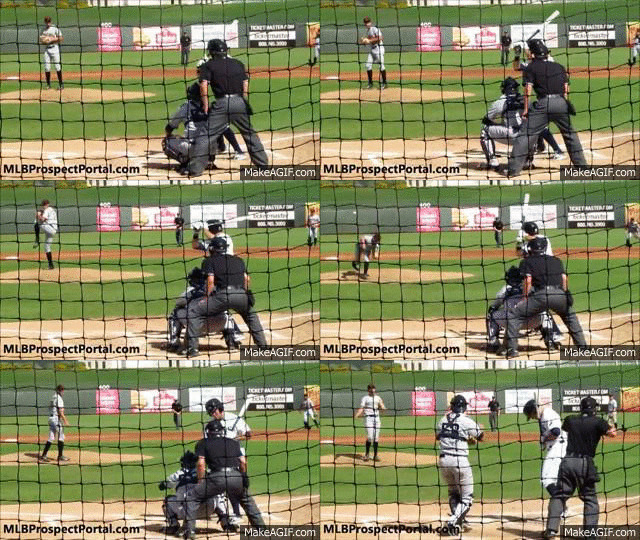
With the 2014 Arizona Fall League featuring several top pitching prospects, and with the plentiful high-quality videos posted on Youtube by our good friends at MLBProspectPortal.com, I was able to create a collection of gifs that showcase these pitchers’ talents.

Kyle Zimmer

Zimmer finished the AFL with an incredible 41.7 K%.  Unfortunately, due to injuries, he only made three starts.  When he has been healthy, though, he has been known to throw mid 90’s fastballs and biting curveballs.  Below is a gif of his curveball thrown to Pirates’ outfield prospect, Josh Bell.  It should be noted both that Bell missed this curveball by a lot, and that he rarely swings and misses versus left-handed pitchers (9.9 K% against them).

Kyle Zimmer 2014 AFL

In the pitch following the curveball, Zimmer threw a high fastball that Bell couldn’t catch up to:

http://cdn.makeagif.com/media/11-26-2014/M0iguz.gif

In the pitch following the curveball/fastball combination, Zimmer threw either a changeup or two-seam fastball that had Bell out in front:

http://cdn.makeagif.com/media/11-26-2014/DmBK3j.gif

Tyrell Jenkins

A former 1st round supplemental draft pick by the Cardinals in 2010, Tyrell’s statistics have been erratic in the minors, including his 13.3 K%/7.4 BB%/4.31 FIP in High A in 2014.  His athletic frame and power stuff are still coveted, though, and the Braves acquired him in the recent Jason Heyward trade.  Below is a curveball from Jenkins to Addison Russell, who happens to be one of the top prospects in all of baseball:

http://cdn.makeagif.com/media/11-26-2014/CFVYNx.gif

Below is a high fastball to Dalton Pompey that resulted in a strikeout.

http://cdn.makeagif.com/media/11-26-2014/mPI9aR.gif

Archie Bradley

Archie Bradley is likely the most well-known name on this list, and some sources had him as the #1 pitching prospect entering this season. FanGraphs’ own Kiley McDaniel gave him a future 70 grade on his fastball, along with a future grade of 65 on his curveball.  Below is one such curveball thrown to Addison Russell:

http://cdn.makeagif.com/media/11-26-2014/g_VnqS.gif

Not content to merely acquire a strikeout against Russell, Bradley went with his fastball with good arm-side run to create a double play-inducing weak grounder:

http://cdn.makeagif.com/media/11-26-2014/r52BEN.gif

Tyler Glasnow

Tyler Glasnow posted a league-leading 31.9 K% and .171 opposing batting average  in 2014 in High A.  The third highest K% in the FSL was 23%, and the second lowest opposing batting average was .216.  These numbers may seem incredible to you, but they’re actually a step down from his 2013 season in Low A where he posted a 36.3 K% and a .141 opposing batting average.  You may have guessed that Glasnow has good stuff.  You’d be right.

Below, the batter sticks his bat out for a bunt and then spins back as if the pitch were going to hit him.  It was called a strike.

http://cdn.makeagif.com/media/11-26-2014/p2TYOo.gif

Finally, we have a called strike three on a curveball.  Notice the defeatism in the batter.; he has been bested by the pitcher but is glad that he has been allowed to keep his life.

http://cdn.makeagif.com/media/11-26-2014/FkmhjH.gif

*Credit for all of the videos goes to MLBProspectPortal.com.


Mike Trout, Out of Context

Recently, Mike Trout was officially named the Most Valuable Player in the American League. To celebrate, let’s take Trout out of context and put him in a new one.

Part of the reason many fans believed Trout was more valuable than Miguel Cabrera in 2012 and 2013 was his home park. Angel Stadium is a pitcher’s park, whereas Comerica Park in Detroit is pretty average for hitters. In 2012, when Trout won AL Rookie of the Year but finished behind Cabrera for AL MVP, park effects played a huge, obvious role in the voting results. If you take out the home field and just look at road games, Trout’s batting average, on-base percentage, and slugging percentage were all better than Cabrera’s:

Cabrera:         .327 / .384 / .529
Trout:             .332 / .407 / .544

Furthermore, this is a tough time to objectively evaluate hitters. Offensive production isn’t nearly at the level it was five or ten years ago, so stats that would’ve looked pedestrian in 2004 now lead the league. It’s tough to appreciate the greatness of a young player like Trout in a depressed offensive environment. So let’s take Mike Trout out of that environment and put him in a better one: Coors Field. From 1998-2001.

Using the Neutralized Batting tool at Baseball-Reference, I moved Mike Trout’s career back in time by 13 seasons and put him on the Colorado Rockies. Here are the horrifying numbers this produced:

Year Age G PA AB R H 2B 3B HR RBI
1998/2001 19 40 145 130 29 34 7 0 6 23
1999/2012 20 139 728 623 207 246 36 11 40 133
2000/2013 21 157 834 661 179 262 54 13 38 159
2001/2014 22 157 782 652 172 223 51 12 46 166
TOTAL   493 2489 2066 587 765 148 36 130 481

You’ll notice that in Trout’s rookie season (1999/2012), he broke Billy Hamilton‘s century-old single-season record for runs scored. The following year, he made 834 plate appearances and tied Ichiro Suzuki’s single-season hits record, while pounding out 105 extra-base hits. This past season was his third straight with 220 hits, and he drove in 166 runs. He has a combined 338-340 runs + RBI in each full season. More stats:

Year Age G PA SB BB TB BA OBP SLG OPS
1998/2011 19 40 145 5 12 59 .262 .331 .454 .785
1999/2012 20 139 728 67 90 424 .395 .473 .681 1.154
2000/2013 21 157 834 45 152 456 .396 .512 .690 1.202
2001/2014 22 157 782 20 107 436 .342 .439 .669 1.108
TOTAL   493 2489 137 361 1375 .370 .467 .666 1.132

Let’s get right to the point here: Coors Field Mike Trout has a slugging percentage of .666, because this version of the man is obviously the devil (or possibly Ty Cobb). His career slash line is .370/.467/.666, for an OPS of 1.132. He stole 67 bases as a rookie, batting .395. For an encore the next season, he walked 152 times and still gained 456 total bases. This was possible because he hit .396/.512/.690. This most recent season (the MVP year) was comparably pedestrian, but it was his third straight season with over 420 total bases.

The 2000/2013 season is particularly nuts. Trout made 834 PA, so that’s obviously part of it, but he had 262 hits and 152 walks (plus 13 HBP). That’s 427 times on base. No, seriously.

And this is just batting. Other than the stolen bases, we haven’t said anything about his (excellent) baserunning, or his defense, which was sensational in 2012. Trout is a great player in any context, but in pre-humidor Coors Field, he is a terrifying offensive force. Congratulations, Mr. Trout.


Maybe Cano Money Is Not Unreasonable for Heyward

Yesterday, Dave wrote an article about Jason Heyward’s next contract, and concluded with the idea that his next contract would almost definitely start with a two, and might even touch into the threes. When I suggested this to some of my friends they claimed that Heyward was not worth that price and completely disregarded the argument. This got me to thinking about what it would look like if we follow the projections.

After some great help from Neil and Jeff to get help with projections, I decided to try to tackle the question on my own. I started looking at Heyward’s WAR starting in 2016 (the first year of his next contract) and project that moving forward.

To start, I’m going to assume the value of a win next off-season will be roughly $6.3m ($6m this year with a 5 percent increase). Every year after that will go up by 5 percent through the end of the contract. Perhaps this isn’t the best way to go about this, but it is an idea that I have seen suggested several times.

After that, I went into the projections. Steamer projects Heyward to produce 4.4 wins next season, and (following the advice of Jeff and Neil), I assumed he would produce 4.4 wins every season from age-26 to 30 seasons, at which point I started taking a half-win off each following season until the tenth (and final) year of the proposed contract. In the end, Heyward projects to provide about 36.5 wins from 2016 to 2025.

Now that we have set up the parameters, we can get into the actual money of the deal. To find the value of each season I multiplied the WAR for an individual season by the dollars/WAR value for each season. Heyward’s value by season projects to go: $27.7m, $29.1m, $30.6m, $32.1m, $33.7m, $31.4m, $28.7m, $25.7m, $22.3m and $18.6m, for a total of $279.8 million over the ten seasons.

I know a lot of people are not quite as high on Heyward as I (and Steamer, apparently) am, so I also ran the numbers if Heyward produces 4 wins from 26-30, then a half-win less for each season after that. If that were to happen, Heyward would produce about 32.5 wins that would be valued at roughly $248 million.

Without assuming any breakout seasons, and even including the possibility that Heyward regresses a little before plateauing, he still projects to be worth over $225 million, and potentially in the neighborhood of $275 million without a breakout season in 2015. Heyward looks like he might be the guy that makes people realize that $200 million in today’s game isn’t what it used to be.


Will Maddon Matter?

Click here. Ok, now, click here. Uncanny, isn’t it? What are the odds that two Cubs’ figures of historic significance would both be white-haired men who wear black-rimmed glasses? This is further proof, as if any were needed, that forces beyond human ken are shaping the Cubs’ destiny.

Unfortunately, assessing the impact of a manager on a team has also remained largely beyond human ken. There may come a time when we can define a replacement-level manager (like, say, #Yosted), and come up with an accompanying performance metric (Wins Above Yost, or WAY). But that time has not yet arrived, so we must make do with the primitive tools at hand.  These do indeed suggest that Maddon gets it, though, as is often true in using statistics to assess a manager’s performance, it can be hard to separate the manager’s performance from that of the players.

Maddon managed the Tampa Bay (Sometimes Devil) Rays from 2006-2014, so he has a relatively long record to examine.  During that time the Rays accumulated 55,830 plate appearances, 15th out of 30 MLB teams. But Maddon did not allow those PAs to be distributed randomly:


Situation                         Rank

L vs. L                                12

R vs. R                               22

L  vs. R                                8

R  vs. L                                8

Joe knows platoons; the Rays frequently obtained the platoon advantage during his tenure. Carl Crawford partly explains the relatively high L-L rank — Maddon did not platoon Crawford even though his splits would have warranted such treatment after 2007.

Maddon also aggressively used pinch-hitters, a rarity in an era when managers pinch-hit for anyone other than a pitcher with the enthusiasm of a cat taking a bath. During the Maddon Years, the Rays led the AL in pinch-hitting PAs, and it wasn’t even close:

Rays                  1249

Evil Empire       946

A’s                        934

Blue Jays            908

Red Sox               833

The least pinch-hitty team in the NL during this period, the Astros, had 2100 pinch hit PAs, so Maddon wasn’t behaving exactly like an NL manager, but he pushed that envelope farther than any of his DH-league brethren. (It’s also interesting to note that 4 of the top 5 pinch-hitting AL teams hailed from the AL East, though what use one might make of this interesting information is far from clear.) And while activity is often confused with achievement, Joe’s tinkering produced results: the Rays were 8th in wRC+ for pinch-hitters during his tenure.

Baserunning is another area where the manager can exert tangible influence, and this is another area where the Rays score high. From 2006-2014 the Rays were second in the majors, behind only the Mets, in BsR, a metric that expresses stolen bases, caught stealing, and other baserunning plays as runs above or below average.

Team            BsR 2006-2014

Mets                      74.2

Rays                      73.9

Rangers                71.3

Twins                    56.4

Angels                   55.4

As you might guess, Crawford drove a lot of this success. The Rays are just 8th in BsR in the Post Perfect Storm Era (2011-2014), good but no longer elite. And what of that Ebola of hitting, the sacrifice bunt? By and large, Joe let ’em swing — the Rays were 26th in sac hits during his reign.

So as far as the hitters are concerned, Maddon is the model of the modern majors manager. His pitching deployment, however, has a bit more of a retro feel:

Pitchers             MLB innings rank 2006-2014

All Rays                                  15

Starters                                    7

Relievers                                25

“Aha!” you say. “That’s because Rays relievers have needed pine tar to succeed.” Perhaps — from 2006-2014 Rays starters and relievers have amassed nearly the same FIP- (102 for the starters, 101 for the relievers). But on second glance that reliever FIP- does suggest that the Rays should have been purchasing pine tar at Big Lots — it is 5th from the bottom in the majors during this period, while the Rays rank 15th in starter FIP-. In addition, although the FIP- figure doesn’t necessarily demonstrate this, the Rays have obviously had some excellent starters, such as James Shields and David Price, capable of working deep into games.

Maddon’s pitchers have not performed well in high leverage situations, which generally include late, close games:

Leverage           MLB FIP rank

High                          21

Medium                    14

Low                            10

The list looks upside down; most managers would want their best pitching effort when it matters most. It doesn’t appear, based on this admittedly limited data, that Maddon has been able to be as creative with pitchers as he has with hitters, but some of this may simply be a reflection of the Rays’ spotty bullpen quality. On the clearly positive side, Maddon was able to stem the march of Intentional Walk Zombies, with the Rays ranking just 23rd in IBBs during his time in Tampa.

No evaluation of Joe Maddon would be complete without a discussion of defense. He embraced aggressive shifts earlier and oftener than most, with apparently impressive results. Tampa Bay was first in UZR/150 during Maddon’s tenure, and third in Def. The Rays fare less well in Defensive Runs Saved, but still rank 9th during the period. (If you’re curious about how these stats work, I urge you to click on the links — my grasp of defensive metrics is pretty feeble, and the approach I usually take is to use several different ones to answer a defensive question and see if they produce similar results, which in this case they generally do.)

So based on admittedly less than decisive evidence, and bearing in mind that much of any manager’s achievement or lack thereof is down to the players’ talent rather than the manager’s aptitude, it appears that Maddon makes decisions reasonably designed to help his team win games,  His task with the Cubs will differ in many ways from his experience in Tampa Bay. One of the most significant differences is that he’s likely to have a better bullpen, and likely to need it more. Even if the Cubs add two Big Name Horses, the rotation will still have question marks, and this will be true even if Jake Arrieta’s deal with the devil has another year to run. For somewhere around 15-20 home games, Wrigley Field will play like Ebbets Field, a challenge that Maddon didn’t have to deal with in the Logan’s Run-like controlled atmosphere in The Trop, and one that will put his bullpen management skills to their sternest test. He appears to be someone at least as eager to learn as to teach, and the prospect of being known as The Curseslayer will surely be motivation for him to continue evolving.

Maddon’s arrival on the shores of Lake Michigan was not without controversy. There’s little doubt that Rick Renteria got jobbed (or rather, de-jobbed), even though the two players whose regression got Dale Sveum fired (Castro and Rizzo) had excellent bounceback seasons under him. The Cubs’ rank opportunism in dumping Skipperfriend 2.0 for SF 3.0 is matched only by the Rays’ pathetic shakedown dressed up as a tampering charge. A managerial tenure that might end like the EA Sports commercial has begun with several reminders that humans are indeed a predatory species. Not that there’s anything wrong with that.

In any case, flags fly forever, and few will have qualms about any of this moral relativism if indeed the Goat is consigned once and for all to Cthonian darkness. As far as Cubs fans are concerned, the message for now is: Glasses! Half full.