Archive for Uncategorized

Ode to Willie Bloomquist

After 14 years in the Major Leagues, longtime utility player Willie Bloomquist was designated for assignment by the Mariners on Thursday. If this is truly the end, you have to agree that Willie Bloomquist had an amazing career when you stop to think about it. He lasted 14 years in the big leagues, played in over 1000 games, had more than 3000 plate appearances, and finished his career with a grand total of 1.0 WAR. As Tom Tango has pointed out many times, Willie Bloomquist has been “Mr. Replacement Level” for many years.

The highest WAR Willie B ever had in one season was 0.7 and that came in a 12-game stint as a September call-up in his rookie year of 2002. He hit .455/.526/.576 that year, thanks in large part to a sky-high .484 BABIP. In his last seven games that season, Bloomquist had a four-hit game, two three-hit games, and two two-hit games. He was the Fred Lynn of the 2002 Mariners (with apologies to Fred Lynn). Lynn had a sizzling 15-game stint in September of 1974 when he hit .419/.490/.698. Lynn, of course, followed up that torrid September with a terrific .331/.401/.566 year in 1975, winning the Rookie of the Year award and the AL MVP. Bloomquist followed up his scalding cup of coffee by hitting .250/.317/.321 over 89 games in 2003.

Imagine if Bloomquist never had that incredible BABIP-fueled 12-games stretch at the start of his career. How much did those 12 games affect the Mariners’ opinion of him, perhaps leading to more opportunities than a career-long replacement level player would normally get? Would he have had the career he had if not for that 12-games stretch of hot hitting?

It seemed destined for Willie Bloomquist to play for the Seattle Mariners. He was originally drafted out of nearby South Kitsap High School in Port Orchard, Washington in the eighth round of the 1996 amateur draft, but he eschewed the Mariners’ offer to go to Arizona State University. With the Sun Devils, he was named ASU On Deck Circle Most Valuable Player, just like Dustin Pedroia, Ike Davis, Paul Lo Duca, and Barry Bonds. That’s like a Mount Rushmore of Arizona State MVPs, plus Willie Bloomquist. At ASU, Bloomquist hit .394, the third-highest batting average in school history, and was the first Sun Devil to have back-to-back seasons with 100 or more hits. College Willie Bloomquist was pretty damn good.

After his junior season, Bloomquist was again drafted by the Mariners, this time in the third round. He signed and began his career with the Everett Aquasox in the Northwest League. He hit .287/.366/.410 that year while primarily playing second base. One of his teammates on the 1999 Aquasox was a 17-year-old Australian named Chris Snelling. Snelling was the youngest player on the team but hit .306/.388/.498 and looked to have a bright future. Unfortunately, he turned out to be the anti-Willie Bloomquist. Snelling was like a meteor that flashed quickly across the sky and disappeared after just 93 games in the big leagues across five injury-marred seasons. Willie Bloomquist was a slow and permanent planet who played 1055 games over 14 years at slightly above replacement level.

In 2000, Bloomquist was moved up to the High-A Lancaster JetHawks in the California League. This was a hitter’s league, with teams averaging 5.3 runs per game. Bloomquist had his best season, hitting .379/.456/.523 with 22 steals in 64 games, then was bumped all the way up from High-A to AAA. He was clearly overmatched and struggled mightily as a 22-year-old in AAA, hitting .225/.249/.277.

In 2001, while the Mariners were winning an amazing 116 games, Bloomquist was sent down to AA and hit .255/.294/.310, although with a career-best 34 steals. Despite his struggles hitting AA pitching, the Mariners aggressively moved Bloomquist up to AAA in 2002. He hit .270/.331/.383, then had that amazing 12-game stretch in September and the legend of Willie B was born.

Being able to play multiple positions was a big part of the baseball longevity of Willie Bloomquist. The only position other than pitcher that he never played was catcher. He never once donned the “Tools of Ignorance” but played at least 47 games at every other position, finishing his career with a negative UZR at every position he ever played. That’s consistency, my friends.

Bloomquist played the first seven years of his career with the Seattle Mariners, hitting .263/.322/.324 over that stretch, good for a .291 wOBA and 76 wRC+. He usually filled in at multiple positions, playing 80 to 90 games per year. He was like that bachelor uncle that always shows up at the family reunion but doesn’t do anything particularly memorable. Crazy aunt Alice will get into a heated argument with cousin Ashley over her too-revealing tank top, while ancient grandpa Ray loudly complains about whomever is currently occupying the White House, but uncle Willie just sits off to the side, casually eating some chips and drinking his beer. Everyone agrees he’s a good guy and nice to have around. If they need someone to man the grill for an hour, Willie’s the guy. If you’ve got a game of horseshoes going, or Bocce Ball or Cornhole or badminton or Frolf, Willie’s game. He never seems to win but isn’t the worst one out there either. He’s just a reliable guy, like mashed potatoes but without the gravy. Sure, you’d much rather have the gravy with the mashed potatoes but you’ll settle for just the spuds if there’s not a better option.

Bloomquist joined the Mariners at the tail end of their last real good stretch of baseball. From 1995 to 2001, the Mariners made the playoffs four times in seven years. Those remain their only four playoff appearances ever. Then Willie Bloomquist showed up in 2002 and they haven’t made the playoffs since (not that it’s his fault). From 2002 to 2008, Willie Bloomquist was reliably Willie Bloomquistian. He never had fewer than 1 WAR or more than 1 WAR in a season. This would hold true for his entire career:
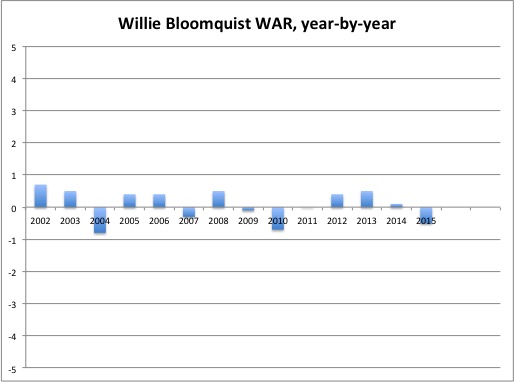
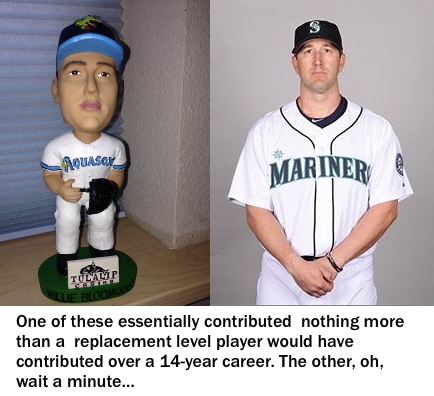
There’s that consistency again. Willie Bloomquist—reliably replacement level. Of course, minor league baseball promotions directors don’t care about WAR, so in 2004 the Everett Aquasox had Willie Bloomquist Bobblehead Doll Night. The resemblance is uncanny:
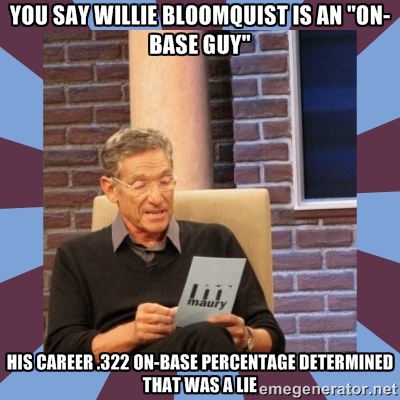
After the 2008 season, Willie B took his talents to Kansas City, signing a two-year, $3.1 million contract with the Royals as a free agent. Through six-plus years in the Major Leagues, Bloomquist had accumulated 1.4 WAR plus an unknown amount of intangibleness that likely added to his value. As Dayton Moore said at the time, “He’s an on-base guy, a speed-type player and a hustler. He’s a Craig Counsell-type player who really plays hard, hustles, and knows how to play.” If you were to bullet-point Moore’s statement, it would look like this:

  • On-base guy
  • Speed-type player
  • Hustler
  • Craig Counsell-type player
  • Plays hard
  • Hustles
  • Knows how to play

That reads like the five paragraph essays I used to write in high school. I always wanted three examples but sometimes couldn’t think of three, so I would bust out the thesaurus and find synonyms (hustler, plays hard, hustles) so I could make the required word count. Bravo, Dayton Moore, bravo. Also, there’s this:
In his first year in Kansas City, Bloomquist played in a career-high 125 games, getting 468 plate appearances and hitting .265/.308/.355. He lived up to his “speed-guy” label by stealing a team-leading 25 bases. He was worth -0.1 WAR, almost exactly replacement-level, but WAR doesn’t measure intangibles, so we really don’t know his true value that year. He may have led the league in Hustle WAR and Knows How To Play WAR while likely finishing second to Craig Counsell in Craig Counsell WAR.

Other than the ample playing time, this 2009 season is the epitome of Willie Bloomquist. His triple-slash line, his walk rate, his strikeout rate, they were all very close to his career numbers. He also played every position except pitcher and catcher that year. Yep, in 2009 Willie Bloomquist was about as Willie Bloomquist as Willie Bloomquist could be.

His second year with the Royals did not go as well and he was sold to the Reds in September of 2010. I don’t know how much a 2010 Willie Bloomquist went for, but hopefully the Reds got a good deal.

In January of 2011, Willie Bloomquist got another free agent deal, this time signing with the Arizona Diamondbacks for one year. This was another quintessential Bloomquistian season. He played 97 games, had 381 plate appearances, and hit .266/.317/.340 (nearly a match for his .269/.316/.342 career batting line). He was worth 0.0 WAR.

This 2011 season was also the only season Willie got a taste of postseason play. In a five-game Division-Series loss to the Brewers, Bloomquist hit .318/.348/.318 with three steals. Yep, Willie Bloomquist has a career .318 average in the postseason, 10 points higher than Derek Jeter (yeah, I know there’s a difference of 153 games played. It’s not Willie’s fault he didn’t get the opportunities Jeter had. Don’t be a hater).

After Bloomquist’s 0.0 WAR season with the Diamondbacks, he re-signed with the team on a two-year, $3.8 million contract and had seasons worth 0.4 and 0.5 WAR. When Bloomquist’s contract expired after the 2013 season, the Diamondbacks didn’t look like they had room on the roster for Willie B, which led to this headline from the AZ Central: “Arizona Diamondbacks brace for departure of Willie Bloomquist.” I wonder how one braces for the departure of Willie Bloomquist? Does it involve eating chips and drinking beer?

According to the article, the Diamondbacks wanted Willie back for 2014, but the market for his services was moving quickly. “We like him a lot and would love to have him back,” Towers said. “But my sense is there are going to be some clubs after him aggressively early.” Hmm. A free-agent battle for a 36-year-old Willie Bloomquist. Well, I’ll be.

Apparently, the booming market for Willie Bloomquist resulted in the Seattle Mariners outfoxing their competition by signing Bloomquist to a two-year, $5.8 million deal. That’s not a bad chunk of change for “Mr. Replacement Level” (when the Moneyball-like film comes out about “Mr. Replacement Level”, Bloomquist will be played by Ben Foster, the Willie Bloomquist of Hollywood. If you don’t know who Ben Foster is, well, that’s why he’s the Willie Bloomquist of Hollywood).

Bloomquist was close to his typical self in his first season back with the Mariners, accounting for 0.1 WAR despite an ugly .297 OBP (and that was with a .356 BABIP). Once again, he was tabbed to fill in at every position on the diamond except for catcher and center field. He only stole one base, though, and had the lowest walk rate and highest strikeout rate of his career. It almost looked like age was catching up to Willie Bloomquist, but that could not possibly be true because Willie Bloomquist had seemingly not aged in more than a dozen years.

Sadly, it may be the end of The Willie Bloomquist Experience. His intangibles couldn’t make up for a .159/.194/.174 batting line and the Mariners have designated him for assignment. Maybe he will be picked up by another Major League team (or the Phillies) and he’ll bang out a .265/.315/.340 stretch one last time.

Despite his 14 years of ever-so-slightly-above replacement level play, I have to give credit to Willie Bloomquist. He played hard and he was willing to man most any position on the diamond. If you needed a bunt, Willie would bunt. In his early days, he could pinch-run and steal you a bag in a high-leverage situation. He must have been a great guy in the clubhouse to last as long as he did and he may not be done just yet. Jeff Francoeur hasn’t been above replacement level since 2011 and he’s still playing. As long as Francoeur continues to get work, there’s hope for Willie Bloomquist. If he isn’t signed by a Major League team (or the Phillies), he can be proud of what he accomplished in the big leagues.


Best and Worst of the Offseason Acquisitions Thus Far

As we hurtle toward the season’s midpoint, it may be worth pausing to assess how some of last winter’s player moves have turned out. Herewith, the five best and five worst players to date (by fWAR) who changed uniforms during the off season.

Top 5

Josh Donaldson (4.4)

When asked last October whether the A’s would trade Josh Donaldson, an unnamed A’s official said “That would be stupid!” (h/t MLB Trade Rumors). But then suddenly it wasn’t. Maybe Billy Boy really did trade Donaldson in a fit of pique, or maybe the trade was yet another example of the man’s Machiavellian genius. Either way, there’s no getting around the fact that Donaldson is tied for 4th in WAR in the charted universe as of this writing. Donaldson is a key contributor to an MLB-leading offense that has scored 70 more runs than its nearest competitor. Toronto’s mighty +94 run differential bestes even that of the mighty St. Louis “Marked” Cards (+91), and the Blue Jays’ Wins per FBI Interview stands at infinity, blowing away the Cardinals’ ratio. It’s possible that Beane doesn’t regret the Donaldson move; it’s certain that Alex Anthopolous doesn’t.

Max Scherzer (4.2)

Max Scherzer has 130 Ks this season, which would place him 71st on the all time Expos/Nats single season list. And the season, as discerning readers will have already realized, in only half over. The same readers will have divined that Scherzer is on a pace for 260 Ks, which would put him second on the all time list behind Pedro Martinez, who racked up 305 in 1997. Scherzer is absolutely blowing away every one of his career rate stats this season. Can he keep the regression demons at bay until he gets a World Series ring? The Nationals certainly hope so, as do these guys. More evidence for the theory that playing at the top of the free agent market can be costly, yet cost-effective.

Dee Gordon (3.0)

Dee Gordon’s OPS is 60 points above his career average. Dee Gordon’s BABIP is 70 points above his career average. Dee Gordon’s closest comp through age 26, according to Baseball Reference, is Chippy McGarr. So no, it isn’t going to last, but it’s been a fun ride. One can only wish that Gordon’s magical half-season had been in the service of a better cause than this one. To be fair, a variety of defensive metrics are in agreement that Gordon has become an asset at second, and of course he’s got those wheels, so he’ll still have value even when his Inner McGarr ultimately gets the better of him.

Russell Martin (2.9)

The second Blue Jay on this list – yes, this might finally be Anthopolous’ year. Martin’s contract will rapidly move from buzz to hangover, but right now the party is still hot. Only Buster Posey is putting up better numbers behind the plate, and unlike Martin, he’s not behind the plate all the time, instead getting a fair number of starts at first. Like the others mentioned above, Martin is having something of a career year, but his numbers this year aren’t wildly above his career stats (.363 wOBA this year vs. .336 for his career). His BABIP this year (.298) is just a little higher than his career mark (.289). So there’s reason to believe his success will continue as long as he avoids injury. And he’s Canadian.

A.J. Burnett (2.7)

Don’t tell him it’s a young man’s game. Burnett, at age 38, is the 4th oldest starter in the majors, behind Bartolo Colon (42), R.A. Dickey (40), and Tim Hudson (39). He has the highest K/9 among this group (7.7), and by far the lowest FIP (2.97). Burnett’s fastball velo is sitting at 91.1, off of his career mark of 93.5, but it’s not a yawning gap. Burnett is kind of the anti-Scherzer, a bargain free agent that Neal Huntington was able to sign for a 1-year, $8.5m deal. Like Dan Duquette, Huntington has done a good job shoring up his roster with effective store brands such as Jung-ho Kang, Francisco Cervelli, and Burnett. The Pirates have stars too, more than next year’s Orioles will, but they do a better a job than most in making sure that no roster slot gets left behind.

Bottom 5

Matt Kemp (-1.0)

Kemp is putting up the worst triple slash (.244/.279/.365) and ISO (.122) numbers of his career. His defense remains R-rated. The Dodgers are paying Kemp $32 million to play for division rival San Diego. So far, it’s been a stellar investment.

Melky Cabrera (-1.0)

Not all dumpsters have stuff worth diving for. Skim Melk has returned to his bad old (pre-PED?) powerless ways. His ISO is a microscopic .067, lowest of his career and 8th lowest in the Show. Most of the other 7 guys are middle infielders. Rick Hahn has made a valiant effort to paper over the White Sox’ roster holes with veterans until he can rebuild a desolate farm system, but with mixed results. Adam LaRoche and Geovany Soto have been pretty effective, but Cabrera and Emilio Bonifacio have generated outs at the same rate the Dan Ryan generates traffic jams.

Kyle Kendrick (-0.9)

Ok, raise your hand if you think putting a fly-ball, high-contact pitcher in Coors is a good idea.

Pablo Sandoval (-0.6)

In 2011 Panda put up a .315/.357/.552 line. In 2012 he lost 100 points of slugging. In 2013 he lost 30 more. In 2014 he lost 20 points of OBP.  This year, he’s lost 10 more, along with another 15 missing SLG. His UZR/150 is at -26.2, which approximates the performance of an actual panda. This long steady performance collapse looks like something that happens to players in their early to mid-30s, but Sandoval is only 28. As Dayn Perry has noted, “Sandoval’s relationship with basic conditioning is complicated,” and it’s not clear that a manager on the bubble like John Farrell will be able to convince Sandoval to put his shoulder to the workout wheel (uh … the UZR/150 of that metaphor is probably -26.2). Sandoval has through 2019 to find a Red Sox treadmill routine that works for him. Which I’m sure makes Sawx fans ecstatic.

Billy Butler (-0.4)

In 2014 Butler put up a wRC+ of 97, craptastic for a player who has no non-hitting skills of note. This year, his wRC has surged to … 97.  The good news is that he’s held his ground despite playing half his games in the Mausoleum. The bad news is that the ground he’s holding isn’t worth much. At 3 years/$30m, Butler’s contract is reasonable by today’s standards. But it appears that the other Billy may have made a basic roster management error here by signing a middling free agent for middling money. Until the Oakland A’s become the San Jose PayPals, this is the kind of mistake the franchise can ill afford.


The Mets, Third-Base Uncertainty, and Troy Tulowitzki

The New York Mets are a team in need of upgrade.  With their playoff odds now at 16%, while every additional win is still important, there should be a large focus on 2016, and beyond, as well.  The question is where to upgrade.  A team should be willing to upgrade anywhere (a win is a win, is a win, is a win).  However, considering the type of depth and high-end talent the Mets have in their rotation, it seems unlikely they will attempt an upgrade there.  Both corner outfield spots could use an upgrade, but it is probably unlikely that the Mets will move, or bench, either Michael Cuddyer or Curtis Granderson.  Catcher has young talent.  First base is set.  Second base has a couple of capable providers in Daniel Murphy and Dilson Herrera. This leaves us with shortstop and third base.

Shortstop was a hot topic around Metland during the off-season, mainly in regards to Wilmer Flores’ questionable defense.  As he did things like this:

Ahhh, that never gets old.  However, he has also done things like this:

Ultimately, Wilmer now has a 1.7 UZR/150 in 561.2 innings this year to supplement his 12.5 UZR/150 in 443.1 innings in 2014.  This now gives him a cumulative 5.9 UZR/150 in 1005 innings!  While this is still not a huge sample size it is becoming increasingly likely that Flores can stick at the position.  Flores’ apparent ability to play shortstop coupled with his current 93 wRC+ (projected for more of the same from ZiPS and Steamer) makes him about an average player.

This is where it gets interesting.  The Mets’ third-base situation is probably the most variable in baseball.  It is basically impossible to know what they will get from David Wright at this point, if anything at all.  Spinal stenosis is a harsh mistress.  Time will tell what becomes of Wright.  Though, every cloud has a silver lining.  Other clichés.  The Mets will not bring in a strict third baseman, but it would be nice to have someone who can play there for a prolonged period of time if things go bad.

This leads us to Troy Tulowitzki.  Tulo is currently projected for a 128 wRC+, and 2.4 WAR, in 68 games for the rest of the season according to FanGraphs Depth Charts.  Tulowitzki is the type of 5-WAR star the Mets are in need of, as he would be a major upgrade over Flores in 2015 and beyond.  Additionally, Tulo would be able to move over to third base in the case of a prolonged absence from Wright, giving the Mets more malleability in terms of adding impact players.  In this case Flores can either be traded or used in a different capacity.  Tulo has long seemed to be a great fit for the Mets, and the uncertainty concerning David Wright seems to strengthen this fit.  Or, maybe this doesn’t affect the Mets’ decision-making process at all and I’m just writing nonsense.  Tulowitzki is a good fit regardless.  Though he would command a package such as Matz, Plawecki, Rosario, and Conforto, this may very well be worth it for the Mets.


Can Toronto Keep Rolling?

I decided to do a little experiment today and put the first third of the season under a microscope. I thought, what better way to compare MLB teams then by using a fantasy baseball format? Using seven offensive stats (AVG, wOBA, BABIP, OBP, ISO, K%, BB%) and seven pitching stats (BB/9, HR/9, BABIP, HR/FB, ERA, WHIP, K/9) I compiled the numbers from around the league. After getting the numbers, I went through and noted where each team stood in the overall standings for each stat. For every top-10 a team had in a given category, I gave them a point; the teams with the most points, theoretically, should be in the mix for the 10 playoff spots this September. Three teams — the Cardinals, Dodgers and Tigers — had the highest scores with 10 overall points. The next highest was the upstart AL West leading Astros and the red-hot Blue Jays. Both teams are interesting cases but with the Blue Jays sitting in third place in a, let’s say, competitive AL East, I have to wonder, how good are the Blue Jays and how far can they go?

This isn’t the Blue Jays of old; with the addition of Josh Donaldson and Russell Martin and the emergence of young, productive players like Kevin Pillar, Devon Travis (before he got hurt), Chris Colabello and Danny Valencia, the Blue Jays have a balanced and deep offense. We know teams that live and die by the home run generally have trouble staying consistent throughout the season. This has been the problem with the Blue Jays in the past, waiting for Bautista and Encarnacion to heat up and then when they do, watch out. This year however, has been much more of a consistent team effort. With the top offense in baseball the Blue Jays are third in AVG, first in wOBA, 10th in BABIP, third in OBP, second in ISO, seventh in K% and seventh in BB%. All of that adds up to scoring runs, which they do very well, leading the league with 5.47 RPG. In my fantasy reality projections, the Blue Jays received a point for every offensive stat, the only team to do so. It’s the pitching categories however that raise my questions.

Although they had a total of 8 points, the Blue Jays were in the top 10 of only one pitching category: they’re third in BABIP. This isn’t to say that their pitching has been bad, as they’ve actually been pretty decent so far this year. Mark Buehrle has been his same old self, Drew Hutchison with his 5.33 ERA is 6-1, Aaron Sanchez has recovered nicely from a rough start of the season, Marco Estrada is a nice piece to have and although R.A. Dickey’s knuckleball hasn’t been as good as in years past, he’s still keeping them in the game and at least saving the bullpen. Speaking of the bullpen, it’s been a lot better as well this year. Brett Cecil, Roberto Osuna and Liam Hendricks all have K/9 above 9.0 and the bullpen as a whole has an ERA of 3.38, lower than the league average of 3.50. But is all of this enough to win the division or at least get a wild-card birth?

The AL East has been a mixed bag this year. Every team, besides the Red Sox, seems to be a hot or cold streak away from dominating or falling off the face of the earth. The Rays are currently leading the AL East by 1 game over the Yankees and 2 games ahead of both the Orioles and Blue Jays. The Rays are pretty much the opposite of the Blue Jays, as they don’t hit a lot of home runs and where the Blue Jays lead not only the division but the league in runs scored per game, the Rays are last in the division and 26th in the league with 3.73 RPG. The Rays have an AL East best 3.26 ERA and the Blue Jays, of course are at the opposite end of the spectrum, ranking fourth in the division at 4.26. These numbers bring into to play run differential, where the Blue Jays lead the division at +69 and the Rays are fourth with a +7 run differential. Anything is possible but it just feels like the Rays won’t be able to hold on throughout the season, especially facing the offenses in the AL East. Speaking of the other teams not named the Red Sox, let’s look at the Yankees and Orioles and see how their success may impact Toronto.

Both the Orioles and Yankees have mostly played good baseball throughout the season. The Yankees have definitely exceeded expectations and the Orioles have been a streaky team but are still hanging right in there. I think these two teams pose the biggest threat to any potential Toronto success. With the AL Central as loaded as it is, it’s entirely possible that two AL wild-card teams come from that division. It’s also highly possible that one could come from the AL West — the Rangers are playing better, the Angels have a similar record to the Blue Jays, Yankees and Orioles and I know it sounds crazy but I’ll never count the A’s out until it’s mathematically impossible.

All that being said, I think it will be hard for Toronto to secure a wild-card birth; I think they have to win the division. The Yankees and Orioles are second and third in the AL East in RPG with 4.53 and 4.50 respectively and both have a better team ERA than the Blue Jays do. The Orioles have a run differential of +35 and the Yankees are at +12, so it’s certainly possible if the numbers stay where they’re at that the Blue Jays can just outscore everyone more often then not. But pitching wins championships — just ask the Giants — and if the Blue Jays want to have the success they’re looking for, they’ll need to improve their starting rotation.

The question then becomes, where do they get the help? We saw what happened to the A’s last year when they went for everything and broke up a successful offense to secure their starting rotation. I’m not suggesting the Blue Jays do exactly that but I do think they need to make a move to get a proven starter. Toronto is invested in young starters Hutchison and Sanchez who have performed well but not great, and veterans like Buehrle and Dickey are a good presence for a young staff, but they seem to lack that workhorse, front-of-the-rotation guy. Filling the void from within is always the preferred method but it doesn’t appear that the Blue Jays have anybody waiting in the wings.

Perhaps R.A. Dickey can regain his form and become the ace that he was with the Mets, but that’s a lot to hope for. Toronto’s farm system was ranked 19th in MLB going into the season, making it difficult to trade for a top-tier starter without dealing major-league talent but surely they could put something together for a major-league starter without breaking up their core players. If they can make a move, I think they’ll greatly increase their chance of winning the division. If they don’t, they’ll have to hope everyone stays healthy and the offense keeps rolling. One thing is for sure, it’s baseball and anything can happen at any time. For now we’ll just have to wait and see, and of course, enjoy the dingers.


The Curious Case of Alex Guerrero

June is here and summer has been kicked into full swing. And of course you can’t have summer without baseball and with about a third of the season gone, we now have an idea of how the year is shaping up. There have been some surprises — at the beginning of the year many were wondering if Bryce Harper would regress even more, and of course they’re not talking about that now. Many had A-Rod not producing at all but so far this year, he’s returned to A-Rod form. We have rookie sensations who are delivering right away in Joc Pederson and Kris Bryant but there’s another rookie who has put up great numbers but hasn’t seen the same hype or support from analyst and in ways, even his team, that the others have. I’m talking about Alex Guerrero of the Los Angeles Dodgers of course. Technically a rookie with clause in his contract that keeps him from being sent to the minors, at the beginning of the year some thought it would hurt the Dodgers to have Guerrero on the roster but so far he’s been an offensive surprise (and for not playing third base or the outfield much, defensively he’s done better then let’s say former Dodger, Hanley Ramirez.) So what I want to know is, where’s the love for Alex Guerrero?

After filling in at third for an injured Juan Uribe, Guerrero quickly impressed with his bat going 4-10 with one homer and six RBI. Once Uribe came back however, Guerrero was relocated to do what some consider to be one of the hardest things to do it in sports, pinch-hit. It didn’t seem to stop Guerrero who continued to hit, going 3-5 in a five-game stretch, hitting two homers with five RBI. It was easy to understand everyone’s apprehension when Guerrero came out hitting this way. He was operating at a Superman-like pace and the logical thought would be he’d eventually come back down to earth, so neither analysts nor even the Dodgers themselves fully committed to Guerrero. The Dodgers also had a clubhouse favorite and adequate third baseman in Uribe, a full outfield and a deep bench; it seemed like there was no place for Guerrero in the starting lineup. So as April turned to May, Guerrero would find himself jumping all around the left side of the field, playing third, left field, and of course, pinch-hitting. It still didn’t seem to stop Guerrero. From April 23-May 13, when Carl Crawford went on the DL, he hit .310 with three homers. He did have, as many predicted, a drop-off in production, but still put up numbers that warranted playing time and with the injury to Crawford, it seemed like he would have just that.

Guerrero is a swinger. It’s hard to say he’s a free swinger because he seems to have a pretty good understanding of the strike zone. He doesn’t walk much or steal bases and in the baseball world that generally doesn’t result in runs scored. But I’d look at where he’s batting in the Dodgers lineup to explain some of his less appealing numbers. In 2015 he’s batted fifth six times with Ethier, Heisley, Grandal and Van Slyke batting behind him. He’s batted sixth eight times, seventh eight times, eighth six times, and pinch-hit nine times. He’s never started in the top part of the order.

That seems odd for a guy who has put up the offensive numbers Guerrero has. Joe Maddon has made waves this season batting his pitchers eighth. One of his reasons is to get the nine-hole hitter better pitches to see in order to get on base and turn the lineup over to their best hitters. I’m not suggested the Dodgers bat their pitchers eighth but I do think Guerrero would benefit from having the production of someone like Adrian Gonzalez behind him. Forcing pitchers to challenge Guerrero in the strike zone in order to hopefully keep him off base and minimize any damage Gonzalez may inflict. Guerrero is definitely susceptible to the slider off the plate but I wonder if he would see less of those if he were batting third?

And although Guerrero swings a lot, 60.3% of the time to be exact, he’s also got a contact percentage of 77.9% better then Josh Donaldson, Paul Goldschmidt and Joc Pederson. And when Guerrero does make contact, he is generally hitting the ball hard, with an ISO of .371, second only to Bryce Harper. Guerrero is averaging a home run every 10.8 at bats. The Dodgers lead the majors with 23.7 at bats per home run but they’re also second in the league with 21 solo home runs — Guerrero has hit three of them. It’s obvious the Dodgers have a good offense but I wonder if it’s as productive as it could be and I wonder if Guerrero can play a bigger role?

Another reason for apprehension with Guerrero is the sample size we have. Guerrero didn’t put up these numbers in the minors and many didn’t expect him to contribute the way that he has in the show. All that leads to doubt from the outside. Guerrero has about 100 fewer at bats that the top hitters in the league. That being said however, it’s interesting to note how similar they are anyway. When added to the top hitters in the league, Guerrero is fifth in wOBA, third in SLG and as I mentioned before second in ISO.

With the rate that Guerrero is on, if he gets another 300 at bats would be 37 HR/ 59 R/ 93 RBI. If he got another 400 at bats it would be, 46 HR/ 74 R/ 116 RBI. As realistic or unrealistic as the projections may be, Guerrero even with a regression can put up solid major-league numbers. Would anyone say no to 25 homers and 80 RBI? I think the answer to the season-ending stats lie in how the Dodgers choose to handle the situation. They’ve already dealt Uribe to free up third base and with Crawford being moved to the 60-day DL, it looks like left field is Guerrero’s for the summer. But Yasiel Puig is coming back soon and Ethier has been playing better then expected this year, so is Mattingly going to platoon Ethier and Guerrero in left?

In many ways this is a great problem to have for the Dodgers — they’re a veteran team that wants to win now and having a versatile bench helps shift people around and keep everyone healthy. That being said, this is baseball and with the trade deadline less then two months away and the Dodgers with a beat-up starting rotation, who’s to say some of that offensive depth can’t be flipped for some pitching help? The question then becomes, who gets traded? But that’s a topic for another day. Until then we’ll just have to hope Mattingly and the Dodgers give Guerrero a chance in the top part of the order.


Don’t Blame the Red Sox Trouble All On the Starters

A lot has been made of the Red Sox inability to win games after they spent $245 million this offseason on a bunch of hitters and middle-of-the-rotation starters. The Red Sox were unable to sign Jon Lester, and they made almost no effort to replace him in the rotation. Things have come to a front after Koji Uehara blew a save on Sunday to end a six-loss road trip at the hands of the Twins and Rangers.

With no defined ace in the squad, the Red Sox starting pitching has come under fire. In fact only the Blue Jays have a worse team ERA in the AL.[1] The pitcher from the Red Sox opening day roster with the lowest ERA is Clay Buchholz at an unsavory 4.33 and Justin Masterson’s is the worst at 6.37. The Sox won’t even sniff the playoffs if they don’t sort out their pitching situation, but I think the Red Sox starting pitchers have come under an unfair amount of criticism.

The Red Sox starting pitchers have had some horrendous outings, but despite their heinous ERAs the Sox starters have managed to put together 24 quality starts, a mark equal to the average in the AL and just one below the MLB average. Obviously quality starts are not a perfect metric for starting pitching, but considering the pre-season expectations for the Sox starting pitchers, being league average in keeping the team in the game (the basic idea behind quality starts) is not so bad.

In games where the Red Sox starter throws a quality start, the Sox are 14-10 (58%). Based on stats from all the quality starts from 1947-2006 the average team wins quality starts 67% of the time. At the current rate, the Red Sox will win 44/76 games in which their starters throw quality starts, seven games worse than they would if they won quality starts at the league average. In the worst AL East in recent memory, seven wins could make the difference for a Red Sox team that has struggled in the first third of the season.

What remains to be seen is if the bullpen or the batting lineup lets the starters down. The Red Sox bullpen has pitched 49 innings in games and the guys out of the pen have shone in those moments. The Red Sox bullpen has a 2.39 ERA and 1.04 WHIP in those games.[2] That compares favorably to the league averages out of the bullpen of 3.52 ERA and 1.27 WHIP. Koji Uehara has blown saves in a couple of these games, most recently on Sunday, but on the whole the bullpen pitchers have done very well protecting their starters’ quality starts.

The Red Sox were banking on being above average in their ability to carry their pitchers, but when their pitchers put them in a chance to win, they perform worse than the league average. In their 24 quality starts the Red Sox have averaged 3.75 runs per game. That’s close to the MLB average 4.14 runs per game, but not quite cracking the average is embarrassing for a lineup that was supposed to carry the team.

What’s more, the runs-per-game mark is buoyed by four outings of 8 runs or more (8, 8, 8, 9). If you exclude those four games, the Red Sox average only 2.75 runs per game, simply unacceptable for a team with playoff aspirations. In Red Sox quality starts, Red Sox batters have a weak 0.254/0.322/0.386 triple slash[3] and 0.249 batting average with RISP. Again this compares poorly with the MLB averages: 0.251/0.314/0.395 triple slash and 0.257 average with RISP.

Before the season ZiPS projected[4] the Red Sox batters would have a 0.265/0.333/0.407 triple slash. Until the Red Sox begin to bring their collective triple slash up to that level, particularly in games which their starters put together quality starts, they will continue to flounder at the bottom of the AL East. Paul Sporer and Eno Sarris pointed out the Red Sox failures at the plate in the May 28 episode of The Sleeper and the Bust. As the season goes on, analysts should follow their lead and consider the failures of the Red Sox batting order in addition to criticizing the low-hanging fruit that is the Red Sox starting rotation.


[1] All stats from ESPN unless otherwise noted. All stats are as of 6/1/15.

[2] As far as I could find there was no data complied on the Red Sox stats during quality starts so I compiled the statistics myself here.

[3] While this is bad, the Red Sox actually hit better in quality starts than on average – their triple slash for the season is 0.241/0.315/0.369. If I were arguing that the Red Sox are in last place because of their offense’s inability to perform in the same games that their pitchers do well, this stat would ruin my argument. However, since I am just using the stats in games when pitchers do well to highlight the fact that the pitchers get too much of the criticism, I feel that my argument is not undermined.

[4] I aggregated the zips projections of every players zips projected to get more than 25 at bats for this stat.


Baseball, Regression to the Mean, and Avoiding Potential Clinical Trial Biases

It’s baseball season. Which means it’s fantasy baseball season. Which means I have to keep reminding myself that, even though it’s already been a month and a half, that’s still a pretty short time in the long rhythm of the season and every performance has to be viewed with skepticism. Ryan Zimmerman sporting a 0.293 On Base Percentage (OBP)? He’s not likely to end up there. On the other hand, Jake Odorizzi with an Earned Run Average (ERA) less than 2.10? He’s good, but not that good. I try to avoid making trades in the first few months (although with several players on my team on the Disabled List, I may have to break my own rule) because I know that in small samples, big fluctuations in statistical performance in the end  are not really telling us much about actual player talent.

One of the big lessons I’ve learned from following baseball and the revolution in sports analytics is that one of the most powerful forces in player performance is regression to the mean. This is the tendency for most outliers, over the course of repeated measurements, to move toward the mean of both individual and population-wide performance levels. There’s nothing magical, just simple statistical truth.

And as I lift my head up from ESPN sports and look around, I’ve started to wonder if regression to the mean might be affecting another interest of mine, and not for the better. I wonder if a lack of understanding of regression to the mean might be a problem in our search for ways to reach better health.
Read the rest of this entry »


Checking in on Starting Pitchers

The MLB season is nearing the one-quarter mark. Most teams are getting close to 40 games played and many starting pitchers have between 40 and 60 innings under their belts. With that in mind, I decided to take a look at fantasy-relevant starting pitchers. Fantasy-relevant can mean different things to different people, depending on the size of the league. For these purposes, I gathered information on all starting pitchers with four or more starts, then eliminated those who are projected by the FanGraphs Depth Charts to finish with an ERA over 4.25. This is arbitrary, I know, but I wanted to get the number of pitchers down to a smaller number. I was left with 90 pitchers.


Here is the key for the tables below:

IP—Current innings pitched (as of May 18)

ERA—Current ERA

FIP—Current FIP

xFIP—Current xFIP

DC-ERA—Rest-of-Season Projected Depth Charts ERA

ERA-xFIP—Current ERA minus current xFIP

ERA-DCERA—Current ERA minus Rest-of-Season Projected Depth Charts ERA


I used xFIP because I’ve read that it is a better predictor going forward than actual ERA or FIP.

I’ve separated the table into groups because a 90-pitcher spreadsheet just seems like too much to take in at one time. The groups will be sorted based on the difference between the pitcher’s current ERA and their current xFIP. With most of these pitchers having pitched around 50 innings, a difference of one earned run allowed is a difference of 0.18 in ERA, so I’ve used 0.54 and 1.08 as cutoff points in either direction for the charts.

The first group of pitchers includes those with an ERA at least 1.08 below their xFIP. These are the guys whose results are much better than you’d expect based on their peripherals.

The column on the far right shows the difference between their current xFIP and their Depth Charts RoS projections (DC-ERA). For pitchers who have a number close to zero, you could say they are pitching about as well as they’re projected to pitch going forward.

I will revisit these charts at the end of the year to see how things play out.

All of the pitchers in the top 17 have shown much better results than would be expected based on their peripherals and their projections. The column on the far right is interesting, though, and may be where we learn something at the end of the season. For example, Zack Greinke has a terrific 1.52 ERA, much lower than his 3.64 xFIP or his 3.20 FIP. His RoS Projection calls for a 3.14 ERA. At the end of the year, I will compare Greinke’s actual ERA from May 19th to the end of the season with these numbers. Greinke can be expected to have a higher ERA moving forward. The question is whether it will be closer to the 3.64 xFIP he has or the 3.14 DC-ERA.

A similar situation is true for Garrett Richards. Among this group of pitchers, Richards has the biggest difference between his xFIP and Depth Charts RoS projection (DC-ERA), at 0.69. Richards has a 2.29 ERA, 3.10 FIP, 4.04 xFIP, and 3.35 DC-ERA. He’s due for regression no matter which metric you favor, but is he closer to a 4.00 guy or a 3.30 guy?

A.J. Burnett has the biggest difference going the other direction, with a 3.58 xFIP and 3.98 DC-ERA. His current 1.38 ERA is ridiculous. He can be a useful pitcher with a 3.50-ish ERA but much less useful if his ERA is closer to 4.00 from this point on. Similar to Burnett is Dallas Keuchel, with a 1.87 ERA, 2.85 FIP, 3.28 xFIP, and 3.67 DC-ERA, and Jake Odorizzi (2.36 ERA, 2.49 FIP, 3.54 xFIP, 3.83 DC-ERA).

In theory (it’s my theory and I admit I am no Isaac Newton), the pitchers with the biggest negative difference in the column on the far right are pitchers who are more likely to beat their projections going forward. A big difference in the other direction could mean they are less likely to hit that projection. Again, I’ll revisit this at the end of the season.

This next group of pitchers also has results that are better than expected. The guy to target in this group based on my theory from above would be JA Happ:

JA Happ—2.98 ERA, 3.35 FIP, 3.58 xFIP, 4.07 DC-ERA. Happ is expected to regress but his FIP and xFIP say he won’t regress nearly as much as his projection would have you believe. In his first seven starts, Happ has a 1.8 BB/9, which is a much better walk rate than he’s had in any previous season of his career. His lifetime BB/9 is 3.7.

On the other hand, the following guys may not be all you want them to be:

John Lackey—2.96 ERA, 3.19 FIP, 4.00 xFIP, 3.63 DC-ERA. Lackey is striking out fewer batters and walking more than he did last year but has a much better ERA. The big difference has been a .269 BABIP and 0.4 HR/9. Last year he gave up 1.1 HR/9 and had a .305 BABIP. His xFIP suggests an ERA around 4.00 while his projection is for a 3.63 ERA going forward.

Jordan Zimmermann—3.66 ERA, 3.19 FIP, 4.21 xFIP, 3.32 DC-ERA. Zimmermann’s strikeout rate has dropped from 8.2 K/9 last year to 5.8 K/9 this year. That being said, last year looks like the outlier, as it was the first time in his first four years as a starter that his K/9 was over 7.1. Still, this year’s strikeout rate would be the lowest of Zimmermann’s career. His xFIP is at 4.21, while his rest-of-season projection is a much more optimistic 3.32.

These pitchers have ERAs within -0.54 and +0.54 of their xFIPs, which is the equivalent of two or three runs, so they could be considered the big group in the middle with numbers closest to what you’d expect. Still, the column to the right reveals some pitchers to target and avoid.

Guys who could outpitch their rest-of-season projections:

Gerrit Cole—2.40 ERA, 2.43 FIP, 2.75 xFIP, 3.32 DC-ERA. Cole could be taking a great leap forward to Ace status. He’s upped his strikeout rate and lowered his walk rate and his ERA, FIP, and xFIP are all below 3.00.

Jason Hammel—3.11 ERA, 3.36 FIP, 3.37 xFIP, 3.83 DC-ERA. Hammel is enjoying life back in the National League. In his career, Hammel has a 2.9 BB/9. Last year he sported a 1.9 BB/9 in his time with the Cubs but that went up to 2.8 BB/9 with the Athletics. He’s back with the Cubs and has walked just 1.2 per nine so far this year.

Chris Archer—2.47 ERA, 2.58 FIP, 2.73 xFIP, 3.47 DC-ERA. Through nine starts, Archer has jacked up his strikeout rate from last year’s 8.0 K/9 to 10.2 K/9. He’s also dropped his walk rate (3.3 BB/9 to 2.6 BB/9). He could be taking the leap along with Gerrit Cole to becoming a top tier-starting pitcher.

Jake Arrieta—2.77 ERA, 2.23 FIP, 2.69 xFIP, 3.39 DC-ERA. In his first four years in the major leagues (2010-2013), Jake Arrieta had a 5.23 ERA (4.75 FIP). Last year he broke out with the Cubs and posted a 2.53 ERA (2.26 FIP, 2.73 xFIP). Projections naturally expected some regression but he has been just as good this year as last year (2.23 FIP, 2.69 xFIP) so his Depth Charts Rest-of-Season Projection of 3.39 looks like it could be much too high.

Bartolo Colon—3.86 ERA, 3.60 FIP, 3.39 xFIP, 3.96 DC-ERA. Bartolo Colon saw what Phil Hughes did last year (186 strikeouts and 16 walks in 209 2/3 innings) and decided he would show the youngster how it’s done. Colon has 42 strikeouts and just one walk in 52 1/3 innings so far this year (he walked Ryan Zimmerman in his first outing this year, back on April 6th).


Guys to be cautious about:

Doug Fister—4.31 ERA, 4.71 FIP, 4.69 xFIP, 3.75 DC-ERA. Fister just went on the DL with forearm tightness so there’s a chance we won’t learn much from him over the rest of the season.

Madison Bumgarner—3.20 ERA, 3.52 FIP, 3.58 xFIP, 2.94 DC-ERA. Bumgarner pitched almost 270 innings last year when you include his stellar postseason and has seen his K/9 drop from 9.1 to 8.2 through his first eight starts. He can still be a positive contributor with an ERA in the 3.50 range but owners likely drafted him expecting an ERA near 3.00.

Alex Wood—3.83 ERA, 3.36 FIP, 4.02 xFIP, 3.49 DC-ERA. After striking out 8.9 batters per nine over his first 249 innings in the big leagues (2013 and 2014 combined), Wood’s K/9 has dropped to 6.1 this year. He’s upped his ground ball rate to over 50% but his fantasy owners would prefer he find those lost strikeouts.

Julio Teheran—4.33 ERA, 5.55 FIP, 4.18 xFIP, 3.66 DC-ERA. If you’re expecting Teheran to have a 3.66 ERA going forward, as his Depth Charts projection would suggest, you may be quite disappointed. Tehran is walking more batters than he ever has and giving up home runs at a ridiculous rate. Even adjusting to a league average home run rate doesn’t make him look very good, as his xFIP is over 4.00.

These pitchers all have ERAs that are worse than would be expected based on their xFIPs.

Guy from this group my theory would expect to be better than his rest-of-season projection:

Michael Pineda—3.31 ERA, 2.01 FIP, 2.41 xFIP, 3.27 DC-ERA. Pineda’s rookie year was back in 2011, when he struck out 9.1 batters per nine and walked 2.9. After missing two years because of injury, he came back last year to strike out 7.0 batters per nine and dropped his walk rate to 0.8 BB/9. This year, he has combined the best of both years, upping his strikeout rate to 9.6 K/9 and dropping his walk rate to 0.5 BB/9. He’s first in all of baseball with a 2.01 FIP and third in xFIP, at 2.41. Pineda’s rest-of-season projection calls for a 3.27 ERA but it looks like he could be on track to outdo that.

Guy my theory would not expect to be better than his rest-of-season projection:

Danny Duffy—5.87 ERA, 4.58 FIP, 4.82 xFIP, 3.86 DC-ERA. Duffy was a useful starting pitcher in fantasy league’s last year when he had a 2.53 ERA and 1.11 WHIP. His walk rate of 3.2 BB/9 was the best of his career. This year, he can’t get the walks under control (4.5 BB/9) and his ERA and WHIP have skyrocketed. Duffy’s FIP and xFIP don’t portend the improvement you might expect if you’re looking hopefully at his rest-of-season projection.

This final group of pitchers includes guys who have ERAs much worse than their xFIPs. These are the guys who have destroyed you ratios in the early going. You probably aren’t real happy with any of these chumps. Based on regression to the mean, they should all be better, but you knew that. Which guys should REALLY be better and which guys should you be a bit more skeptical about?

Should be MUCH better:

Danny Salazar—4.06 ERA, 3.52 FIP, 2.36 xFIP, 3.55 DC-ERA. Since returning from his minor league exile to start the season, Salazar has struck out 12.4 batters per nine and walked just 1.4. He’s given up too many home runs (7 in 37 2/3 innings, 1.7 HR/9), which has inflated his ERA. Salazar’s rest-of-season projection calls for an ERA around 3.50, which is the same as his current FIP. His xFIP, though, has him with an ERA under 2.50.

Clay Buchholz—4.93 ERA, 2.91 FIP, 2.99 xFIP, 3.95 DC-ERA. Based on the things a pitcher has the most control over—strikeouts, walks, and home runs allowed—Clay Buchholz is having his best season (10.6 K/9, 2.6 BB/9, 0.8 HR/9). Based on actual results (2-4 record, 4.93 ERA, 1.38 WHIP), he’s been pretty bad. He should be better. The caveat with Buchholz is that his ERA last year was 5.34, which was much higher than his FIP (4.01) and xFIP (4.04), so you just don’t know if maybe this is who he is now. For the record, in his career, Buchholz has a 3.97 ERA, 4.00 FIP, and 4.03 xFIP.

Finally, the guys who should be better but maybe not as good as you hope:

Chris Tillman—6.34 ERA, 5.42 FIP, 5.09 xFIP, 4.24 DC-ERA. From 2012-2014, Chris Tillman had a 3.42 ERA and 1.19 WHIP in 499 2/3 innings, although his FIP was a much less impressive 4.22. This year, Tillman currently has a 6.34 ERA through seven starts and his FIP and xFIP are both over 5.00. He’s projected to have a 4.24 ERA from this point forward but a sky-high walk rate (4.5 BB/9) will have to come down for him to approach that number.

Stephen Strasburg—5.98 ERA, 3.47 FIP, 3.66 xFIP, 3.14 DC-ERA. It’s shocking to see Stephen Strasburg with a 5.98 ERA. He’s striking out fewer batters than last year (9.3 K/9 to 10.1 K/9) and walking more (2.7 BB/9 TO 1.8 BB/9), but his strikeout and walk numbers are still quite good. The biggest problem appears to be a .389 BABIP and 60.6 LOB%. The Depth Chart projections expect a 3.14 ERA going forward but Strasburg’s FIP (3.47) and xFIP (3.66) aren’t as optimistic.


The Brewers’ Lament

The Brewers recently fired manager Ron Roenicke, using the same logic that primitive villagers employed when tossing virgins into the maw of a nearby volcano: It probably won’t work, but why take chances? As Dave Cameron has pointed out, the Brewers have fallen and they are unlikely to get up any time soon, and as others have pointed out, little of this was Roenicke’s fault. Yes, the team is enjoying a keg of Regression Pilsner under new manager Craig Counsell, who is 6-5 at the helm of the S.S. Benny, winning just one game fewer than Roenicke did in 25 attempts. But the Brewers are not a .500 team, and indeed not very close to being one. They are 23rd in the majors in runs scored, and 29th in runs allowed. Their fielding isn’t very good either.

And help isn’t on the way from the farm, at least not right away. The Brewers began the year as the 21st rated system, according to Baseball America. While Kiley McDaniel liked their 2014 draft, he also still has them in the bottom third of the league. Top prospect Orlando Arcia has put together 142 insane plate appearances at AA, where he’s slashing .354/.404/.496 with a pint-sized 7% K rate. The other young Brewers are probably less talented and/or farther away. Some of them will succeed, but most will not.

The surveyor of this doomed path is, of course, general manager Doug Melvin. Like many valuable things in life, GM jobs are much easier to lose than keep, and the sands are now running out of Melvin’s hourglass. That said, he’s had a long run, having been hired in September, 2002. During his tenure, the Brewers have been mediocre, finishing 17th in runs scored and 21st in runs allowed from 2003-2015. The aggregate mediocrity hides some occasional success: Melvin’s Brewers went to the postseason twice, and in 2011 finished with the most wins (96) in Brewers’ history. But overall the team is 969-1010 over that stretch, and only twice finished within 7 games of first in the not-always-intimidating NL Central.

Suspicion for this generally uninspiring performance immediately falls on the Brewers’ drafts, but here Melvin can claim some success. From 2003-2015, players drafted by Melvin have accumulated more net bWAR than any other NL Central team can claim.

Team                        bWAR from draft

Brewers                            163.3

Cardinals                          156.6

Reds                                  122.0

Pirates                               111.4

Cubs                                  109.3

Note that the drafting team did not always benefit from the bWAR displayed above. The Cubs, for example, get about 24 of their bWAR from Tim Lincecum, who did not sign with them after being drafted in 2003. The Brewers and Reds both get credit for 7.4 bWAR from Jake Arrieta, who the Orioles finally successfully inked in 2007. But in any case, Melvin and his team can’t fairly be accused of simply missing talent.

Melvin had some holes in his draft swing, however. From 2003-2011 Melvin got almost nothing from his first-round pitchers. Of nine first-round pitchers, six have thus far failed to make it to the majors, by far the worst rate in the division. (I’m using the 2011 cutoff to acknowledge that most players drafted since then probably would not have not made it to the majors.)

Team               1st round pitchers drafted     failed to make majors

Brewers                             9                                              6

Cardinals                          10                                            4

Cubs                                   3                                              2

Reds                                   6                                              2

Pirates                               6                                               1

The Brewers first-round pitchers who have made it to the majors have achieved little.

Player                                   bWAR

Jake Odorizzi                    3.3

Mark Rogers                      1.1

Jeremy Jeffress                1.1

Yep, that’s it. And Odorizzi never threw a pitch in anger for the Crew, although he did help Melvin to pry Zack Greinke from the Royals for the Brewers’ playoff season in 2011.

This pitching void has sucked in money – lots of it that a small-market team can ill afford. Only four Brewers are making more than $10 million this year; two of them are Kyle Lohse and Matt Garza. At least Lohse’s contract ends this year. Garza’s goes on through 2017, and will be one of the many puzzles the next Brewers GM will need to solve.

The Brewers’ path to redemption will go through several painful stations. The rotation next year may not be good, but it will be much cheaper. Three of the five starters (Peralta, Nelson, and Fiers) are home grown. FIP and I have yet to catch Peralta Fever, but Nelson and Fiers have good swing ‘n’ miss stuff. Fiers’ upside is limited though; a late bloomer, he will be 30 in June. Aramis Ramirez, the highest paid Brewmaster at $14 million, comes off the books at the end of the season and plans to hang up his cleats. Another $13 million might depart with Adam Lind and Gerardo Parra.

Rather than sign aging free agents to replace the departing aging free agents, the Brewers would be better served to take the bulk of this freed-up cash and pour it into scouting, player development, and perhaps the international market. The Brewers could use a couple of 90-loss seasons to get the high draft picks that they could use to augment a farm that is already on its way to yielding at least a handful of good produce in the next 2-3 years. The economics of tanking are complex, however. The Brewers have a bad local television deal and a small metro area from which to draw fans. They are thus probably more dependent than average for revenue from the occasional fan who attends one or two games a year with the family, and who will find other things to do if the Brewers are putting a replacement-level team on the field. The two most eminently watchable Brewers, Carlos Gomez and Jonathan Lucroy, are also probably the Brewers’ best trade pieces, but trading them will almost certainly lead to lower attendance and an associated revenue loss that reduces the benefit of shedding their salaries.

Ryan Braun has an untradeable contract and a damaged brand. His performance has collapsed since the suspension; before it he had a career OPS of .938, since then it’s been .781. Braun is by default the player around which the Brewers will attempt to market their team during the plague years to come, but that effort will be much less successful than it would have been without the suspension. Mark Attanasio seems like an intelligent and patient owner. He can only hope his next GM is similarly blessed.


MLB Franchise Four: NL East

Major League Baseball has a campaign asking fans to vote for the four “most impactful” players in their team’s history, with the winners being announced at the 2015 All-Star Game in Cincinnati. A panel of experts created an eight-man ballot for each team. This panel consists of MLB’s Official Historian John Thorn and representatives from MLB’s official statistician (the Elias Sports Bureau), MLB.com, MLB Network, and the Baseball Writers’ Association of America.

“Most impactful” is open to interpretation, which makes this an interesting exercise. It isn’t “best” or “most famous” or “most popular”, but “most impactful.” I decided to look at the eight players on the ballot for each franchise and where they rank in FanGraphs WAR during their time with that franchise.

For each franchise, I’ve listed their top 10 in FanGraphs WAR along with any players who are on the ballot who are below the top 10. The players in BOLD are those who are on the ballot and the years listed are the years in which they played for that team.


Atlanta Braves (1871-2015)

(1) Hank Aaron, 136.0 WAR (1954-1974)

(2) Eddie Mathews, 94.3 WAR (1952-1966)

(3) Chipper Jones, 84.6 WAR (1993, 1995-2012)

(4) John Smoltz, 80.3 WAR (1988-1999, 2001-2008)

(5) Warren Spahn, 74.3 WAR (1942, 1946-1964)

(6) Greg Maddux, 73.9 WAR (1993-2003)

(7) Kid Nichols, 72.8 WAR

(8) Phil Niekro, 71.0 WAR

(9) Andruw Jones, 64.3 WAR

(10) Tom Glavine, 57.0 WAR (1987-2002, 2008)

(11) Dale Murphy, 44.3 WAR (1976-1990)


On the ballot: The players on the Braves Franchise Four ballot range from Warren Spahn, who first played in the big leagues in 1942, to Chipper Jones, who hung up his spikes after the 2012 season. Three of the players on the ballot—Warren Spahn, Eddie Mathews, and Hank Aaron—were part of the 1957 World Series Champion Milwaukee Braves team. Four players—Chipper Jones, John Smoltz, Greg Maddux, and Tom Glavine—were key members of the consistently good Atlanta Braves teams of the 1990s. Then there’s Dale Murphy, who played for the Braves from 1976 to 1990 and experienced just three seasons in which the team finished in the upper half of the standings. The Braves finished in last place eight times in those 15 years but Murphy was a bright spot, winning back-to-back MPV Awards in 1982 and 1983.

Hank Aaron hit .280/.322/.447 as a 20-year-old rookie for the 1954 Milwaukee Braves. He was not an All-Star that year, but he would be an All-Star for the next 21 years of his career. He was the National League MVP in 1957, the year the Braves won the World Series. He led the league in home runs and RBI four times each and in total bases eight times and was the all-time leader in career home runs when he retired. He’s an easy pick for the Braves Franchise Four.

Eddie Mathews and Warren Spahn were teammates of Hank Aaron in the 1950s and 60s. Mathews ranks third all-time in FanGraphs WAR for third basemen. Spahn is sixth all-time in wins for a pitcher. Both were key contributors to the Braves back-to-back World Series years in 1957 and 1958. Mathews had 7.3 WAR in 1957 and 5.8 WAR in 1958. Spahn was the Cy Young Award winner in 1957and led the National League in wins both years.

The Atlanta Braves made the playoffs every year from 1991 to 2005, except for the 1994 season that was ended by a labor dispute. Chipper Jones joined the team as a regular in 1995 and finished second in the Rookie of the Year voting, then won the NL MVP Award four years later when he hit .319/.441/.633 during the 1999 season.

John Smoltz was a very good starting pitcher from 1989 to 1999, which included an NL Cy Young Award in 1996. He was injured and missed the entire 2000 season, then came back as a relief pitcher and saved 144 games over three seasons from 2002 to 2004.

Greg Maddux won his first Cy Young Award with the Cubs in 1992 but was at his absolute best with the Braves from 1993 to 1998 when he averaged 7.9 WAR per season, won three more Cy Young Awards, and had a 2.15 ERA and 0.96 WHIP. In 1994 and 1995, Maddux was 35-8 with a 1.60 ERA over 411 2/3 innings.

Tom Glavine didn’t reach the heights that his fellow pitchers did. He never had a season with as much as 6 WAR. He was an above-average pitcher for a long time, though, and finished his career with over 300 wins.

Notable ballot snubs: Phil Niekro and his 71.0 WAR with the Braves (8th all-time) give him an argument for inclusion over Glavine (57 WAR) and Murphy (44.3 WAR) but it’s a tough call.

My Franchise Four: Hank Aaron, Eddie Mathews, Chipper Jones, John Smoltz


Miami Marlins (1993-2015)

(1) Hanley Ramirez, 30.4 WAR

(2) Giancarlo Stanton, 21.4 WAR (2010-2015)

(3) Luis Castillo, 21.1 WAR (1996-2005)

(4) Josh Johnson, 20.8 WAR

(5) Miguel Cabrera, 19.6 WAR

(6) Dan Uggla, 18.1 WAR

(7) Ricky Nolasco, 17.9 WAR

(8) Mike Lowell, 17.3 WAR (1999-2005)

(9) Dontrelle Willis, 17.1 WAR

(10) Jeff Conine, 16.7 WAR (1993-1997, 2003-2005)

(13) Gary Sheffield, 14.4 WAR (1993-1998)

(14) Charles Johnson, 14.0 WAR (1994-1998, 2001-2002)

(15) Josh Beckett, 13.9 WAR (2001-2005)

(50) Livan Hernandez, 3.9 WAR (1996-1999)


On the ballot: The Marlins have made the playoffs twice in the 22 seasons they’ve completed (and won the World Series both times). Their two World Series squads are well represented on their Franchise Four ballot. Luis Castillo, Jeff Conine, Gary Sheffield, Charles Johnson, and Livan Hernandez were on the 1997 team that beat the Indians in the World Series. Castillo, Conine, and Johnson were also on their 2003 World Series team, with Mike Lowell and Josh Beckett joining them on the roster. The only player on the team’s Franchise Four ballot who wasn’t a part of either World Series team is Giancarlo Stanton, their current superstar. Stanton is starting his sixth season with the team and is already second on their all-time WAR leaderboard. In his first five years with the team, he averaged 31 home runs and 127 games played. Before this season he signed a 13-year, $325 million contract so his place on the Marlins Franchise Four is likely a sure thing.

Luis Castillo is the longest tenured Marlin on the ballot. He played 10 years with the team and accumulated 21.1 WAR, with his best season being the 4.9 WAR season of 2003. He hit .314/.381/.397 that year, made his second All-Star team, and won the first of three straight Gold Glove Awards.

Jeff Conine and Charles Johnson each had two separate stints with the Marlins. Conine and Johnson were teammates on the 1997 World Series winners. Conine was selected by the Marlins in the 1992 Major League Baseball expansion draft and his best year with the Marlins was in 1996 when he hit .293/.360/.484 and was worth 4.4 WAR. He’s one of the most loved players in franchise history, still works in the team’s front office, and is known as “Mr. Marlin”. Charles Johnson hit .250/.347/.454 in 1997, with good defense behind the plate. He followed up his good regular season play by hitting .357/.379/.464 in the ’97 World Series.

Gary Sheffield played for eight different MLB teams in his 22-year career. Six of those seasons were with the Marlins from 1993 to 1998 but two were partial seasons. He joined the Marlins in the middle of the 1993 season then left partway through the 1998 season. His best year with the team was in 1996 when he hit .314/.465/.624 and was worth 6.5 WAR.

Livan Hernandez, like Sheffield, played for many different MLB teams. Hernandez spent 17 years in the bigs and spent time with nine different teams. He had more starts with Washington and San Francisco than he did with the Marlins but his work in the 1997 postseason earned him a place on the Marlins’ ballot. Hernandez won two games in the NLCS and two more in the 1997 Fall Classic and was named MVP of each series. Of course, if he makes the team’s Franchise Four, MLB might want to carve out some space for Eric Gregg and his generous strike zone that helped Livan strike out 15 Atlanta batters in Game 5 of the 1997 NLCS.

Mike Lowell and Josh Beckett were both 4 WAR players for the Marlins’ 2003 World Series championship team. Lowell had a career-high 32 homers that year. Beckett only started 23 games during the 2003 regular season but made five starts in the postseason and was named MVP of the World Series.

Notable snubs: Well, Livan Hernandez is way down the list of career WAR for Marlins players (50th). His spot on the ballot is almost solely due to his 1997 postseason heroics. Is he more worthy than the team leader in career WAR, Hanley Ramirez?

My Franchise Four: Giancarlo Stanton, Jeff Conine, Luis Castillo, Mike Lowell


New York Mets (1962-2015)

(1) Tom Seaver 68.5 WAR (1967-1977, 1983)

(2) Dwight Gooden 52.6 WAR (1984-1994)

(3) David Wright 52.2 WAR (2004-2015)

(4) Jerry Koosman 41.9 WAR

(5) Darryl Strawberry 35.5 WAR (1983-1990)

(6) Jose Reyes 30.7 WAR

(7) Jon Matlack 29.5 WAR

(8) Carlos Beltran 29.4 WAR

(9) Edgardo Alfonso 29.0 WAR

(10) Mike Piazza 27.0 WAR (1998-2005)

(12) Keith Hernandez 26.2 WAR (1983-1989)

(32) Gary Carter 12.8 WAR (1985-1989)

(53) John Franco 8.9 WAR (1990-2001, 2003-2004)


On the ballot: Tom Seaver is the Mets’ all-time leader in FanGraphs WAR, was named to 10 All-Star teams, won three NL Cy Young Awards with the team, and was the #1 starter on the 1969 “Miracle Mets” team that won the first World Series in franchise history. He should be a lock.

Four players on the ballot—Dwight Gooden, Darryl Strawberry, Keith Hernandez, and Gary Carter—were part of the 1986 Mets team that won the World Series in seven games over the Boston Red Sox.

Gooden was good in 1986 (5 WAR) but he was at his best the previous year when he went 24-4 with a 1.53 ERA and 268 strikeouts in 276 2/3 innings (9 WAR).

Similarly, Darryl Strawberry was a good player in 1986 (3.4 WAR) but had five other seasons with the Mets that were more valuable, with his best season coming in 1990 when he hit .277/.361/.518 with 37 homers and 108 RBI.

Keith Hernandez’ best season with the Mets was in 1986 when he hit .310/.413/.446. Hernandez is an interesting choice for the Mets’ ballot. He played more seasons and had more WAR with the St. Louis Cardinals but did not make their eight-man ballot. Gary Carter also played more years with a team other than the Mets. He spent 12 years with the Expos and is their franchise leader in WAR. He played just five seasons with the Mets and is 32nd on their all-time WAR leaderboard. Both Hernandez and Carter were big contributors to the last Mets’ World Series-winning team, so that likely sealed their place on the Franchise Four ballot. Hernandez may get some votes because he’s been an announcer with the team for many years in addition to his playing career.

Mike Piazza and John Franco were teammates on the 1999 and 2000 Mets teams that made the playoffs. The 1999 team lost the NLCS in six games, while the 2000 team made it to the World Series but lost in five games to the New York Yankees. As a Met, Piazza hit .296/.373/.542 and averaged 3.4 WAR per season. Franco saved 276 games for the Mets in his career but his overall total of 8.9 WAR in 14 seasons with the team suggests he doesn’t really belong on the Franchise Four ballot.

Finally, David Wright has been the face of the franchise over the last decade and is third all-time in WAR for the team. He’s a seven-time All-Star with a career batting line of .298/.377/.494.

Notable snub: Jerry Koosman and Jose Reyes are fourth and sixth in WAR for the Mets, yet did not make the eight-man ballot. Koosman even had two wins in the 1969 World Series. Perhaps he and/or Jose Reyes would have been a better choice than John Franco.

My Franchise Four: Tom Seaver, Dwight Gooden, Darryl Strawberry, Keith Hernandez


Philadelphia Phillies (1883-2015)

(1) Mike Schmidt, 106.5 WAR (1972-1989)

(2) Steve Carlton, 73.5 WAR (1972-1986)

(3) Ed Delahanty, 64.8 WAR

(4) Robin Roberts, 62.7 WAR (1948-1961)

(5) Chase Utley, 60.9 WAR (2003-2015)

(6) Richie Ashburn, 52.3 WAR (1948-1959)

(7) Sherry Magee, 51.5 WAR

(8) Pete Alexander, 50.8 WAR

(9) Jimmy Rollins, 49.1 WAR (2000-2014)

(10) Bobby Abreu, 47.2 WAR

(17) Chuck Klein, 34.0 WAR (1928-1933, 1936-1944)

(20) Jim Bunning, 31.2 WAR (1964-1967, 1970-1971)


On the ballot: Mike Schmidt played his entire career with the Phillies, was a three-time NL MVP, 12-time All-Star, 10-time Gold Glove winner, and led the league in home runs eight times. He was also the MVP of the 1980 World Series championship team. He’s a lock for the Phillies Franchise Four.

While perhaps not as well liked as Mike Schmidt, Steve Carlton should be a lock also. He won three NL Cy Young Awards with the Phillies and was an All-Star seven times. His 1972 season is legendary. That year, Carlton went 27-10 for a team that won just 59 games. He led the league in wins, ERA (1.97), games started (41), complete games (30), innings pitched (346.3), and strikeouts (310). In the Phillies’ World Series in 1980, Carlton won two games.

Robin Roberts averaged 4.5 WAR per season for the Phillies in his 14 years with the team. He was a workhorse, averaging 267 innings per year and eclipsing the 300-inning mark in six consecutive seasons with the Phillies. Richie Ashburn was a longtime teammate of Roberts who was well known for his defensive prowess but also had good on-base ability (.396 lifetime on-base percentage).

Chuck Klein put up eye-popping numbers during the great hitter’s era of the early 1930s. In his first six years with the Phillies, he averaged 32 homers and 121 RBI per year with a batting line of .359/.412/.632 and was the 1932 NL MVP.

Jim Bunning averaged 6.6 WAR per season in his first four years with the Phillies. This included the heart breaking 1964 season when the Phillies held a 6 ½-game lead with 12 games left to play but lost 10 of their last 12 games and were overtaken by the St. Louis Cardinals.

The two active players on the Phillies ballot are Chase Utley and Jimmy Rollins. Utley and Rollins were part of the Phillies run of playoff teams from 2007 to 2011 that resulted in back-to-back World Series appearances and one World Series title (2008). Utley became a regular in 2005 and reeled off six straight years with 5 or more WAR. Rollins best stretch of play for the Phillies was from 2004 to 2012, during which he averaged 4.2 WAR per season and won the NL MVP Award in 2007.

Notable snub: Most of the Phillies top players are on the ballot with Ed Delahanty being the notable exception. Delahanty is third all-time in WAR for the Phillies but played most of his career before 1900 so would unlikely to get much traction in the voting as a Franchise Four candidate.

My Franchise Four: Mike Schmidt, Steve Carlton, Chase Utley, Robin Roberts


Washington Nationals (1969-2015)

(1) Gary Carter, 53.8 WAR (1974-1984, 1992)

(2) Steve Rogers, 51.5 WAR (1973-1985)

(3) Tim Raines, 49.3 WAR (1979-1990, 2001)

(4) Andre Dawson, 44.3 WAR (1976-1986)

(5) Tim Wallach, 35.3 WAR

(6) Ryan Zimmerman, 34.1 WAR (2005-2015)

(7) Vladimir Guerrero, 33.8 WAR (1996-2003)

(8) Dennis Martinez, 24.3 WAR (1986-1993)

(9) Javier Vazquez, 24.1 WAR

(10) Bryn Smith, 20.9 WAR

(11) Rusty Staub, 18.0 WAR (1969-1971, 1979)


On the ballot: It just doesn’t feel right to me to consider the Montreal Expos and Washington Nationals to be the same franchise. I know it’s true of other franchises, like the Braves who played in Boston, Milwaukee, and Atlanta, and the Athletics, who played in Kansas City and Philadelphia, but it feels different to me. Maybe it’s because the Expos to Nationals change happened in my lifetime and I have read from die-hard Expos fans that their allegiances did not transfer to Washington. The Expos are their team and their team ceased to exist after the 2004 season. Expos fans did not become Nationals fans. Still, this is how the Franchise Four balloting is designed, so we have to consider Steve Rogers along with Ryan Zimmerman.

The top five leaders in war for this franchise are all old Montreal Expos players. One of them, Tim Wallach, did not make the eight-man ballot. At the top of the leaderboard is Gary Carter, who came up as a 20-year-old with the Expos in 1974. Caster had his first really good season in 1977 and that started an extended run of greatness that lasted through the 1986 season. In Carter’s final eight seasons with the Expos, he averaged 6.1 WAR per season as a good-hitting catcher who was also very good behind the dish and had a great arm. Carter’s best season was 1982, when he hit .293/.381/.510 with 29 homers and 97 RBI. He was also very good in the 1981 postseason when he hit .421/.429/.895 in the divisional series then hit .438/.550/.500 in the NLCS that the Expos lost in five games to the Los Angeles Dodgers.

Steve Rogers played his entire 13-year career with Montreal and had nine seasons with 4 or more WAR. He won three games with a 0.98 ERA in three starts during the 1981 postseason.

Tim Raines and Andre Dawson were teammates with the Expos from 1979 to 1986. Although Dawson is in the Hall of Fame, it was Raines who was the more valuable player. Hopefully, he will get into Cooperstown soon. Raines played the first 12 seasons of his career in Montreal then one final partial season late in his career. In his 13 years with the team, Raines hit .301/.391/.437 and stole 635 bases with a success rate of 86%. Dawson averaged 4 WAR per season in his 11 years in Montreal and was the 1977 NL Rookie of the Year.

Dennis Martinez played more years and pitched more innings for the Baltimore Orioles but was a three-time All-Star with the Expos from 1990 to 1992. Vladimir Guerrero was not only a good player with the Expos, he was also very entertaining to watch. He had a rifle arm in the outfield but occasional issues with accuracy that made things interesting. He never saw a pitch he didn’t want to swing at but was still able to consistently post on-base percentages of .370 or higher throughout his Expos’ career. He was a joy to watch.

Ryan Zimmerman is in his 11th season with the Nationals. Injuries have limited him at times during his career. His best stretch of play was in 2009 and 2010 when he had 6.6 WAR each season.

The low man on the Expos/Nationals Franchise Four ballot is Rusty Staub, who ranks 18th all-time in WAR for the franchise. Staub had more plate appearances with three other teams than he had with the Expos but “Le Grand Orange” was the team’s biggest star and most-liked player in the first few years after they came into existence in 1969.

Notable snubs: None, really. Tim Wallach had more WAR than four players on the ballot but all four players below him have good supporting stories behind their placement on the ballot, so it’s understandable that Wallach didn’t make the cut.

My Franchise Four: Gary Carter, Tim Raines, Andre Dawson, Vladimir Guerrero