Archive for Uncategorized

Charlie Blackmon Goes Golfing

Baseball players have been known to have a fondness for golfing. After all, it’s just like baseball, except nobody’s trying to throw the ball past you. Famous baseball golfers include Yoenis Cespedes, John Smoltz, and, as we now know as of last Thursday, Charlie Blackmon.

I’ll be honest — I’ve never seen Charlie Blackmon step foot on a golf course before. His current facial-hair situation is also in violation of most country club dress codes. But after seeing what he did in his first AB against Zack Godley on Thursday, I’m convinced that Blackmon is already preparing to win the US Open after he retires from baseball.

Charlie Blackmon HR Gif

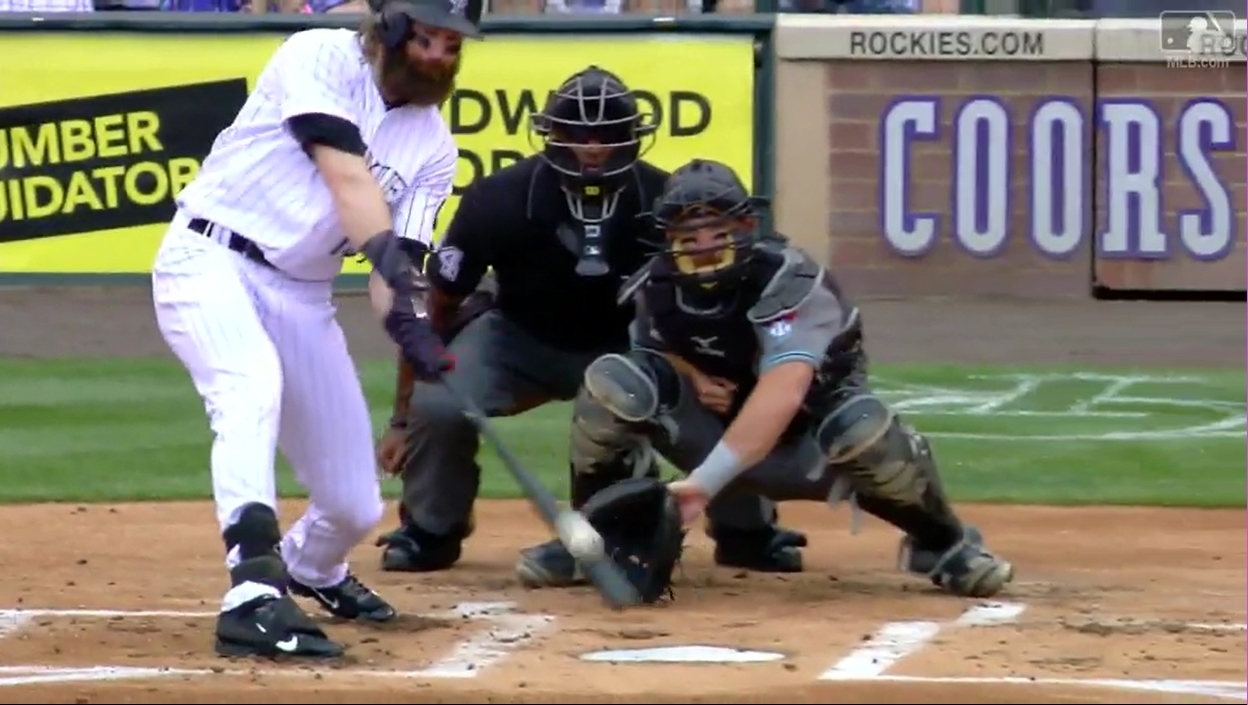
Charlie Blackmon managed to hit a no-doubter off of a shoelace-scraper. It’s like a Statcast glitch in real life. I looked it up on Brooks Baseball to see where this pitch really was, and, well –

Brooks Baseball Pitch Map of Charlie Blackmon's first AB on June 22, 2017

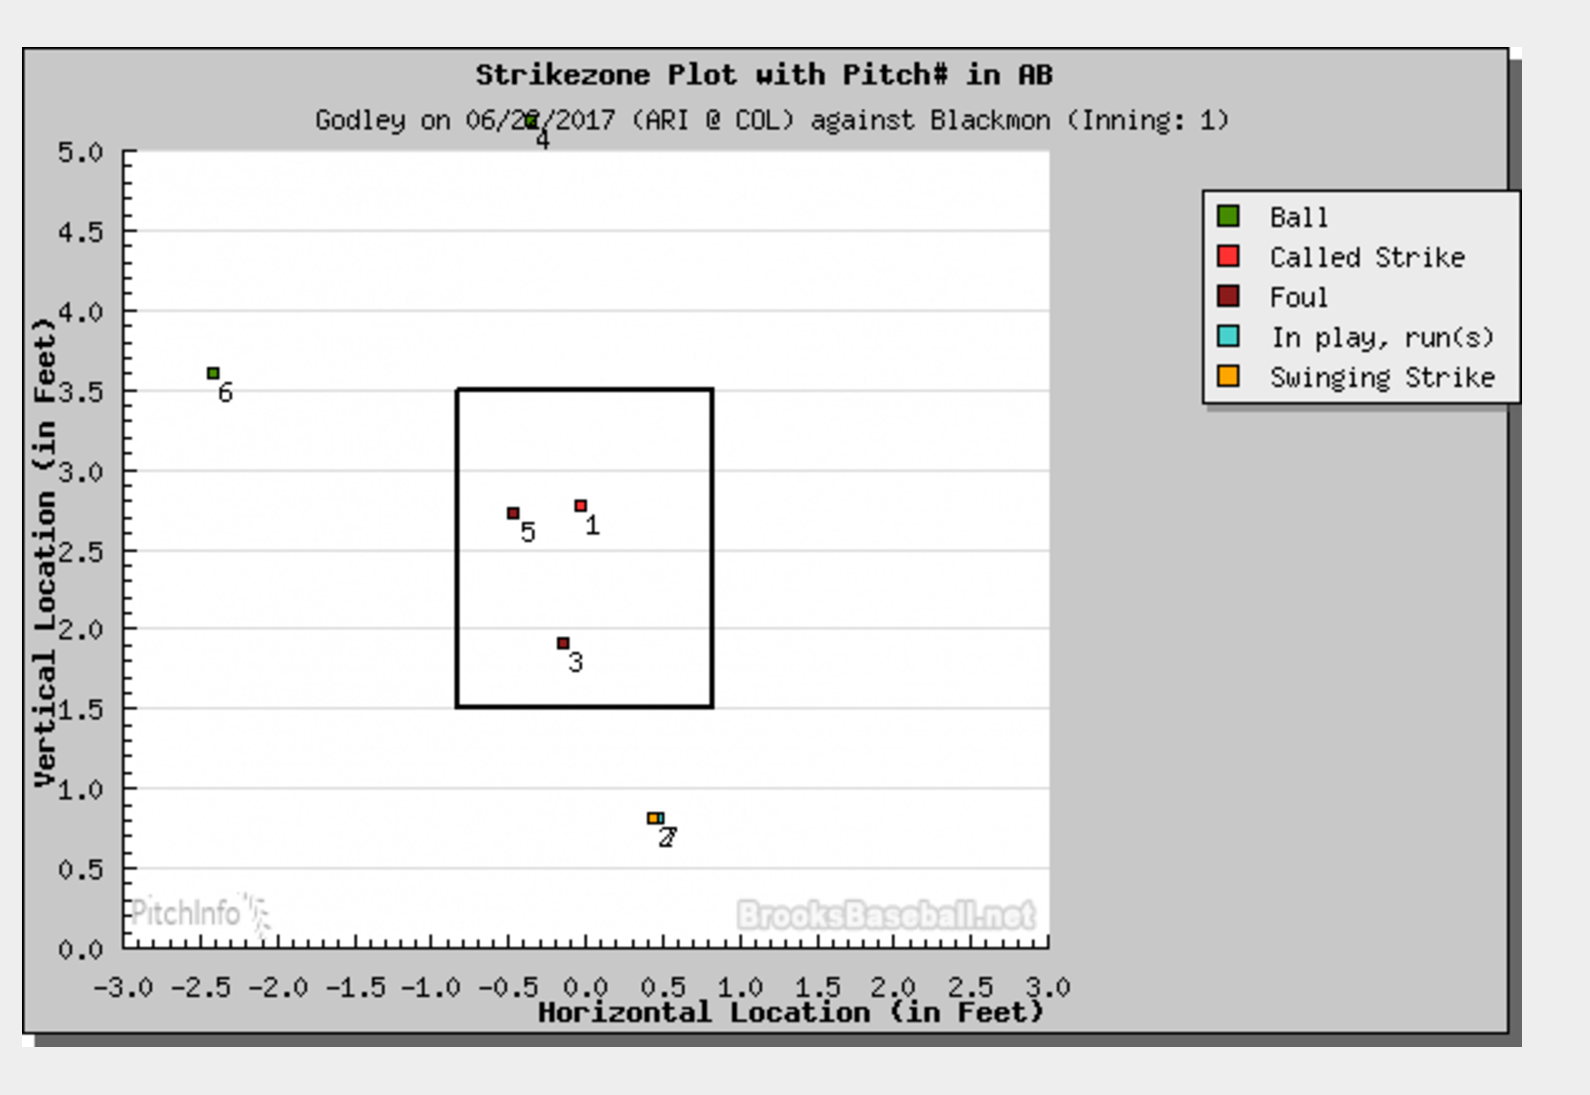
If you’re having trouble seeing the pitch, it’s because Godley threw the exact same pitch to Blackmon earlier in the AB (the #2 is covering the #7). The result the first time around was a swinging strike, as Blackmon went over top of it — as one would with a curveball in the dirt. Blackmon saw the exact same pitch later in the AB, and rather than take it, Blackmon decided to lift it over the outfield fence. Somehow, Blackmon managed to get under a pitch in the dirt. This pitch was .81 feet off the ground, via Trackman — if it was any more down, Blackmon would need a shovel to dig it out.

It’s no secret that players can golf pitches for home runs. Jonathan Hale of the Hardball Times showed that home runs significantly spiked on pitches that were thrown at a height of about one foot above the plate.

HR Rate versus height of Pitch, via Hardball Times

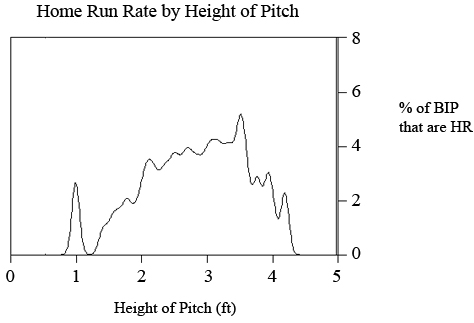
But there’s a very steep fall-off below that sweet-spot, mostly because baseball bats aren’t long enough to make contact below that point.

In order to make contact on this pitch, Blackmon needed to bend down on his back knee while keeping his front leg straight. Essentially, he needed to invent a new form of Yoga to drive this out.

Charlie Blackmon Swing Freeze Frame

This is an amazing feat from one of baseball’s hottest hitters. And it’s possibly one of the lowest pitches EVER hit for a home run.

Baseball Savant keeps track of almost every data-point anyone could ever want on every pitch of the past 10 years, including vertical height, and only eight batters have ever hit home runs off of pitches that were less than a foot off the ground (there’s a fun glitch where this Chris Coghlan home run appears as the lowest pitch off the ground at -4.8 feet — evidently someone placed a negative sign in front of a 4.8 foot figure).

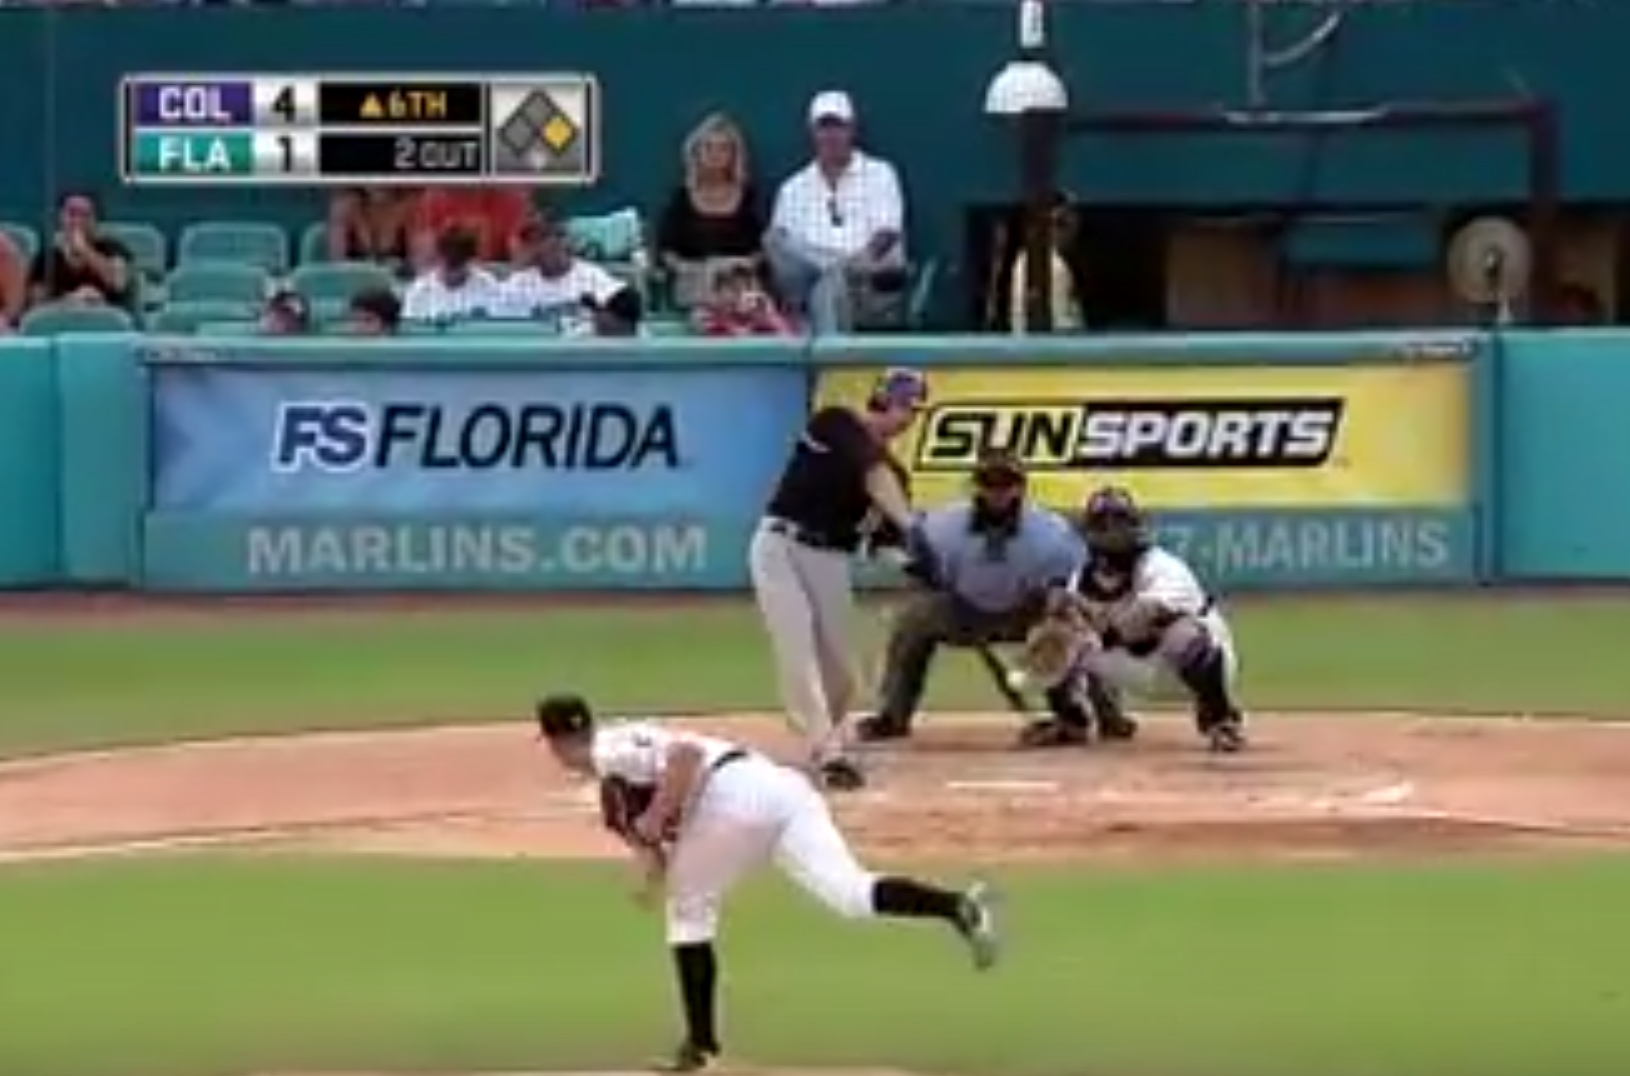
Coincidentally, Coghlan actually was present for the lowest pitch ever hit out, according to Baseball Savant. Brad Hawpe took a low pitch from Rick VandenHurk and put it way over Coghlan’s head, plating himself and Troy Tulowitzki.
Brad Hawpe low-ball HR

According to Baseball Savant, that pitch was hit when it was only ~5 inches off the ground, which makes it the lowest pitch ever hit out of the Pitchf/x era. But something’s a little fishy (and it’s not the Marlins) — at the moment of contact, the ball is clearly more than 5 inches off the ground. It’s certainly a low pitch, but it’s not quite at Hawpe’s ankles, unlike Blackmon’s pitch. Perhaps it’s a glitch from the early days of Pitchf/x.

Hawpe Contact Freeze-Frame

In fact, the same can be said of the second-lowest HR according to Baseball Savant — a pitch to Jonny Gomes at his knees is recorded as being 6 inches off the ground. It’s a reality of technology in that it’s not perfect every time.

The main takeaway, however, is that Blackmon might just have a legitimate claim to lowest-hit dinger of the past 10 seasons.

The biggest legitimate rival to Blackmon’s claim is probably Freddy Galvis‘ ankle breaker from 2013 against Jon Niese. Galvis adopts a similar approach to Blackmon in hitting this pitch, knocking one out at a height of only .81 feet off the ground. Pitchf/x appears to have this one right on the money — and it just so happens that it’s also the exact same height as Blackmon’s pitch was.

Galvis Dinger

So, according to Pitchf/x, Blackmon hit the lowest pitch out since Galvis. What’s really impressive is that Blackmon is about 5 inches taller than Galvis, so Blackmon needed to screw himself into the ground about 5 inches more than Galvis.

It’s a testament to Blackmon’s new-found power (or the generous park factors at Coors Field) that Blackmon managed to turn on such a terrible pitch and turn it into a home run. The anomalous dinger gods have visited Blackmon, and we should be thankful that they’ve graced us with the gift of this home run — we might not see another like it for a few years.


How Players Might Distinguish Risk in New Contracts

Player contracts can be fascinating because of how we tend to examine them. We can do it through a micro lens, figuring how each one impacts the shape of the team and its ability to compete; or we can look at them with a macro perspective and see how they do or don’t impact the overall business of a franchise. As fans and analysts, we usually go the micro route.

Part of going the micro route in examining player contracts is questioning whether a player just became overpaid or underpaid upon signing his new deal. Dave Cameron did just that when considering Jean Segura’s recent extension, expanding on how Segura may well have left money on the table when he inked his five-year, $70-million extension earlier this month:

Perhaps Segura just really likes Seattle, likes the ballpark, likes the organization, and isn’t as concerned about whether he’s on a sustained winner. But 18 months from free agency, it seems like he might have had a chance to earn more money on a team with a more certain future, so him taking an extension now is certainly a risk on his part, as he could end up as an underpaid asset on a team without enough around him to win consistently. That’s not what you generally want.

This is  a fair thought. Players rarely — if ever — have the chance to influence what the market will pay them, and where. Signing a deal that potentially pays anything less than maximum value, then, could certainly be regarded as shortsighted and a risk.

It’s at this moment in evaluating new contracts that it becomes worthwhile to ask: on whose behalf might the player be leaving money on the table, and for whom is it a risk? Them, or players down the line?

Players should absolutely push for every dollar the market is willing to pay them. This idea becomes emphasized when we remember how disparate the split in revenue is between players and owners. It doesn’t matter that the dollar amounts on both sides are absurd to most people. Players gain zero benefit by taking less pay.

But if we consider recent economic research, we might see why Segura didn’t necessarily push for every single dollar. Doctor George Simon comments on a study from Christian Bayer at the University of Bonn and Falko Juessen at Dortmund University that details how money doesn’t necessarily buy happiness but that levels of financial certainty do impact our general well-being. And the bottom line is Segura’s new deal still comfortably puts him in a mental place where he is “gaining steadily in [his] overall sense of security.” He can put in the same exact work as he did before signing this contract and feel much more at ease.

The real risk in deals like Segura’s, then, may be for other players in the future. The micro approach for him — the part of his signing that considers only the needs of Jean Segura and his family — is something he clearly finds satisfying. Otherwise, he probably doesn’t sign. But the macro perspective, or the one that would consider how his new contract could be used as a benchmark for others in the future, is probably left wanting.


The Super-Utility Men of Yesteryear

The utility player has made low-profile appearances on rosters throughout baseball history, but only recently fans, media, and ownership have come to appreciate the full value of their versatility. After the Cubs had so much success with utility players Ben Zobrist and Javier Baez in their title run last year, many teams are choosing to develop young talent into utility players instead of having them specialize in one position. While there are many Hall of Famers who played multiple positions over the course of their careers, most of them switched positions not because they were equally good at multiple positions,  but because they were good hitters who became defensive liabilities at their previous position. My hope is that that will change within the next 20 to 25 years as some of baseball’s top talents are groomed for the new super-utility role.

Before we marvel at these young and exciting players of today and tomorrow, let us take a moment to reflect on the super-utility men of yesteryear.

Melvin Mora

Melvin Mora debuted as a Met in 1999 and immediately was used all over the field, playing six positions in 66 games that season. Over the course of his career, he had six seasons where he played at least three different positions in the field. In total, Mora appeared in 908 games at 3B, 194 at SS, 174 in LF, 158 in CF, 48 at 2B, 29 in RF, 27 at 1B. Only pitcher and catcher eluded him. He had a career combined +3.1 DWAR, never having a season below -.8 DWAR. In addition to being a huge asset in the field, Mora was a 105 OPS+ hitter over 6,158 career plate appearances.

Juan Uribe

While Juan Uribe’s six-foot, 245 lb physique may have looked out of place on a baseball field, he was a true gem of a fielder, accumulating +15 career DWAR across five different positions. Over the course of his entire career, he appeared in 917 games at SS, 644 at 3B, 228 at 2B, 4 at 1B, and 1 in CF. His value as a fielder is what kept him around for so long; even though he hit 20+ home runs on four separate occasions, he was a career 87 OPS+ hitter.

Placido Polanco

If you are a hardcore baseball fan, you may know that Polanco is one of two players to win a Gold Glove at multiple positions (two at 2B and one at 3B). However, I think very few people realize that he ranks first all-time in fielding percentage at BOTH of those positions! In addition, if he had only played 214 more innings at SS (equivalent to just under 24 games), he would have ranked 6th all-time in fielding percentage there as well! In addition to playing in 1,027 games at 2B, 751 at 3B, and 122 at SS, he appeared in 5 games in LF and 1 at 1B and finished his career with +18.1 DWAR, good for 65th all-time. In addition to being a superb fielder, Polanco was an accomplished contact hitter as well, batting over .300 five times and .297 for his career.

Gil McDougald

A central part of the 1950s New York Yankees, McDougald could be one of the most overlooked players of all time in terms of Hall of Fame consideration. He never received higher than 1.7% of the vote despite being a part of five World Series championship teams and averaging +4 WAR per season over his 10-year career. A large part of that value came from his play in the field, where he played in 599 games at 2B, 508 at 3B, and 284 at SS. Over the course of his career, he accumulated +14 DWAR, never having a DWAR under +.4 and having at least +1 DWAR in 8 of his 10 seasons. In addition to his elite defense, McDougald was a career 111  OPS+ hitter.

Craig Biggio

The first and only Hall of Famer on this list, Biggio almost didn’t make my cut because he only had two seasons where he appeared in at least seven games at more than one position. Despite not displaying much fielding diversity within seasons, though, Biggio accumulated 1,989 games at 2B, 428 games at C, 255 games in CF, 109 games in LF, and 2 games in RF over his career. At the time,  he was regarded as an above-average fielder, earning four Gold Gloves at 2B. His -3.9 DWAR is somewhat misleading because he played for so long after his defensive prime due to being a Hall of Fame hitter. Over his 20-year career, Biggio earned Silver Sluggers at both catcher and second base, and had a career OPS+ of 112.

Pete Rose

Like Biggio, Pete Rose didn’t display spectacular fielding diversity within seasons, but over the course of his career the Hit King appeared in at least 73 games at every position in the field except pitcher, catcher, and shortstop. To be exact, he appeared in 939 games at 1B, 673 in LF, 634 at 3B, 628 at 2B, 589 in RF, and 73 in CF. That’s a lot of games. While his hitting accomplishments are well documented, few people realize that Pete Rose actually won two Gold Gloves during his career as well. Whether he deserved them or not is another story (-14 career DWAR) though to his credit, he had a modest -0.1 DWAR during his first 12 seasons while playing 2B and OF. Despite not being the finest fielder of the bunch, and though he is not a Hall of Famer like Biggio, Pete Rose, aka Charlie Hustle, is the quintessential super-utility player, championing the gamer-ship that all utility players must have to earn the title “super.”


Understanding Player Contracts from a Business Perspective

As statistics have become more advanced and public, we’ve gained myriad ways to understand baseball more in depth. We don’t just know that Aaron Judge smacks the crap out of the ball; we know that he can hit it out of the park at more than 120 miles per hour. We don’t just know that Yu Darvish’s pitches can dive all over the zone, but that they have an average spin rate of more than 2500 revolutions per minute.

While those stats represent single facets of a player’s game, there’s one that incorporates everything they do to give a sense of their overall value: Wins Above Replacement, or WAR. Depending where you find your stats — there’s fWAR from FanGraphs or bWAR from Baseball Reference — there will be subtle differences in how it’s calculated. But the point is the same: to tell you who the best and worst players are compared to anyone who could replace them.

WAR is the type of stat that enables us to react in real time, and with relatively sound reason, to newly-signed contracts. It’s how we can say Kevin Kiermaier’s deal is probably a notable win for the Rays and why Ryan Howard’s last extension was premature at best.

The reality we shape as observers and fans often looks at these contracts under a microscope, and only under a microscope. When a guy strikes out looking to end a rally, or gives up the hit that sparks one, that’s when we notice. And, fair or not, those moments craft the narratives we often carry throughout the life of a player’s contract.

Zooming out is helpful, though. In certain context, there might not be such a thing as a bad contract.

image

Owners have been raking in the money for a long, long time. They’ve pretty much always taken home more than the players and in recent years that difference has only grown. When you consider that there are only ever as many owners as there are teams, and that the players’ share is split hundreds more times, the disparity becomes emphasized.

If we want additional perspective, we can look at how the percent of overall revenue accounted for by player salaries has decreased almost annually like clockwork.

image

Revenue data goes beyond that which fans and analysts use to justify a point of view on a player’s worth to their team. Those trains of thought spur additional conversation about how a given contract can influence the team’s composition and ability to compete for championships. And these points may well hold water. But they probably don’t provide much influence on the business perspective.

No matter how good or bad a contract is, a team is likely still profitable and operating within a relatively certain margin of error that isn’t dramatically different than if they didn’t have that deal on the books.

That’s not to say owners don’t care about a bad contract. It’s just that, at an operational level, they have to concern themselves with the bottom line first and foremost because it’s what allows them to persist. Sure, the big deals that go sour are disappointing to them, but they’re not damning.


The Top Elevating Team in Baseball Is…

…the New York — not the mashing Yankees, but the Mets. Unfortunately I had a hardware crash so I currently can’t pull reports from Statcast and thus I now take ground-ball rate as a measure for elevation instead of launch angle. I prefer grounder rate over fly-ball rate because that tells you the “off the ground rate” (100 – gb%). Since liners are also very good I think they should be included.

The Mets have faced a lot of heat from sabermetric fans and sometimes for good reason, like their lowish OBP, neglecting defense and handling injuries.

But there is one thing they have done for a couple years now and that is elevate the ball.

In 2015 they had the third-lowest grounder rate in the majors at 41.9%, only trailing the Astros and Yankees. That means 58.1% of their balls were off the ground.

In 2016, after losing the poster boy of the fly-ball revolution, Daniel Murphy, they improved their grounder rate to a clearly league-leading 39.5% (almost 2 points on the second-place Rays). That improved their off-the-ground rate to over 60%.

In 2017, despite a lot of injuries, the Mets have even improved their GB rate to 38.2%, but they’ve been exceeded by the A’s.

Overall, the Mets clearly lead the Statcast era with a 40.3 GB%, almost 2 points ahead of the second-place Tigers.

The elevation also leads to power output, as they are 7th in ISO (only NL team ahead of them is the Rockies) and 6th in HR (top NL team, even ahead of the Rockies). Granted, they are only 21st in OBP, and negative in defense, so they are not without flaw, but there is no doubt they were built to elevate and mash, and that is by design.

Now did the Mets teach that or acquire elevation?

Looking at some long-time Mets:

Curtis Granderson

2013(Yankees): 33.8%, 2014: 34.2%, 2015: 30.8% , 2016: 36.4%, 2017: 31.3%

Granderson was a FB hitter when the Mets got him.

Daniel Murphy

We all know about him. 50% grounders in 2012 and improved that to 42% in 2013 and then more.

Lucas Duda

Always was a FB hitter with sub-40% grounder rates since the minors.

Yoenis Cespedes

Was a FB hitter when they got him (upper 30s grounder rate) but became a more extreme FB hitter in NY. This year he is running an insane sub-30% grounder rate.

Travis d’Arnaud

He started out in the mid-40s and then had some ups and downs with a very bad 50% rate last year, but this year he is down to 39%. We will have to wait to see whether that is sustainable.

Michael Conforto 

Sightly improved his grounder rate over his career from low-40s to now high-30s.

And then there is Jay Bruce who was acquired as a fly-ball hitter and became an extreme fly-ball hitter.

It seems like elevation was mostly acquired, but there are or were players who learned to lift more with the Mets. I assume it is at least encouraged by the Mets that hitters hit everything in the air.

The Mets have earned their share of criticism with some things they have done, but when it comes to the fly-ball revolution, it is they who deserve credit as the leaders of the fly-ball revolution, and probably moreso than the saber-darling teams like the Cubs or A’s, who are usually cited when talking about the fly-ball revolution. I’m not saying those teams did not target air balls, as the A’s have the 5th-lowest and the Cubs have the 7th-lowest grounder rates during the 2015 to 2017 to date time frame, but the leaders have clearly been the Mets.


How the Astros Could Not Win the Division

98.4 percent is pretty good odds, correct? According to Baseball Prospectus, those are the current odds that the Houston Astros win the American League West. Houston has dominated the headlines and other teams thus far in the MLB season. The ‘Stros are 42-18, and 12 games up on the .500 Seattle Mariners, who are in second place. It looks like a lock that the Astros are going to win the AL West. I am here to explain to you how the Seattle Mariners can overtake the Astros. Let’s start by analyzing how some of the most important Astros may be due for regression.

Jose Altuve

Altuve is a flat-out stud, and looks to be well on his way to a fourth straight 4-WAR season. There is not that much to worry about looking at his stats this year, but I am going to nitpick. Altuve’s BB/K rate has plummeted this season to the lowest point in his career at 0.61, which is .25 lower than his mark a year ago. Also, take a look at his power numbers relative to some percentages over the last few years.

Home Runs Pull% Soft% GB%
2013 5 32.9 13.4 .49
2014 7 41.8 17.9 .48
2015 15 45.3 19.8 .47
2016 24 45.3 13.6 .42
2017 8 39.6 18.8 .53


Altuve is on pace for about the same amount of home runs as his career high 24 last year, but some numbers point to him hitting fewer balls out of the ballpark. Generally, those who pull the ball have more power, as has been the case with Altuve. This year though, Jose is pulling the ball much less, and is having more soft contact than any full year of his career other than 2015. Also, Jose is hitting a lot more ground balls, a sign of fewer home runs, which so far has not been the case. Additionally, it is not like the second baseman’s average is up with the decrease in fly balls, as it is down 12 points from a year ago. Not only is his average lower, but his BABIP is higher than it has been at any point in his career, a sign of luck. Jose is known for his ability to make contact at nearly anything, but his contact rate his dropped significantly to the lowest point in his career at 84.5%. Lastly, while a quick player, Altuve has been a below-average fielder as far as range is concerned over his career with the exception of 2015. This year, it looks a little unsustainable that his range runs above average is positive.

George Springer

Springer has had a very solid season thus far for Houston, and I had some trouble finding a reason not to believe it will not continue. I soon came across one stat that was very telling. Springer is on pace for over 43 home runs, which would shatter his career high. He is hitting about the same amount of ground balls, liners and fly balls, but his home run/fly-ball rate is an absurd 31.4%. Expect that to normalize and some of those wall-scrapers to be warning-track shots. Also, while a player can improve defensively, they usually do not improve as much as Springer has thus far this year. His UZR/150 in 2017 is almost twice as high as it ever has been in his career.

Carlos Correa

Correa has always been a player loaded with potential, drawing comparisons to Alex Rodriguez. Correa has lived up those expectations for the most part this season, but some of that may be due to luck. His BABIP is very high at .353, 30 points above his career average. Correa defensively has been interesting as well and has been better this year, but it may be unsustainable. The Houston shortstop has been below average as far as errors committed are concerned, but has shot up to above average this season.

Dallas Keuchel

The former Cy Young award winner has other-worldly stats this year. Keuchel was unlucky last year, but appears to be getting a little lucky this year. His ERA is an insane 1.67, but his FIP, a better measure of run prevention, is a much more realistic 3.02. His Left on Base rate is also much higher than it has been at 88.8, a tenth of a percent out of the highest in the majors. Both of these stats indicate luck. Another statistic that does the same is BABIP. Obviously Keuchel is inducing more weak contact this year, but not normally enough for his BABIP to drop over 80 points from a year ago.

Mike Fiers

Upon first glance, Mike Fiers has not a good season, with an ERA in the high-4s. Further research, though, makes it clear that his 2017 campaign may be getting a lot worse soon. His FIP is at a massive 6.53, the second-highest in all of baseball. Also, his BABIP is just .289, over 30 points lower than last year, leading us to think he is not getting that unlucky as far as balls dropping in that would not normally be hits. Fiers’s LOB% is higher than it has been in any full MLB season for him at 86.0 %. The veteran right-hander has had a bad year, but it could get worse soon.

—–

Now let’s take a look at the Seattle Mariners. I actually picked the M’s to win the west preseason (I hope I did not just lose all my credibility). I’ll highlight five players in Seattle that could lead to some success in the Pacific Northwest.

Robinson Cano

The M’s simply will not succeed unless Cano is phenomenal. And while he has been good this year, there are some signs that could point to him being better. His walk rate and strikeout rate are both the best they have been since 2014. That combined with his highest hard-hit percentage of his career, should point to great offensive success. More good news for Cano comes when you look at his O-Swing%, as it is down from a year ago, meaning he is swinging at fewer balls. His contact rate too is the highest it has been since 2014. His BABIP is also the lowest it has been in his entire career, majors and minors included.

Kyle Seager

The Mariner third baseman has been one of the most consistent players in the majors, and had a career year in 2016. This year, though, he is struggling a little bit. His wRC+, a measure of how productive a player is relative to league average, is the lowest it has been since his rookie year. Seager’s baserunning this year has been the worst of his career already, as measure by UBR. This, like defense, is something that is subject to skewed numbers in small sample sizes, and his baserunning should improve to around league average. Another reason for optimism is Seager’s HR/FB%. It has dropped all the way to 8.5%, over 6% lower than last year. Also, his BB% is the same as it was last year, but it should soon rise as evident by his O-Swing%. Seager is swinging at by far the fewest amount of balls outside the strike zone in his career.

James Paxton

Time to brag. I picked Paxton to be in the top three of AL Cy Young voting this year. He has been injured, but him coming back for this Mariner club, and I want to explain just how dominant he has been and is capable of being. He has reached 2.0 WAR in just 48 innings this year. His FIP and ERA are both sub-2, a sign that this success is not all due to luck. His WHIP, a good indicator of future success is the lowest it has been in any full season of his. His Hard% is the lowest of his career, and Paxton’s LD% is by far the lowest it has ever been. To do that with his uptick in velocity is very impressive. Speaking of the rise in velocity, he has been able to keep relatively the same speed on his changeup, increasing the discrepancy between the speed of the pitches. Paxton has all the ability to perform like a true ace the rest of the way.

Felix Hernandez

Hernandez will be coming back soon from injury, but has not performed up to standards of one affectionately called ‘The King.’ There are reasons to think he may turn it around though. He is throwing a greater percentage of strikes than he ever has. The main portion of those pitches thrown are fastballs, and while his fastball velocity is down from his career average, it is up from last year. There are some signs of bad luck too, as his HR/FB% is by far the highest it has ever been, while he’s still inducing fewer hard-hit balls than a year ago. Also, his xFIP is well over a run lower than his actual ERA. Felix may not be the King that accumulated 5.8 WAR a year for a six-year span anymore, but he can still be very effective.

Yovani Gallardo

Gallardo is now on his fourth team in four years, and is having the worst statistical season of that span. His ERA is over six, which obviously is a cause for concern, but his xFIP is in the mid-fours. His HR/FB% is the highest of his career, and his BABIP is the second-highest it has ever been. Additionally, his LOB% is the lowest it has ever been. His stuff is not all bad, though, as his fastball in over 2 MPH faster than it was a year ago. He is also inducing the most swing-and-misses since 2012.


The Free Agent Value of Michael Pineda

Michael Pineda is having by far the best season of his career ever since he broke into the big leagues with Seattle in 2011. This is good news for Pineda who is in a contract year and looking to earn a huge payday on the open market this winter. However, this is bad news for teams, especially the Yankees, who have many questions surrounding their starting rotation with CC Sabathia also in a contract year and Masahiro Tanaka having the chance to opt out of his current contract after the season (although the latter seems unlikely at the moment). Pineda reminds me of one player in particular: former Yankee Ivan Nova.

Like Pineda, Nova has a fastball in the mid-90s and good secondary pitches, including a nasty curve and a change-up which he has begun to develop under Pittsburgh Pirates pitching coach Ray Searage, aka “the pitcher whisperer”. While Nova’s strikeout numbers have gone down, he has learned to pitch rather than just throw, which has resulted in fewer guys getting on base against him as well as his K/BB ratio going down, which I believe have been key contributing factors to his success in Pittsburgh. Also like Pineda, Nova hit the ground running, going 16-4 with a 3.70 ERA in 2011, and he was arguably the Yankees’ second-best starter behind Sabathia. However, as teams began to expose tendencies, combined with mounting injuries, Nova was never able to maintain the same level of success in New York.

The same could be said for Pineda, who missed two full seasons and most of 2014. Even after coming back in 2015, Pineda still struggled to maintain any level of consistency, after posting respectable numbers as a rookie. Now, Pineda has harnessed the power of his wipe-out slider and has become a ground ball pitcher (51.5%) to cope with the home-run haven that is Yankee Stadium. His K/BB ratio has gone down and his WHIP has dropped from 1.35 to 1.13 this season. The formula is simple: the fewer baserunners there are, the better a team’s chances are of winning. Also, like Nova, Pineda is using a change-up more in his pitching repertoire, to complement his slider. As a result, he has generated a 43.3% swing and miss percentage on pitches outside the zone, a 7% increase from last season. Additionally, they are close in age, since Nova was 30 when he signed his new contract, and Pineda will be 29.

The Pirates ended up giving Nova a three-year, $26-million contract last offseason. As long as Pineda continues to have success this season, he will also end up getting a similar deal. I predict he will end up staying with the Yankees for three years for somewhere in the range of$36-39 million simply because the Yankees will be desperate for starting pitching and may even pay a little bit over his market value to keep him. These types of deals are always risky, and many look to the Dodgers signing Rich Hill. However, Pineda has proven that he has always had the talent to pitch in New York and it seems that he finally has his head in the right place to help him reach his full potential. I believe that the Yankees will also re-sign Sabathia to a one-year deal in the range of $5-10 million, considering he will be 37 next season. If the Yankees manage to acquire another lefty or even sign Jake Arrieta, the Yankees starting rotation could be something to look out for in 2018.


Curveballs Are Underutilized Early in the Count

I got the idea for this article thinking about pitching strategy. It makes sense to me that getting to two strikes for a pitcher is an important strategy for good performance. With two strikes, pitchers can get a hitter to swing out of the zone and either make bad contact or miss completely, two of the best possible results for a pitcher. The problem is, how does a pitcher get there without getting knocked around? If a pitcher throws a meatball down the middle in order to get early strikes, good hitters may take advantage and hit the ball hard before the pitcher can get to that good situation. So if a pitcher can throw a strike early, and maximize the chance a hitter chooses not to swing, that seems like the most effective strategy to get to this situation. The research below suggests that if this is the case, throwing a curveball high in the zone early might be a great strategy that almost no one uses.

I initially looked at first pitches going back from the beginning of 2016. I wanted to see which pitches had the highest swing rates on 0-0 counts. I was fairly certain that we would see fastballs with the highest swing rate. To my surprise, changeups have the highest swing rate, despite the lowest zone rate. Curveballs had the lowest swing rate. Below is the breakdown.

Changeup: 34%

Fastball: 29%

Slider: 29%

Curveball: 18%

The changeup swing rate suggests a well-placed changeup on the edges or out of the zone can be a good pitch to throw on the first pitch on occasion. However, with a curveball, you can throw it in the zone and not get a swing a large amount of the time. Given a pitcher’s goal to get to two strikes, the most advantageous count state for him, throwing first-pitch curveballs seems like a smart idea. However, this is not the strategy we generally see from pitchers. Below is percent of pitches thrown on first strikes.

Fastball: 60%

Slider: 14%

Curveball: 9%

Changeups: 7%

These frequencies suggest why changeups are so effective at getting swings out of the zone on 0-0 counts. Pitchers overwhelmingly throw fastballs early in counts, so when the changeup comes, it is very hard to distinguish it from the fastball, which a hitter will expect most of the time.

There are some practical reasons why pitchers throw mostly fastballs on 0-0 counts. First off, they are much easier to command, and as stated earlier, throwing in the zone and getting to two strikes is the main goal for a pitcher early in the count. Offspeed pitches, on the other hand, tend to have much more movement and can be harder to locate. Second, swings and misses aren’t a big deal without two strikes. Fastballs tend to have higher contact rates than offspeed pitches, but contact rates are much more relevant when whiffs lead to strikeouts.

But there are a few reasons why it makes sense for curveballs to be a go-to pitch early in the count. Some pitchers do locate the curveballs very well. Rich Hill is a great example. He famously throws his curveball about 50% of the time, throwing in the zone about 55% of the time the past three seasons. Throwing his curveball so often is probably why hitters swing so little against Hill despite his incredibly high rate of throwing the ball in the zone. Throwing his curveball, especially early in the count, may be a big reason behind Hill’s resurgence.

My next piece of research was looking at pitches high in the zone. I hypothesized that when pitches are located in the part of the zone that moves opposite to the pitch’s movement, hitters would swing less. For example, curveball breaks sharply downward, so a curveball high in the zone will look out of the zone to the hitter, therefore garnering less swings. I think this is logical and probably a well-known concept, but it was something I had never looked into.

I looked at all pitches thrown in the upper third of the zone on non-two-strike counts. Separating out curveballs and non-curveballs, the swing rates were vastly different.

Curveball swing rate: 26%

Non-Curveball swing rate : 65%

The results were overwhelming. There is nearly a 40% difference in swing rate between curveballs and non curveballs high in the zone. Hitters swing a lot high in the zone in general, but with curveballs they barely swing at all.

Very few pitchers utilize high curveballs without two strikes. The ones that do are a mix of bad and good pitchers. Of all pitchers who threw more than 200 curveballs on non-two-strike counts, Carlos Martinez had the highest percentage in the upper third of the zone, 15.3%. Hill is up there as well at 12.7%. But so is Paul Clemens at 14.6%, one of the worst pitchers in baseball. Jake Arrieta was the lowest at 3%, and he’s one of the best.

Early in the count, changeups and fastballs tend to have high swing rates, while curveballs tend to have low ones, especially high in the zone. Pitchers mostly use fastballs early in the count, but sparsely curveballs. While it makes sense to throw curveballs low with two strikes in the count to get swings and misses, this research suggests that a high curveball is an underutilized pitch early in the count.


Fixing “On Pace” Numbers

Suppose I tell you that a baseball team has just started the season 10-0. You literally know nothing about the team besides this information. What is a reasonable expectation for the number of games this team will win? Even if you don’t know the answer offhand, you probably know that the answer is not “162.” Tom Tango has been taking to Twitter recently to mock these “on-pace” numbers, and for good reason — saying the above hypothetical team is “on pace” for 162 wins has no real meaning in reality. So how do we fix it? I’m going to proceed in a way that a Bayesian statistician might, but mostly explaining the logic behind the reasoning, rather than going through any complicated math. So follow me if you want to see how a statistician thinks.
Read the rest of this entry »


How Valuable Is a First-Round Draft Pick?

How valuable is a first-round draft pick?

The draft is one of the most important resources for teams to add players that allow their organization to move in the right direction. But how quickly do these top-rated amateur players make a splash, and is it with the team who selected them?

Objective

My goal with this project was to analyze the type of overall impact first-round draft picks have on the organization that drafted them and observe how quickly an impact was made. Many first-round prospects are expected to move successfully through the ranks of the minor-league system, with the idea that they will impact their big-league affiliate in the near future. This of course isn’t always the case even for can’t-miss amateur prospects, as it is well known that only 10% of players in the minor leagues will make it to “The Show.” All players have different ways of developing and adapting based on the level of baseball they are drafted out of (High School/College), as well as what type of minor-league development systems they become part of moving forward.

In this analysis, I looked at the first-round draft classes from 2006-2010, which gave me a sample size of five different draft classes. The value of a prospect, especially in the first round, is in his potential to produce at the Major League level during his first six seasons of service time. This of course is based on Major League Baseball’s salary system that pays players very poorly, most of the time (relative to their market value), for their first six years of service time before becoming eligible for free agency. This is the reason why I chose five draft classes, with the last class just finishing up their sixth possible year of service time and becoming eligible for free agency following the 2017 season.

Method

The sabermetric stat that I used to analyze these five first round draft classes was WAR (Wins Above Replacement). I chose WAR because it is an analytical way to look at a player’s overall value to their team, while also being able to compare players from different timeframes in baseball, such as the first-round draft class from 2006 to the first-round class in 2010. The values are expressed in a format of wins so I can look see pick A is worth 5.2 wins to his team, while pick B is worth 7.8 wins to his team in that given season.  As a measure of their success, I looked at the full first-round draft classes from 2006-2010 and calculated the WAR of each class through the first six years of possible service time. For the 2010 class I calculated their WAR heading into the 2017 season. Calculating the WAR ranking for each class gave me a better understanding of just how impactful certain first-round picks have been for their team within their first six years of club control. My analysis also revealed the large number of highly-touted prospects drafted in the first round (outside of the Top 10) who failed to make substantial contributions to their team on the field. When calculating the WAR through the first six seasons of possible ML service time, I was also interested in looking at whether these picks were selected out of High School or College and the total amount of service time they had within through the 2016 season.

By The Numbers

2006: HS – 13, College – 17

Avg. ML Service Time – 3.66

Avg. WAR – 4.05

—————————————-

2007: HS – 17, College – 13

Avg. ML Service Time – 2.60

Avg. WAR – 3.00

—————————————-

2008: HS – 9, College – 21

Avg. ML Service Time – 3.35

Avg. WAR – 2.83

—————————————-

2009: HS – 17, College – 15

Avg. ML Service Time – 2.06

Avg. WAR – 3.68

—————————————-

2010: HS – 17, College – 15

Avg. ML Service Time – 1.04

Avg. WAR – 3.65


Conclusions

  • First and foremost, there is no exact science as to whether a first-round draft class will be comprised of more high-school players or more college players. It depends on the stock each year. In 2006-2010 the most skewed first-round draft class between the two levels of play was in 2008 when there were 21 players drafted out of college and just 9 out of high school. This class also owns the lowest average WAR at 2.83 through their sixth season of service. The class is carried, far and away, by Buster Posey (#4 out of FSU) who owned a combined 22.8 WAR rating through his sixth season with 6.161 seasons of service time through 2016 (1st in class). The remaining 29 picks in the 2008 draft combined for just a 2.14 WAR through their six team controlled seasons, led by Brett Lawrie (12.2 WAR), who is currently out of Major League Baseball.


  • The class with the highest average WAR through their first six seasons is the class who has been around the longest; the 2006 1st round draft class with a 4.05 WAR. The class production within their first six seasons also went more with the stereotypical draft script as four players within the top 12 picks exceeded a 10.0 combined WAR through their first six seasons (College #3 Longoria 29.8,  HS #7 Kershaw 24.3, College #10 Lincecum 23.9, College #11 Scherzer 11.4). Picks 12-30 combined for a minuscule 0.97 WAR.


  • Although it seems that all we hear about when it comes to top 10 picks in drafts are those who failed to perform up to the expectations, there is something to be said for the production a top-5 pick can bring to an organization. In my WAR calculations, the #1 and #4 picks from the 2006-2010 draft classes owned the top two average WAR rankings, with the top pick averaging out to 10.98, and the fourth pick averaging out to a 11.68 WAR ranking. Picks 1-5 from 2006-2010 combined for an average WAR of 7.51 through six seasons.


  • The numbers show that teams who are in rebuilding modes have a distinct advantage at developing their farm system, and in turn their big-league clubs, with a top-10 pick. The 50 players selected in the top 10 picks from 2006-2010 combined for an average WAR of 6.236. While picks 11-32 (104 total players) combined for just a 1.84 average WAR across their first six seasons of service time.


  • There’s an argument to be made for the average player drafted out of High School taking a bit longer to develop into a big-league player than that of a player who has been drafted out of college. The WAR numbers of the first-round draft picks from 2006-2010 speaks to this theory as well. First-round college draft picks produced a higher WAR than those drafted out of high school in four out of the five draft classes I analyzed. First-round selections out of college produced an average WAR of 4.21, while players drafted out of high school produced an average WAR of 2.59.


Wins above replacement isn’t a tell-all story, and neither are the first six years of a professional baseball player’s career. It is, however, a nice way to analyze the overall contribution and impact a player can have for his team, and the first six years gives us a glimpse at just how quickly a team’s investment might pay off.