Archive for Uncategorized

Another Thing Joey Votto is Great At

If you walked up to me and said “Joey Votto is the best player in baseball”, I’d have a hard time finding a good argument against that. Heading into his twelfth season, Votto has been one of the most consistent players in the league. From 2007 on he’s played at least 110 games each year, with the exception of his rookie year and the injury-shortened 2014 season.

Using a summary of his last three years, you’ll see he’s been at or near the top in almost every major statistical category used to evaluate players.

  • Fourth in overall WAR
  • Second in Batting Average
  • First in On Base Percentage
  • First in BB/K rate
  • Third in Win Probability Added
  • Second in Weighted Runs Created Plus

Does Votto leave anything to be desired? Well, of qualified first basemen, he ranks 12th in DRS (3) and 16th in UZR/150 (2.6) since 2015. So if you could get on him for anything, it would be his fielding.

Hitting a baseball is one of the hardest feats to accomplish in any sport. I would venture to guess, whether you’re the pitcher or hitter, that a full count creates the most tension on the baseball field. I don’t think it takes a Bill James-like brain to figure out that 0-2 is a very tough situation to be in at the plate; the scales tipped heavily in the pitcher’s favor. Game tension is a fun energy to experience in baseball, which leads me to stick with looking into the more balanced full count.

Would you be surprised if I told you that no one has performed better in recent seasons under those conditions than Votto? But first, behold the predictable OPS under all two-strike counts!

  • 0-2, .389
  • 1-2, .419
  • 2-2, .470
  • 3-2, .814

Digging into the specifics of a full count, 30% of hitters get walked and 46% reach base. Votto is one of those 46%-ers. In fact, since 2015, no other hitter had a better wOBA under a full count than Votto.

Pretty impressive at the plate to begin with, every aspect of Votto’s at-bats are above average; needless to say, you’re going to have your work cut out for you when he comes to bat.

vottoPlateDiscipline

Votto has an advanced eye, which you can tell by only looking at his swings out of the zone; at least 10% lower than league average. On the other hand, he seems to make contact more than average when offering at those pitches. But, only achieves a paltry .219 when putting the ball in play. Regardless, pitchers have to be pretty careful with what they do to get him out lest he ends up on base and/or putting crooked numbers on the scoreboard. We’ll get to that in a minute.

Getting back to his production with a full count, we have three other hitters within reach of Votto. The qualifying threshold is 200 at-bats (regular and postseason), of which 28 hitters qualified. The following are tops in wOBA when faced with a full count. After that foursome, there is a very sharp drop off.

  1. Votto- .481
  2. Matt Carpenter- .480
  3. Kris Bryant- .467
  4. Mike Trout- .461

Votto and Carpenter are very close, one one-thousandth of a point, but Votto has been in this position 111 times more. The averages keep them close but there is no way to be certain Carpenter could keep that number consistent as his at-bats go up.

scatter(4)

No real correlation there but Votto and Bryant are the clear outliers; Carpenter and Trout are with them as well but are a bit further back in terms of pitches.

Votto also has the highest percentage of 3-2 counts in terms of pitches faced with 7.12% of his pitches being delivered in that situation; again with a minimum of 200 ABs. That’s an attribute to his plate discipline.

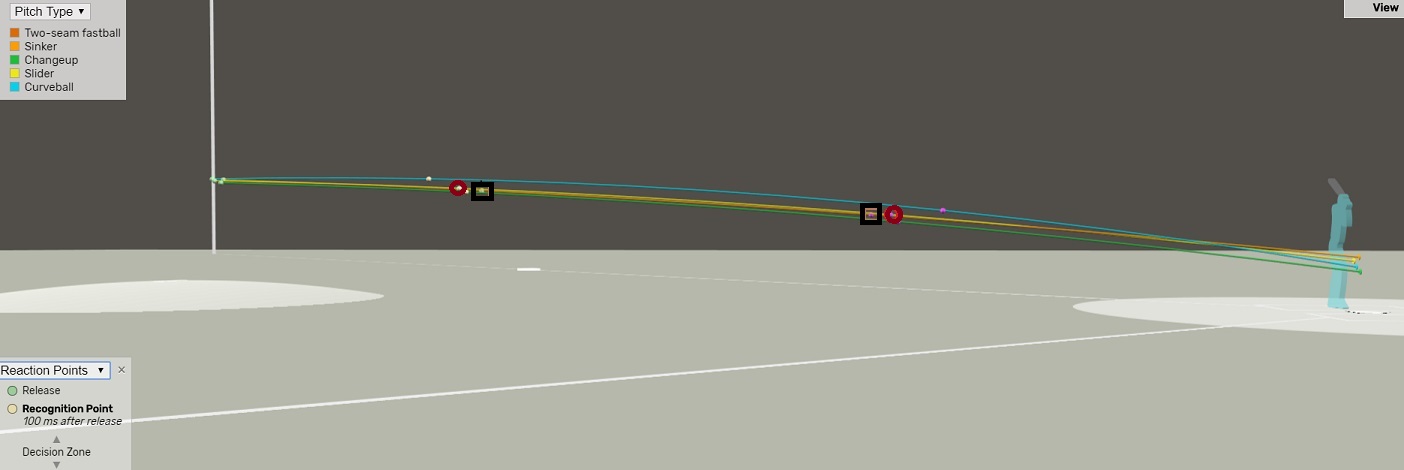
So how has he been so successful? This is where things get interesting. When Votto is faced with a 3-2 count, look where the pitches he has to work with are concentrated.

vottoHeatMap32

Furthermore, take a look at his career batting average based on zone location.

vottoBA

For whatever reason, pitchers seem to be content delivering a 3-2 pitch right into Votto’s butter zone. To be specific, the three pitches thrown at him the most in a full count are:

  • 34.8% Four-seam Fastballs
  • 17.2% Two-seam Fastballs
  • 17% Sliders
  • 9% Changeups

Almost half of the pitches thrown are fastballs of the two and four-seam variety. Guess what Votto eats up?

votto4Pitches

Those are the pitches Votto has seen the most since 2015. Coincidently, they are not only the four he sees most in 3-2 counts but also, with the exception of the slider, the pitches he has the most success against.

There are some pitchers don’t throw a slider but what I don’t understand is why they try to beat him with a fastball almost 50% of the time. It obviously doesn’t work. I’ll try to quantify as best I can, the situations Votto comes to bat under. Just going on what I have in the previous charts, maybe there aren’t many high-leverage situations when its Votto’s turn to hit.

For his career, he’s come to the plate 2,683 times with runners on base; 1,528 of those are with runners in scoring position. For the former, his OPS is 1.026 and the latter 1.079.

To give context to how much more/less Votto comes up with runners on base, I used the 2015-2017 average season numbers of total at-bats and divided that by 750. The 750 is 25 players per 30 teams. That’s a loose guesstimate but I would presume that through a given season a team holds at least that many (different) hitters on average, taking into consideration promotions/demotions/injuries/etc. That gave me 107 plate appearances per season with runners on base for the average hitter.

Then I used Votto’s career 2,683 PAs with runners on and divided it by his 11 seasons to get an average of 244 PAs per year. So, he has runners on about 44% more than the average hitter each season. Where he hits in the order DOES help but you have to remember he’s been playing on, for his career, a pretty mediocre Reds offense.

And, as a footnote, his worse performances are with runners on second and third followed by bases loaded; he excels with runners only on second, third, or first AND second.

That tangent we just went on only answered part of the question. We can’t know what the score was, the leverage index and other minor variables. All of those could change the way Votto is pitched to given the particulars. But, for whatever reason, the best hitter in baseball under a full count does not seem to be challenged much at all.

This post and others like it can be found over at The Junkball Daily.


Aiming for the Middle

There’s been much criticism of “tanking” teams in this slow offseason, or at the very least, criticism of teams who are not aiming to win now. Most notably the Marlins, Pirates, and now Rays have been held up as examples of teams who are not aiming to win. Fans, players and commentators have raked the teams and their ownership/management over the coals for embracing a strategy of failure.

Let’s leave aside for a moment what is a tank and what is a rebuildBut from an empirical standpoint, I find it simply inaccurate to assert that most teams are not trying to win in 2018 based on their offseason moves. Rather, I think there is a strategy emerging in the non-super-team group of aiming for slightly above average and hoping for a Wild Card berth. Indeed, given the increased supply of teams on the low end of the win curve selling current assets for future ones and the smaller marginal returns for teams at the top end, the middle-tier teams actually can scoop up value here.

I guess the thing I don’t understand, particularly regarding the trades, is that the team on the other side of the ledger matters. That is, the seller’s loss in the current season is still the buyer’s gain.

Currently, 7 teams project for 90 wins or more according to Steamer (Astros, Dodgers, Cubs, Indians, Red Sox, Nationals, Yankees). We can safely say these teams are aiming to be division champs. But the next tier of roughly 10-12 teams has been quite active this offseason in aiming for wild card slots and hoping things break right for themselves (and wrong for the division favorites).

Consider the Marlins’ sell-off. Yes, Stanton went to the Yankees, so “the rich get richer,” but the other three “sell-off” players — Christian Yelich, Marcell Ozuna, and Dee Gordon — all arguably went to teams who are in the “middle.” The Brewers project for 78 wins in Fangraphs currently, Cardinals for 88 and the Mariners 80.

And many teams that could decide to sell off are actually holding steady or gearing up for another shot at the title.

Plenty of Mets commentators decried the Mets’ offseason as giving up on the season before it started, but the Mets have added $88M in salary obligations and roughly 6 extra projected WAR next season. The “middle class” of free agents is a value proposition for the Mets, who picked up Todd Frazier on the cheap. The Mets project 11 games back of the Nationals, but they’re still aiming for the middle, deciding that the possibility of even the one-game playoff is worth it and remembering that even superteams do fall apart.

Similarly, the Blue Jays, a team that won 76 games last season should have, if the “everyone’s tanking” narrative were correct, sold off Josh Donaldson. Instead, the team has re-loaded for another run in a division with two 90-win superteams with some tweaks to engineer a team capable of sneaking into the wild card race, adding roughly 5 WAR through a combination of free agency and trades.

And these moves are in keeping with what we might expect from Jesse Wolfersberger’s calculation of the second wild card win curve:

If you’re unlikely to beat out the top teams, maybe better to hover opportunistically around the middle and stumble into a playoff spot. The second wild card may make the value of the first wild card lower, but it stretches out the tail of value for teams in the 85-90 win range.

Even teams arguably outside the window of contention right now are aiming for the middle. The Padres just signed Eric Hosmer to a huge deal. They wouldn’t do that if they didn’t think they were close to contention. The Pirates, who were roundly condemned for trading Gerrit Cole, actually got good players in exchange who are ready to play in the majors, like Joe Musgrove (injury notwithstanding) and Colin Moran. (Indeed Musgrove and Moran currently combine to project for more 2018 WAR than Cole at the moment!)

It’s not sexy to aim to be number 2. To quote notable philosopher Ricky Bobby, “If you ain’t first, you’re last.” American culture and sports culture in particular places dominance and winning above all other goals. But given the randomness of the sport and the recent history of failure among projected “super teams,” there is a reasonable strategic position to embrace aiming for the middle. And as the offseason price of free agents fall, it seems that many teams are doing just that.


I See You, Jake Arrieta

In the last week Ichiro, Tim Lincecum, Carlos Gonzalez, Jonathan Lucroy, Mike Moustakas, and Lance Lynn have all signed. On Sunday, Jake Arrieta joined them, agreeing to a three-year, $75-million contract with the Phillies. That’s an average of a signing a day! Of major leaguers, to major league contracts! The dominoes are certainly falling. Finally.

Arrieta’s signing comes with curiosities. Or maybe more accurately, concerns. He has more than 1,100 professional innings on his arm. From 2014-16 he had a nasty-good run. Toward the end of it, and through 2017, his velo started to dip. Pitch Info tells us he lost two mph off his sinker between 2016 and 2017. His Ks have slightly gone down and his walks have slightly risen. At 32, he’s at an age where it’s fair to begin wondering how much further he could fall, and how quickly.

How does he adapt? Arrieta might be past his peak prime while with the Phillies, but what will he be? What can he be, and what adjustments might it take to get there? The way hitters manufactured production off him last year could help us find a path to that answer.

Arrieta wOBA

Half of his actual weighted on-base averages were higher than what Statcast tells us we should have expected. Arrieta arguably has a skill of inducing weak contact, so what this would seem to suggest is that sometimes, when hitters put the ball in the air against him, he just gets beat. The overall numbers were lower during his run of dominance between 2014 and 2016, but the actual production similarly beat what could’ve been predicted based on the launch angle and exit velocity of balls in play against him.

Beyond that, though, we see a notable split in performance against lefties and righties last year. A single year of batter splits can be dubious, but consider this the New Arrieta; one whose age is revealing diminished skill. Lefties really went to town against his sinker and slider last year. The two pitches break in opposite directions, which makes them excellent sequencing buddies from the same tunnel, but things didn’t play that way for Arrieta last year.

One reason why could be because of the break on Arrieta’s slider. Per Brooks Baseball, he lost .7 inches of horizontal break and .53 inches of vertical break on it. What does that look like? I’m glad you asked.

arrieta visualizer3

Thanks to Statcast’s incredible, fantastic, super fun new 3d pitch visualizer, we can see how that loss of break on Arrieta’s slider could have impacted its performance against left-handed hitters.

The slider is in red circles. His sinker is in black squares. The ones closer to the mound mark the point at which batters could first recognize the pitch. The ones closer to the plate tell us when batters would have needed to commit to swinging. In 2017, lefthanders saw Arrieta’s slider sooner and were able to decide on swinging against it later than his sinker. Less movement, plus less velo, plus the same tunnel means hitters faced a pitch with very little bite. And that’s how an absurd .509 wOBA happens.

From 2014-16, lefties only generated a .240 wOBA against Arrieta’s slider. Last year’s numbers are probably an outlier, but if the pitch continues to flatten out it could really threaten the viability of one of his weapons. He could consider turning the pitch into more of a true cutter to deliberately make it run further inside on lefties, or he could use it less in favor of the curveball. There’s also a chance he could take a little off the slider to widen the velocity gap with his fastball, but deliberately throwing slower in this context doesn’t seem ideal. 

Arrieta’s going to be an intriguing piece to watch on an increasingly intriguing team. The Phillies are showing they’re getting ready to contend, and his evolution as a pitcher could be key to making it happen.

Pitch mix and wOBA data from Statcast.


What to Expect From J.D. Martinez’s Power in Fenway

Several days ago the Boston Red Sox acquired J.D. Martinez, presumably under the expectation of adding a lot of power to the lineup. Since 2015, he’s eighth in home runs with 105, a league-best .284 ISO (four-thousandths of a point ahead of Nolan Arenado), and his 147 wRC+ puts him at sixth in all of Major League Baseball.

Yes, he can hit for average as well but I’m not interested in that. What I’m curious about is whether or not the famed Green Monster in Fenway Park will be a hindrance to Martinez’s power.

He’ll now be playing 82 games each season in Fenway Park, where every time he comes to bat he’ll have the Green Monster in peripheral view; a 37.2-foot high wall 310 feet down the left field line and as far away as 380 feet at left center. There are dozens of hits every year at Fenway that could have ended up as home runs in other parks, but instead, are eaten up by the Green Monster and spit back out as (extra) base hits.

To attempt to approximate the minimum required launch angle and exit velocity to hit a home run over the Monster, I needed visual proof. Using Baseball Savant, I searched all the home runs hit in Fenway Park during the Statcast era.

I keyed in on home runs specifically hit to left/left center field, spanning the entire range of that monstrosity. Using the spray chart tool, I found any and all homers that were as close to the barrier of the GM (Green Monster) as possible. I came across one that seemed to fit perfectly and cleared the wall just enough.

That’s Steven Souza, Jr. driving a home run under (nearly) perfect metrics to breach the wall.

Just to be certain that this was as close as I could get, I wanted to know what the weather conditions were that day. I was able to find the barometric pressure and how mother nature’s influence could have affected this hit, in terms of exit velocity. Air pressure matters because when its low, baseballs go further due to less friction on the baseball and vice versa.

  • Game time: 1:35 PM
  • Game Duration: 4 hours and 32 minutes
  • Approximate time HR was hit 5:00PM
  • Conditions at time of HR: 50 degrees, light rain, wind blowing NW at roughly 16 MPH with gusts up to 27 MPH
  • Game barometric pressure: A consistent 29 inches

OK, so what jumps out at you? Wind speed, right? All Fenway Park’s contact to left (center) head in a northerly direction. The low barometric pressure and wind speeds give me two possible caveats for this examination.

However, as you see in the GIF, the trajectory was fairly high and it cleared the wall by a couple of feet. It’s impossible to tell if the wind was blowing (and how hard) during Souza’s homer, so keep those things in mind since they are variables that don’t make this investigation exact when applying it to Martinez.

Souza’s hit metrics on that homer were as follows:

  • Breaking ball at 80 MPH
  • 93 MPH exit velocity
  • 33.5-degree launch angle
  • Hit distance of 344 feet

We can use those measurements to get a guesstimate of what Martinez could or would have done hitting regularly in Boston. I produced the following spray chart using his last three seasons under the backdrop of Fenway Park.


J.D. Martinez(2)

Clearly he’s able to hit to all fields; you could suggest that a fair amount of his hard contact is concentrated in the area of the GM and that’s what I’m going to hone in on. Yet with the height of the wall, some of those home runs (hit in other ballparks) could have been inhibited.

I inspected all Martinez’s home runs since 2015, shifted focus to the launch angle and exit velocity using the Souza home run as my model, and ran a query of all his contact using the metrics it would take to clear the wall.

I set the minimum launch angle to 30 degrees, to give a little breathing room because it appears as though Souza’s homer cleared the wall by a foot or two; I did the same for exit velocity, starting it at 90 MPH. For minimum hit projection range, I used the shortest distance to the GM; 310 feet.

Breaking it down even further, I ensured that homers hit to left center had ample room and momentum to clear the wall; e.g. the 310-foot distance wouldn’t work for a ball he actually hit to left center, for example.

Altogether, Martinez had a total of 121 batted ball events under the conditions of my launch angle/exit velocity/distance figures. 24 of those 121 BBEs resulted in contact to left field; 11 would have ended up being GM-clearing home runs if hit in Fenway, but instead were recorded as outs.

So, taking events strictly within the region of left to left-center field in Fenway, Martinez could be expected to hit about 43% more home runs facing the GM over the next three years of his contract.

Remember, that doesn’t include contact to other parts of the field. If you look back to the spray chart, you’ll see several spots marked home runs that would fall short in Fenway.

Furthermore, using his home run total from 2015-2017, we could reasonably surmise that he’ll hit an average of about 35 home runs for the next couple of years. Adding in these 11 outs as home runs, Martinez will be expected to hit roughly 9% more home runs (3 per season) at Fenway, so long as he is a Red Sox.

So, the monster won’t be as problematic as I originally assumed upon hearing of this acquisition for Boston; it might actually improve Martinez’s power.

-This post and others like it can be found over at The Junkball Daily.


Power Relievers and a Third Pitch?

As spring hopes eternal so, too, do the annual Spring Training stories. Guys are in the best shape of their lives or feeling better than they have in years. Or futzing with new pitches. In fact, so many guys try new pitches that Jason Colette keeps an annual, running list of pitchers who are attempting to add to their arsenal. 

Edwin Diaz is among those attempting to do that this year by adding a changeup to his very fast fastball and exceptionally mean slider. Mariners General Manager Jerry DiPoto says that so far the changeup is “pretty firm.” He also adds that “it could be something in [Diaz’s] back pocket that he can introduce against an occasional lefty.” But does he even need it?

relievers

A glance at the top 10 relievers over the last three years tells us a few things. None of them threw any two pitches at a volume that would allow them to throw a third at a clip of 10% or more. Jansen’s and Britton’s numbers don’t even facilitate doing it for a second pitch! That 10% seems to be the tipping point at which an offering is actually useful to a pitcher. That’s when a hitter has to be accountable to it, or at least be aware of it in the back of his head. Less than that and they can take their chances focusing on what they know is coming more than 90% of the time.

The lone near-exception in this group is Roberto Osuna. After his fastball and slider, he’s thrown a cutter 9.4% of the time. He’s thrown a changeup slightly less than that (8.4) and a sinker slightly less than his change (7.4). While his repertoire might be an outlier compared to his peers, he still falls short of the 10%-per-offering threshold.

It’s important to acknowledge that each reliever’s primary and secondary pitch types aren’t listed above. They all throw different stuff. But what they use, they use similarly. In this sense, it’s kind of like taking different routes to the same destination, but each one takes the nearly same amount of time. Looking at each reliever’s individual splits shows us that almost all of them also faced a relatively even amount of right-handed and left-handed hitters. Only Miller, Chapman, and Britton had splits that tilted more distinctly one way, and that was against righties. None faced notably more lefties.

And that brings us back to Diaz. He, too, has faced more righties than lefties so far in his time in the bigs, about 14% more. Adding a pitch specifically to focus on hitters he’s seen less of, in anticipation that he might see them more, seems premature at best. Remember, the M’s moved Diaz to the bullpen because he couldn’t develop a third pitch to stick in the rotation. That’s how we get a lot of our power relief arms. As a starter, that third pitch is way more critical because of the volume of hitters per appearance. For relievers — especially the dominant ones, which Diaz is capable of being — the lack of volume is by design.

Odds are that Diaz stops fiddling with a changeup and just keeps throwing his fastball and slider as the season gets going. But nonetheless, the situation feels like trying to push a buoy underwater. It’ll just keep bobbing back up. And why the Mariners would advocate for it in this context, whether passively or actively, is very, very confusing to me.

In my day job, I’m an educator. For every lesson planned, there’s a constant inner monologue, a series of cascading questions. What’s the best way to approach the day’s goal? Does this lesson serve the unit? If not, does the lesson have enough value to still include or would it just be empty fun? What questions can I anticipate, and what answers could I have ready?

If I were the Mariners, I wouldn’t plan for Diaz to throw a changeup. If he asked to do it, I’d conference with him about why he thinks it would be effective. I’d speak to him, with evidence, about why it might be cool, but emphasize that it’s definitely not necessary to succeed. I’d map out why it makes sense for him to just throw that dang slider.

But alas, I’m not the M’s.

Data from Fangraphs.


The HOF Case for Andruw Jones

With this article, I know that I’m walking into the fire, but I’m prepared.  I will craft my Cooperstown argument for Andruw Jones, the greatest defensive outfielder the game has ever seen.  Receiving 7.3% of the 2018 Hall of Fame votes is insulting to his career, and I hope that, upon reading this article, you’ll see why.

Tale of Two Andruws

30 and under Andruw Jones was on the fast-track to Cooperstown as the greatest defensive centerfielder of his time.  When he wasn’t patrolling the outfield for the Atlanta Braves, he was swatting home runs at a superhuman rate.

By age 31, that Andruw had disappeared, and he would play parts of 5 disappointing seasons with the Dodgers, Rangers, White Sox, and Yankees before retiring from Major League Baseball.  He gained some serious weight, and the athlete of his younger days was gone forever.

Putting Andruw Jones in Context

In my recent Mike Trout article, I brought up a plethora of stars with short careers to make the case for Mike Trout.  However, Andruw Jones is a very different type of player than Mike Trout, and Andruw deserves a different argument.

Too many baseball critics view Andruw Jones as a power hitter that failed to hit the 500 home run mark.  For reference, Andruw Jones hit 434 career home runs, still good for 47th all-time tied with Juan Gonzalez, but well short of the 500 mark.

Andruw Jones’ case will be created by framing his defensive ability and his home run ability in the context of history.  While he didn’t play a full season after age 30, what he did contribute to the game was Hall of Fame worthy, as he was only 19 when he joined the Majors.

The Greatest Defensive Outfielder, Ever

Seriously, Andruw Jones was not just the strongest defensive centerfielder of his time, or centerfielder of all-time.  He is undoubtedly the greatest defensive outfielder, ever.  And his defensive wins above replacement (dWAR) statistics prove it.

If we are looking at defensive skill and Andruw’s ability to perform run-saving, highlight reel plays on the daily, he is the best to ever do it in the outfield.

Baseball Reference has a nicely compiled list of the leaders in career dWAR.  Ozzie Smith sits atop as the greatest defensive player in the history of baseball, with 43.4 career dWAR.  Others high on the list are Brooks Robinson in 3rd (38.8 dWAR), Cal Ripken in 4th (34.6 dWAR), and catcher Ivan Rodriguez in 8th (28.7 dWAR).

These players, along with the top 19 in general, have one thing in common.  They all played infield.  It’s no secret that infielders are likely to have more defensive opportunities, thus having the ability to post higher dWAR each year.  Though playing infield requires quick reaction time and instinctual play, there is not much running involved.  Infielders can often play at an elite level for longer, since covering massive amounts of ground isn’t required.  If you don’t believe me, watch the below video and ponder how many 30+ year olds could chase that ball down.

That video displays the defensive patrolling that is reserved for the outfield.  Elite fielding outfielders above the age of 30 rarely exist because the sheer amount of running required just isn’t feasible on legs over 30 years old.

Now, I’ve held you in suspense long enough, and you’re still wondering where Andruw Jones ranks, and who number 20 is on the list of career dWAR.  That man, with 24.1 career dWAR, is Andruw Jones.  Okay.  Yay!  Cool.  So Andruw Jones has the highest dWAR of any outfielder, ever.  Where do the other great outfielders rank?

Before we can answer a question like that, let’s first keep scrolling down the list until we reach another outfielder.  Hmmm……

Of the top 50 career defensive WAR players, only Andruw Jones played in the outfield.  That’s strange.  It must be a mistake.  There’s no way he was this good and only received 7% of the vote.  Ozzie Smith was inducted first ballot as the best defensive infielder of all-time.  Brooks Robinson was inducted first ballot as the best defensive third baseman of all-time.

We have to move down to position number 60 to find the next highest outfielder on this list: Paul Blair, Orioles’ centerfielder in the 60s and 70s, recorded 18.6 career dWAR.

But Josh, Andruw Retired Early!

This is the unfortunate argument where we assume that because Andruw Jones didn’t play much as he got older, his career dWAR stayed in-tact, never declining with age.  While true that his dWAR dropped from a peak of 26.2 to 24.1 due to 5 sub-par half-seasons as he aged, Andruw Jones was still far better than other greats with longer careers.

Willie Mays played about a decade more full seasons than Jones, so you’d expect his 18.1 career dWAR to be more a factor of negative dWAR seasons as he grew older.  You’re correct in that Mays’ peak career dWAR was above 18.1, but sadly, Willie reached a peak career dWAR of only 19.3, according to Baseball Reference.  Even with almost a decade of additional playing exposure, Willie Mays was never even close to Andruw Jones’ 26.2 peak dWAR.  Even though Willie Mays was an above average outfielder into his mid 30s, his career of defensive excellence is still dwarfed by Andruw Jones’ decade of greatness.

Ken Griffey Jr. is another popular name to throw around as a defensive stalwart in center, but he maxed out at 11.1 dWAR at age 30, before injuries and age reduced his career dWAR to a paltry 1.3.  Jim Piersall reached a max of 16.0 career dWAR during the 50s and 60s.  Andre Dawson reached the 9.0 career dWAR mark before declining with age.  Jim Edmonds never crossed double digits either.  Defensive whiz Lorenzo Cain is currently at 12.1 career dWAR, though he is showing signs of defensive decline.

Andruw Jones’ career dWAR, along with his peak career dWAR is better than any other outfielder.  He is the greatest defensive outfielder in history.  No further questions.

But Could He Hit?

Andruw Jones had a career .254 batting average, but once you get past that, a feared hitter takes shape.  Jones launched 434 career home runs in a very short career.  He also walked 10.3% of the time, which is no number to snuff at.  He had a career slugging percentage of .486, good enough for 170th all-time.  His career OPS+ sits at 111.

Before I dive into his career home run mark, let’s treat ourselves to game 1 of the 1996 World Series, where at 19 years old, Andruw Jones homered in his first two at-bats.  By all my fact-checking, he is the youngest player to hit a home run in the postseason, let alone a World Series, and he did it in back-to-back at-bats.

If we look at the players on the all-time home run list that are higher than Andruw Jones, we note only a handful of players that accomplished this feat in fewer at-bats.  These players are included below, with two objects to note.  In parentheses is the player’s career dWAR, along with an asterisk if this player took any sort of steroids or HGH at any point in their career.  While Juan Gonzales had the same amount of career HRs as Jones, I included him because he did it in fewer at-bats.

The short list:

  • Mark McGwire* (-12.8 dWAR)
  • Carlos Delgado* (-17.9 dWAR)
  • Jason Giambi* (-20.5 dWAR)
  • Dave Kingman (-17.1 dWAR)
  • Adam Dunn* (-29.6 dWAR)
  • Jose Canseco* (-14.5 dWAR)
  • Juan Gonzalez* (-12.3 dWAR)

Note that all these players had career dWAR well below -10, and all but Dave Kingman were linked to steroid abuse.  While none of these players is enshrined in Cooperstown, these players were all one-way guys.  Clearly, none of them contributed from the field throughout their careers.

Andruw Jones had a career AB/HR of 17.51, placing him just ahead of Reggie Jackson on that list.  Jones had an innate ability to hit the ball out of the park, and his career HR/dWAR combination resembles that of only Adrian Beltre (462 HR, 27.8 dWAR), who is a likely first-ballot Hall of Famer himself.  Of course, it did take Beltre significantly more seasons to crush 400 home runs, along with much more time in the infield to reach 20 dWAR.

Defensive Specialists in Cooperstown

Cooperstown loves defensive specialists, and I too, believe they are often deserving.  There is no doubt that players like Ozzie Smith and Brooks Robinson should be in the Hall of Fame.  These guys were first ballot since there was no debate about their credentials.  However, if we look at Smith and Robinson, and notice their career OPS+, we get 87 and 104 respectively.   Both rank below Jones’ mark of 111.

In fact, if we look at the 19 players with more career dWAR than Andruw Jones, only three players have higher career OPS+: Adrian Beltre (117), Gary Carter (115), and Cal Ripken (112).  Carter and Ripken are already in the Hall, and Beltre, as previously mentioned, is a lock for the Hall whenever he finishes his incredible career.  Jones deserves to join them as well, and his abysmal 7.3% of the vote in 2018 worries me greatly.

The Whole Package

I used JAWS a lot in my Mike Trout article as an advanced way to look at Hall of Fame worthiness and included a snapshot of Andruw Jones’ JAWS stat (from Baseball Reference) compared to other CFs in the Hall.


Screen Shot 2018-02-11 at 2.09.18 PM

His JAWS is barely below the average Hall of Fame CF, and his 7 year peak WAR is actually above this average.  If we look at 7 year peak WAR for all centerfielders, we find only 8 guys with a figure above Jones’ 46.4, and 7 of those 8 are already in Cooperstown.  And the 8th is… you guessed it, Mike Trout.

Below is a snapshot of Omar Visquel’s JAWS worthiness.  Visquel was a defensive specialist who snagged 37% of the vote in 2018.  Someone please tell me why his case for Cooperstown is better than Jones’.

Screen Shot 2018-02-11 at 2.35.29 PM

Then we have the beloved Vladimir Guerrero, who entered the Hall this year, even though his 7-year peak WAR was below the average for RFs, and his JAWS score was about 8 points lower than the average Hall of Fame right fielder.

OK, rant over.  Andruw Jones should be in the Hall.  I’ll leave you with a final Andruw Jones moment, this one a broken bat home run to deep center field.  Anyone see this happen recently?  That’s what I thought.  The next time I’m in Cooperstown, I hope to see a plaque of Andruw Jones there.


The Fly Balls Have Arrived In College Baseball, Too

It was difficult to exist as a baseball fan in 2017 without hearing the phrase “fly-ball revolution” and its family members “exit velocity” and “launch angle.” The idea that ground balls are not great and fly balls are pretty decent isn’t something that only major league batters have figured out and adjusted their approach accordingly. College hitters have taken notice, and purchased trips to Ding Dong City as well.

Even though Major League Baseball has vehemently shot down the idea of the baseball being juiced, the NCAA has been rather transparent when it comes to ways to improving offense in the game. Instead of reverting back from BBCOR bats to the rocket launchers used beforehand, a flatter-seamed baseball was introduced in 2015 after scoring had fallen to 5.08 runs per game and a record low of 0.39 home runs per game. Since then, scoring has jumped to 5.77 runs per game (still a far cry from the 6.98 runs per game the year before BBCOR bats were initiated ) and 0.75 home runs per game.


Year-by-Year Home Run Changes Since 2014
Year Home Runs % Change
2014 6825
2015 9074 33.0%
2016 10,050 10.8%
2017 12,297 22.4%

Home run totals have gone up 80.1% since 2014. Again, these totals are nowhere near the insane days when home runs per game was near 1, but

The increase in home runs isn’t just a product of changing the ball. It’s a systematic shift in how players across all levels of the game are approaching hitting. MLB teams have used Trackman data to change hitter’s swings to an optimal level, and now colleges and high school showcases have started to install Trackman systems in their stadiums. Trackman data at colleges certainly isn’t publically available, and all of my emails to coaches asking them to hand it over were not returned.

Without the sophisticated data, I was only able to track the number of ground balls, line drives, pop up, and fly balls that were hit when an out was made from play-by-play data.

View post on imgur.com

Line drives have been stable, but ground ball outs and fly ball outs have been slowly diverging over time. Even without the data to pinpoint launch angle changes amongst college players, it’s still no secret as to what the players are attempting to do; hit the ball in the air.

As any pulse-having FanGraphs reader will know, the surge in home runs has risen in line with the other two of the Three True Outcomes™, strikeouts, and walks. This has been no different at the collegiate level as well. K% has increased from 16.0% in 2014 to 18.3% in 2017, and BB% has increased from 9.0% to 9.9% in the same time. These numbers are understandably off from where the MLB was in 2017 (21.6% and 8.5%, respectively) given that the command of college pitchers isn’t as developed as it is among professional players, and anecdotally speaking, there is more effort to pitch around team’s star players in college than there is in the pros. The NCAA will never be able to perfectly recreate the conditions that exist in professional baseball in college, the days of college coaches instituting modern day dead-ball era philosophies are quickly coming to an end.

These changes to the ball and the way teams approach the game is part of what needed to be done to make baseball at the collegiate level more exciting for fans. It’s no secret that college baseball ranks well below the excitement of its basketball and football counterparts. It’s still to be determined whether a Three True Outcomes™ approach to the game is what’s best for baseball, but with Major League baseball looking to strengthen its relationship with the college game and record number of games appearing on television this year, interest in the game is only going the way of the baseballs, up.

A special thanks to Christopher D. Long and his godsend of a GitHub for supplying the data to make this research possible. 


Edwin Diaz, Throw That Slider

Pitchers are fickle beings. Relief pitchers are really fickle beings. Edwin Diaz, for example, burst onto the scene in 2016. Jeff Sullivan detailed how he generated comical whiffs with both a 98 mile-an-hour fastball and a fwippy, drops-off-the-table slider. He also worked in the zone while doing it, which is pretty much the best combo you could ask for from a pitcher.

But in 2017, Diaz essentially laid an egg. His Ks were down. His walks were up. He couldn’t stay in the zone nearly as much, so batters swung less. When they did bite, they hit him much harder than in 2016. His manager talked about how his mechanics had become wonky. He went from being the game’s 13th best reliever to being its 54th.

What’s curious about those wonky mechanics is that they appear to have only burdened his fastball. Not his slider.


diaz heatmaps.iii

Diaz throws his fastball nearly 70% of the time. More than just impacting what was in the zone and what was out of it in 2017, though, his wild tendencies with the heat also appeared to influence his pitches on the edges of the zone. Hitters were more willing to take their chances holding off on a pitch on the paint, as evidenced by a nearly two percent drop in whiffs on those offerings from 2016. With the slider, it seemed to induce more swings.

If Diaz is going to throw the fastball so much, then the obvious tweak he needs appears to be with that offering. But what if the Mariners looked at what Diaz has done best in his time in the Majors, and tried to amplify it?

diaz woba

Overall, Diaz’s fastball hasn’t been terrible. But it hasn’t been good, either. By wOBA, it ranks 137th out of 354 pitchers in the last two years. It was beaten up by righties in 2016 and then lefties in 2017. Even if the year-to-year stickiness of those numbers isn’t necessarily reliable, the real hammer has always been the slider. It’s yielded a meager .187 wOBA. By expected wOBA, Statcast actually says it’s even been 22% better than that. Diaz simply upping its usage would likely bring more whiffs for him. The pitch generates a greater percentage of swings and misses (33.8) than the fastball gets misses and called strikes together (30.4).

There’s also this: Diaz throws the slider 15% less to lefties than to righties, who have also hit his fastball harder and more consistently. He has room to use it more against opposite-handed hitters, and doing so seems like a natural progression.

Image result for edwin diaz slider gif

Beyond that, there might be two things Diaz could tinker with in regards to his breaking ball that could enhance his overall game. He primarily pounds the low, glove side corner of the zone with it. Commanding the pitch to additional parts of the zone — say, in the vein of Kenley Jansen’s cutter — would force hitters to attempt to be more accountable to it, while still being subjected to its devastating drop. This could pair really well with a more erratic fastball, too. If a batter has to be aware of the slider breaking in different portions of the plate, they could be coaxed to swinging at a wilder heater coming at them 10 mph faster.

While it would require more sophistication and time, Diaz could also adjust his arm slot for his slider depending on the handedness of a batter to give it a different look. This may come with more caveats than benefits at first. Max Scherzer has said this kind of approach takes years to master. Zack Greinke has suggested it provides one globby, less useful look more than two distinct ones. And of course, Diaz has already been cited as having control issues at times. But the fact of the matter is he’s young and immensely talented and finding ways to make his slider more of a weapon should be a priority. It could be what makes his potential dominance undeniable.

Data from Statcast; gif from PitcherList. 


Is the Second Wild Card the Problem?

I have wondered about this. Unlike my other articles this is going to be less analytical so don’t be mad at me and maybe discuss in the comments. There is a lot of talk about why middle ground teams are not investing to get better.

Now, of course, competitive baseball is better but we also can’t expect teams to fight a futile fight. We do now have better projections, aging curves and other stuff and we can’t teams to just act like this didn’t exist. Winning should be the goal but throwing away the future doesn’t make sense either.

In theory, the second Wild Card is another playoff spot but in reality, it is really only half a playoff spot. There is value in the Wild Card but teams are not really attacking it preseason, they will wait and see and then maybe make a small deadline move. It really isn’t worth to throw away the future for a 30% or so https://www.fangraphs.com/community/the-pirates-and-the-value-of-being-around-500/ chance of reaching a coinflip game if you are a .500 team.

The second Wild Card has mostly hurt the first Wild Card team and it has increased the incentive to be a super team especially in a weak division. IMO,  being a super team is too big of an advantage because there is also less risk to being in being kicked out by a weakened Wild Card team that has used its ace in a one-game playoff.  And at the same time there is too little reward for being the fourth best team.

That means teams either try to tank to become a super team or they try to stay a boring .500 team doing not much hoping to occasionally luck into a Wild Card like the pirates might want to do now.

We can’t just force teams to spend money foolishly, if we want teams to spend more and try to be competitive we need to actually increase the incentive to win as a non super teams and maybe also punish the super teams with a little more variance.

Now of course not anyone wants that. Some like the best team to win and baseball already has some of the more luck influenced playoffs but if you want teams to compete you need to change the rules.

One possibility would be doing away with the second Wild Card so that being the Wild Card really guarantees a playoff spot. Another thing you could do is doing away with the divisions and make it top 4 per league directly to the playoffs or maybe even use NBA-style 16 team playoffs (although that would be too much variance for me).

IMO we shouldn’t talk so much about punishing bad teams but about making good not great more lucrative. Currently, 2/3rd of each league just have little inventive to be buyers because the super teams have too much of an edge and the second Wild Card might have increased that division.

The second Wild Card was a good idea but teams have really voted with their feet and decided the second Wild Card is not a full playoff spot and thus not worth chasing with a lot of resources.


Twitter Can Help us Solve for Cristian Pache’s Upside

The grades on Cristian Pache’s Fangraphs page, reported on during 2017 are impressive: 70-grade speed, 70-grade arm, 60-grade future glove.

With 50 considered the average for a given tool, Pache is one of the few with discernible, impact tools that isn’t on two of the industry’s biggest top 100 prospect lists – Baseball America and MLB.com.

The reason for the omission is reasonable. As JJ Cooper (@JJCoop36) mentions in the comment section of Baseball America’s list, the projection, or assumption of future production in lieu of tangible results, regarding Pache’s bat prevent buzz from swelling. With zero home runs across 750 plate appearances in the minors, despite the majority of those chances coming in one of the worst parks for power in the minor leagues, State Mutual Stadium, it’s hard to disagree with Cooper’s point.

Projecting Pache (great sitcom title), is a task any player evaluator must deal with to really understand his bat’s viability to reach the major leagues; his defense and speed are already apparent. While I’m not a professional scout or player evaluator, tinkering with some video will hopefully present the case for Pache’s bat as it stands and whether you believe in the emergence of another plus tool.

July 2015

(Video from YouTube, Fangraphs)

Starting with Pache’s roots, this combination of videos in the gif above is from the year he was signed, 2015. What stood out to me was how Pache dealt with his lower body and front foot from swing to swing; the two swings in the gif above provide the most noticeable difference. Inconsistent isn’t poor terminology, per say, but I’d rather consider it raw. As these swings both look like they’re coming from live pitching, I immediately thought of a column written for the Collegiate Baseball Scouting Network. Nick Holmes, the author of this particular post, has deep roots in player development in Latin and South America and mentions how a lot of talents, like Pache, don’t receive ample exposure to in-game situations like amateurs in the United States do. This can cause muddying of skill perception from batting practice and drills to the actual games themselves.

While this variation in stride – toe tap on the left; modest leg kick on the right – was initially a knock in my eyes, my perspective evolved to consider it a feature that repetition could iron out. Pache’s ability to simply make contact gives me pause when critiquing an aspect of his game that might not be a detriment at all.

Keep in mind this video is from 2015.

Pache earned around 250 plate appearances in affiliated ball during 2016, and as we’re about to dive into, some of that smoothing I briefly entertained may have emerged.

Summer 2017, Ronald Acuna

(Acuna video via YouTube, RKyosh007; Pache video via YouTube, The Minor League Prospect Video Page)

A baseline in swing evaluation often makes capturing the intended point clearer. While I shy away from one-to-one player comparisons, aesthetic comps can be valuable for descriptive purposes. These two points are key disclosures to justify my pairing up of the game’s top prospect, Ronald Acuna, with my topic of interest, Cristian Pache. I acknowledge up front this is an aesthetic comparison to help us understand Pache’s swing.

Acuna came to my mind when looking at Pache’s tape. (Whether that comparison arose because of bias from watching far too much Acuna tape, I cannot confirm or deny). Their pre-pitch setup and core motion towards the ball are eerily similar, despite a slew of differences from the variation in pre-load hand placement to Pache’s slightly open stance. On top of that, Acuna initiates his swing much earlier than Pache, building a substantial amount of momentum that results in a bigger stride and force moving towards the ball. I also love how throughout Acuna’s building of momentum his hands are on the verge of proceeding into his swing. The trigger Acuna has once he chooses to explode his hips is mesmerizing. This difference is noticeable when watching Pache’s hands drift back and up into their hitting position as he goes into his load. I don’t expect Pache to evolve into an exact replica of Acuna, but the difference allows for visualization of where Pache can adjust to focus on the biggest issue facing Pache’s bat: the plane on which he makes contact.

Launch angle, once a mysterious and complex point, has become basic-knowledge for most fans. As we see players tinker for the better with their bat path at the major league level, it’s only natural for similar trends to occur in the minor leagues. In this case, something I’d be very interested to see Pache entertain.

Working backward, watch where Acuna’s hands finish in his swing. The tip of Acuna’s bat finishes much higher in relation to his upper body than Pache’s, which stays somewhat level with his shoulders. Now start to focus on earlier and earlier parts of Acuna’s swing that lead to where his bat finishes. Applying the same exercise to Pache shows you why scouts are able to confidently project out Acuna’s power and why some may be hesitant to give Pache 15-home run power.

Acuna and Pache are almost polar opposites when it comes to their bat path through the zone. Yet even with this differences, we’re not looking at polar opposites in terms of the how and where each player is hitting the ball. Acuna has a much better ability to go the other way – something I’d love to see Pache do more of – but the most important thing is that Pache’s ability to get the ball off the ground might be improving. His ground-ball rate, once around 65 percent in 2016, is now closer to 50 percent. Comparing the gif of Pache from 2015 to his swing next to Acuna shows a subtle difference in the path of his bat, which could be a reason for this tendency to get balls off the ground.

Pache is trending in the right direction, towards Acuna. I don’t think he’ll ever possess the all-fields power Acuna holds, but he doesn’t need it to raise his offensive ability to average, allowing his other skills to flourish at the major league level.

…Twitter?

(Via Cristian Pache’s Twitter, @CristianPache25)

This brings us to Pache’s Twitter, where we can get the most recent look possible at the glove-first prospect’s swing. While these aren’t game-speed swings, I want to point out that Pache seems to be raising his leg slightly more, hovering on his back foot like he never did in 2015, or even in his swing next to Acuna. It’s not necessarily an improvement in Pache loading on his back hip like you’ll see with hitters like Josh Donaldson, but it’s an improvement over Pache’s early tendency in 2015 to generate power from aggressively shifting all his weight into his front foot to generate any resemblance of power.

This could induce even more building of momentum towards the ball, or it could be more of his batting practice-style swing that doesn’t translate into his game tendencies. The result, in a perfect world, could be the most valuable thing of all: more line drives. Or it could be nothing at all. Only Pache’s game-speed hacks in 2018 will provide an answer.

I can be found gif’ing up hitter adjustments on Twitter – @LanceBrozdow.

A version of this post can also be found on BigThreeSports.com.