Archive for Research

Contract Modeling for the 2014 Free Agent Class

After Matt Garza reportedly signed with the Brewers for $52 Million over 4 years today, the initial response was that it was a steal. Baseball writer Joe Sheehan tweeted that the signing was “Grand Theft Pitcher“. Sure, a day after the Yankees spent $175 Million on a big question mark, the price for Garza looks like a bargain. Upon closer analysis, however, the deal appears to be pretty close to what we should expect given what we know about the cost of a win, inflation, and aging curves. This can be seen by using the same model that Dave Cameron writes about so frequently.

Year Salary (M) Cost of Win (M) Wins / Salary Steamer WAR
2014 $13 $6.00 2.17 2.8
2015 $13 $6.30 2.06 2.3
2016 $13 $6.62 1.97 1.8
2017 $13 $6.95 1.87 1.3
Total $52   8.07 8.20

This model assumes that in 2014, a win costs $6 million dollars, and that the cost of a win will increase by 5% each year. Steamer projects Garza for 2.8 WAR in 2014, and I subtracted 0.5 WAR each year to account for age-related decline. As with the Kershaw contract, the model pretty much nails the cost for four years of Garza. The deal appears to be slightly team-friendly, with the Brewers getting 0.13 wins of value over the course of the contract. Put in money terms, they saved about $800K for Garza’s expected production. His health concerns (he has totaled 259 innings in the past two seasons) mean extra risk for the team, making it tough for me to get really excited about the contract. According to the model, the Brewers pretty much paid market value for Matt Garza.

But despite the numbers in front of me (and you), the contract does feel like a bargain. Why is this the case? This brought me to the greater point of this article, which was to try to find out the real market value for the 2014 free agent class. To do this, I applied the same model explained above to the 14 major contracts that have been signed this offseason by MLB free agents. These contracts are all include at least 3 years and $20M guaranteed, and total nearly $1 Billion. This leaves out relievers (which never quite fit into the model), injury-prone bounce-back candidates like Josh Johnson, and of course Masahiro Tanaka (since he’s extremely difficult to project). Ten of the fourteen players are between the ages of 29 and 31. For 2014 WAR, I used an average of Steamer and ZiPS (where available), and in the few instances where there was a team option or buy-out, I included the cost of the buy-out in the final year of the contract, as players in their mid-30s are rarely worth the cost of the option year. Lastly, rather than projecting the money a player should have earned, I simply calculated the WAR that a player is being paid to be worth (Wins / Salary) and compared it to their projected WAR for the duration of the contract. Without further ado, the table:

Player Salary (M) Wins / Salary Projected WAR Net Wins
Robinson Cano $240 32.43 31.00 -1.43
Jacoby Ellsbury $153 22.03 17.15 -4.88
Shin-Soo Choo $130 18.55 9.80 -8.75
Brian McCann $85 12.88 12.25 -0.63
Curtis Granderson $60 9.28 5.80 -3.48
Jhonny Peralta $53 8.29 8.00 -0.29
Matt Garza $52 8.07 8.20 0.13
Ricky Nolasco $49 7.59 5.60 -1.99
Carlos Beltran $45 6.58 4.05 -3.25
Omar Infante $32 4.92 4.60 -0.32
Scott Feldman $30 4.80 4.80 0.00
Carlos Ruiz $26 4.13 6.90 2.77
James Loney $21 3.32 1.80 -1.52
Jarrod Saltalamacchia $21 3.32 3.75 0.43
Total $997 146.20 123.70 -23.22

While your first instinct may be to declare most of these contracts huge overpays, the fact of the matter is that if everything appears to be an overpay, we need to adjust our baseline. According to the model, teams have paid for 146 wins, but are only projected to get back 124. What could account for the difference between the model and reality? On one hand, we have to consider the fact that every team values a win slightly differently. The Yankees have a huge incentive to put together a competitive team or they risk alienating an impatient fanbase. A win is worth more to a team on the brink of contention than a team sitting at the bottom of its division. This could be driving much of the variation, but is impossible to fully account for.

This leaves us with four factors that could cause the discrepancy between the model and the market that we can adjust for. First is the initial evaluations of the players. For instance, Shin-Soo Choo is coming off of a 5.2 WAR season, but is projected for just 2.9 WAR by Steamer. If we pencil Choo in as a 3.5 WAR player in 2014 (Oliver has him at 5.4), then he is set to produce 14 WAR during his 7-year contract, and be worth “only” -4.55 wins relative to his contract. The second is player aging. Taking off half a win each year is a quick and relatively accurate way to calculate future WAR for players who are already around 30 years old. However, some research has suggested that elite players may peak later and/or decline slower, which could affect many of these high-priced free agents (at least for the first few years of the contract).

The third and fourth variables are the cost of a win in the present and in the future. We’re using $6 Million per win, but other research has suggested that a win may cost more like $7 Million. In addition, the model increases the cost of a win by 5% each year, and some teams might suspect that rate to be higher with all the additional money flowing into the league.

After fixing the biggest outlier of the table (by projecting Choo for 3.5 WAR in 2014), these are the adjustments that would have to be made to a single variable (with all others held constant) to give us a model that properly values this free agent class so far:

Player Evaluation: The team signing the contract expects the player to perform roughly 0.23 WAR better than the Steamer/ZiPS projects in 2014.

Player Aging: The team signing the contract expects the player to decline at roughly 0.37 WAR per season.

Present Cost of a Win: One win (+1 WAR from a player) is currently worth $6.9 Million on the open market.

Future Cost of a Win: The cost of a win is expected to increase by 11.5% each year for the life of the contracts.

As is usually the case, the truth probably lies somewhere in between, with a little bit of each. In some cases, the driving force may be different for each team and each contract. The Mets may have signed Granderson believing that he can be worth 2.6 WAR in 2014 (as opposed to 2.2 from the projection systems), while the Mariners may have agreed with Steamer and ZiPS that Robinson Cano will be worth 5.35 WAR in 2014, but might project him for a slightly slower decline.

Just for fun, I’ll take a shot at modifying the model with a few minor adjustments so that the expected wins purchased matches the expected production. For my updated model, I’ll use the following parameters: Steamer/Zips are accurate measures of current talent, the players signed will decline 0.45 WAR per season after 2014, a win currently costs $6.4 Million, and the cost of a win will rise by 6% in the foreseeable future. Here’s the adjusted table:

Player Salary (M) Wins / Salary Projected WAR Net Wins
Robinson Cano $240 29.26 33.25 3.99
Jacoby Ellsbury $153 20.10 18.20 -1.90
Shin-Soo Choo $130 16.90 15.05 -1.85
Brian McCann $85 11.86 12.75 0.89
Curtis Granderson $60 8.58 6.10 -2.48
Jhonny Peralta $53 7.68 8.30 0.62
Matt Garza $52 7.46 8.50 1.04
Ricky Nolasco $49 7.02 5.90 -1.12
Carlos Beltran $45 6.64 4.05 -2.59
Omar Infante $32 4.54 4.90 0.36
Scott Feldman $30 4.46 4.95 0.49
Carlos Ruiz $26 3.83 7.05 3.22
James Loney $21 3.08 1.95 -1.13
Jarrod Saltalamacchia $21 3.08 3.90 0.82
Total $997 134.49 134.85 0.36

Reducing the rate of decline and increasing the cost of a win helps out the longer contracts quite a bit, so Robinson Cano’s contract starts to look a lot better. However, the net benefit is largely offset by committing such a massive amount of money to a single player who could get seriously injured or decline sooner than expected. With the new model, the Garza deal looks more like a bargain (although I would still hardly call it a steal), and a few contracts that looked like a market value or a slight overpay appear to be more team-friendly than initially anticipated (McCann, Peralta, Infante, Feldman, and Saltalamacchia). Carlos Ruiz looks like a downright steal. Keep in mind that even just netting half a win translates into an extra $3 Million of value, so we’re talking about a pretty significant savings here.

In closing, Cameron’s quick-and-dirty model works quite well, but given the contracts signed so far this season, appears to require some minor adjustment. It’s impossible to know which of the factors require adjusting and how they vary from one team to another, which is what makes projecting these contracts and determining whether a contract is a bargain or an overpay so difficult. As is always the case, only time will tell, and as more free agents sign we’ll be able to see if the new model checks out and make necessary adjustments.

All projections are from Steamer and ZiPS. Contract information is from Fangraphs and Baseball-Reference.
Do International Players Contribute More than Domestic Players: Part II

Last week I wrote an article on a little bit of research I had done regarding the contributions of domestic vs. international players in 2013, among players who had accumulated at least 300 plate appearances. See the link below in case you are interested to see the first piece:

http://www.fangraphs.com/community/do-international-players-contribute-more-than-domestic-players/

I got several great comments and ideas, which was the idea, so thank you for that, and I moved ahead to further the research with an extra question that was raised in a few of the comments. I investigated whether most of the international players are All-Star caliber. Obviously, “All-Star caliber” is a very vague description, but the idea is essentially to see if front offices aim to sign international players that they believe will contribute a significant amount at the Major League level, rather than just acting as an organizational filler.

In my experience in international baseball, players are not brought States-side from the Dominican academies because the front office believes the player will be a great organizational piece, so let’s bring him over and groom him to be a coach or scout some day when his playing days are over. That’s not the thought process. Those types of players are likely never going to make it off the island as a player.

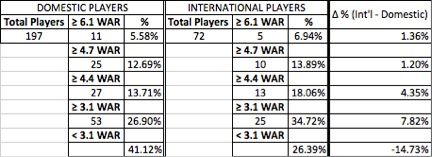
So the first thing I did was to take all the position players from the 2013 All-Star team and average all of their WAR values. That value comes out to 4.7 (WAR values taken from Baseball-Reference.com). I then sorted through each team to find how many players, domestic and international, had at least 4.7 WAR for the 2013 season. As I started to do this, however, I realized quickly that this 4.7 value might not be such a great marker. The All-Star roster is not the best way to find the best players in the game. Instead, I decided to make several markers and find the percentages of players that reached each of those marks. The average (4.7), median (4.4), and first (3.1) and third quartiles (6.1) were used to find percentages over a spectrum.

The results are summarized in the Table 1 below:

 photo war.jpg

The data shows that there was a slightly higher percentage of international players that contributed at least 4.7 and 6.1 WAR when compared to domestic players in 2013 – 1.20% and 1.36%, respectively. This is an insignificant increase to make any great conclusions, especially given the small sample size of looking only at the 2013 season.

At the lower levels of the spectrum, there is a much more sizable difference in the proportion of players that have contributed certain levels of WAR – at least 3.1 and at least 4.4 WAR. 3.1 WAR is not elite, but it still represents a significant role in a team’s lineup. The most interesting piece of information I gathered from the results came from looking at the percentage of players that contributed less than 3.1 WAR in 2013. The percentage is significantly higher (41.12%) for domestic players than international (26.39%). This indicates that the hypothesis was correct in saying that roster filler spots are more likely to be composed of domestic players. Almost 75% of all international players contributed at least 3.1 WAR, whereas only 58.88% of domestic players contributed at least 3.1 WAR. Keep in mind this sample only takes into account players that accumulated at least 300 plate appearances.

This might be due to the fact that there are so many more players that come through each organization’s system from the Rule 4 draft compared to from international talent. It’s easier to find, easier to scout, and overall a cheaper process to go through. As mentioned earlier, teams are probably looking to promote international prospects from their academies that will be more than organizational fillers in the minor leagues.

Thanks so much for reading and, as always, I’d love to hear thoughts, criticism, and possible future directions to continue!


Adjusted Quality Starts

Ah, the quality start. It’s one of several stats (along with Bill James’ Game Score and even the venerable, much-maligned pitcher win) designed to answer an age-old question: How well did the starting pitcher do his job? Most would agree that a pitcher’s job is to keep his team in the game and give his offense a good chance to win, and most would agree that even the bare-minimum quality start (6 IP, 3 ER) is at least an acceptable performance.

That said, the criteria for a quality start are pretty arbitrary, and they’ve invited a bit of criticism. Why is a six-inning, three-run performance a QS, but an eight-inning, four-run outing is not? Why do we say a pitcher had a “quality” performance if he pitched to the tune of a 4.50 ERA? What if a pitcher has a quality start through six, then blows it in the seventh inning or later?

The usual response to those criticisms is that, hey, they tend to get worked out in the aggregate. Overall, pitchers actually do post very good numbers in their quality starts. The 4.50 ERA “quality” pitcher is a myth.

Then again, if we want something that works out in the aggregate, why bother with QS? Most of the issues with plain old pitcher wins get worked out over time, too. Aren’t they a good enough proxy for quality performances?

Of course not. The idea behind quality starts is a good one. All we need is a clearer look at the question the stat is designed to answer, and we’ll have a better definition for the stat itself.

The question: “How many times did the pitcher give his team a good chance to win?”

The definition: A pitcher is awarded an Adjusted Quality Start (AQS) if he:

  1. Starts the game.
  2. Pitches at least six innings.
  3. Posts a run average (RA9) no worse than the league average.

#1 is, well, a requirement for something with the word “start” in its name. Moving on.

#2 is admittedly still arbitrary, but it’s a pretty good criterion, I think. A six-inning performance leaves only three innings to the bullpen, which isn’t all that much strain for most teams.

#3 is the change that gets to the heart of the issue. If the starter gives his team a decent number of at least league-average innings, then his teammates (assuming an average offense and average bullpen) should have at least a 50/50 shot at winning.

I use RA9 rather than ERA partly because of the well-documented issues with the definition of “earned” runs and partly because, as far as winning is concerned, it doesn’t especially matter whether a run is “earned” or not. A team that loses 4-3 because of four unearned runs still loses.

So, let’s put this metric to the test. In the American League in 2013, the league-average RA9 was 4.29, yielding three ways to post an AQS.

1) Pitch at least 6 innings, give up 2 or fewer runs.

This is by far the most common AQS because it includes all the zero-, one- and two-run starts. The top 10 in this sort of AQS were:

James Shields 20
Max Scherzer 20
Hisashi Iwakuma 19
Felix Hernandez 19
Bartolo Colon 19
Derek Holland 17
Ervin Santana 16
Anibal Sanchex 16
Justin Masterson 16
5 tied with 15

2) Pitch at least 6.1 innings, give up 3 runs.

Chris Sale was the master of the exactly-three-run AQS, as he did it 8 times in 2013. The top 10:

Chris Sale 8
Justin Verlander 7
James Shields 7
CC Sabathia 6
Jarrod Parker 6
Doug Fister 6
Yu Darvish 6
C.J. Wilson 5
7 tied with 4

3) Pitch at least 8.1 innings, give up 4 runs.

Unsurprisingly, this was by far the least common sort of AQS. It’s not often that a starter who gives up that many runs is allowed to pitch into the ninth. In fact, it only happened twice in the AL last year: CC Sabathia’s four-run, complete-game victory on June 5, and Corey Kluber’s 8.2-inning, four-run win on July 31.

Overall, your 2013 AL leaders in AQS:

James Shields 27
Max Scherzer 23
Hisashi Iwakuma 22
Chris Sale 22
Bartolo Colon 21
Doug Fister 21
Jarrod Parker 21
Justin Verlander 21
Yu Darvish 20
Felix Hernandez 20

Over in the National League, the average RA9 was a tick lower at 4.04. That’s not going to affect the two-and-fewer starts, but it’ll set the bar for the three- and four-run AQS a little higher.

1) Pitch at least 6 innings, give up 2 or fewer runs.

I doubt anyone will be surprised by the name at the top of the list.

Clayton Kershaw 22
Cole Hamels 20
Patrick Corbin 20
Jordan Zimmermann 19
Travis Wood 19
Madison Bumgarner 19
Zack Greinke 18
Gio Gonzalez 18
6 tied with 17

2) Pitch at least 7 innings, give up 3 earned runs.

Adam Wainwright 6
Cliff Lee 6
Mike Minor 4
Kris Medlen 4
Clayton Kershaw 4
Kyle Lohse 3
Cole Hamels 3
Andrew Cashner 3
Bronson Arroyo 3
13 tied with 2

(As an aside, the 6.2-inning, 3-run start just missed the cut-off in the NL, as that would be a 4.05 RA9 against a league average of 4.04. There were 22 starts that met those criteria in the NL last year, and I debated including them, but it would only make minor changes to the leaderboard. Mat Latos takes home the Just Missed Award with three such starts.)

3) Pitch at least 9 innings, give up 4 earned runs.

Only one NL pitcher pulled this one off in 2013. That was Brandon McCarthy, who gave up four in a complete-game loss on September 2.

Finally, your 2013 NL leaders in AQS:

Clayton Kershaw 26
Cole Hamels 23
Adam Wainwright 23
Cliff Lee 22
Madison Bumgarner 21
Patrick Corbin 21
Travis Wood 21
Jordan Zimmermann 21
Matt Cain 18
Zack Greinke 18
Gio Gonzalez 18
Lance Lynn 18

(If we include the 6.2-inning, 3-run starts, Gonzalez and Lynn take sole possession of ninth and tenth place with 20 and 19 AQS, respectively.)

There’s more that could be done with Adjusted Quality Starts – park factors, for instance – but that’s probably too much work for a stat that’s supposed to answer a pretty narrow question. If you want to know how often a starter kept his team in the game, this is a good, er, start.


Do International Players Contribute More than Domestic Players?

I have always wondered what the contribution of international players, players signed as amateur free agents, was compared to that of domestic players, players who went through the Rule 4 Draft process. So much money is spent annually on academies in the Dominican Republic and, to a lesser extent, in Venezuela. Of course, each team has a different budget for these international operations. The Yankees’ complex in the Dominican Republic is much more extravagant than the Marlins’, for example. Regardless, a question I have always asked is what the return on investment (ROI) is for these teams, seeing as greater than 90% of the players that come through these academies don’t ever reach the big leagues or develop into true prospects.

A little background on why I am so interested in this topic: I spent a year in the Dominican Republic, initially volunteering at a successful amateur agency in San Pedro de Macoris (an hour east of Santo Domingo), then helping out with the Dominican Prospect League’s showcases and tournaments, eventually landing with the Yankees as a Player Development/Video Operations intern.

Without access to financial statements, it is nearly impossible to determine a ROI for each team. Instead, I decided to do something much more simple. I looked at the WAR contributions for each team from international players and from domestic players.

I used Baseball-reference.com for all my information, sorting position players by plate appearances and used an arbitrary minimum of 400PA in order to include players that had enough opportunity to contribute in 2013, either positively or negatively.

On the extremes, in 2013 the Cardinals, Orioles, Nationals, and Phillies all had zero international players with at least 400PA, whereas the Diamondbacks, Rangers, Tigers, and Brewers each had four international players with the minimum plate appearances. Overall, 48 international players with at least 400PA combined for 141.6 WAR in 2013. On the other side, 151 domestic players combined for 396.5 WAR. Translated into WAR per player, international players contributed a rate of 3.0WAR/player and domestic players at a rate of 2.6WAR/player.

While going through the players of each team, I realized that I am leaving out players who contributed a significant WAR even though they did not accumulate 400PA, so I decided to lower the minimum to 300PA and change the rate statistic to WAR per 600PA, instead of per player. Players such as Hanley Ramirez were previously left out due to injury. Also, players who were traded midseason and did not have sufficient playing time to post 400PA with one team were previously excluded, such as Alfonso Soriano, are now included with the lowered minimum. Here is what the new results show:

Table 1: WAR per 600PA for international and domestic players during 2013 season. Minimum 300PA. WAR values taken from Baseball-reference.com.

PA

WAR

WAR/600PA

Int’l Players

32851

154.1

2.8

Domestic Players

101805

432.8

2.6


The results show that international players contributed a slightly higher rate of WAR per 600PA in 2013. The 0.2 greater WAR/600PA is not significant enough to conclude that international players contribute more talent per PA than did domestic players.

The next question I had was to determine what percentage of players who had 300PA were international and what percentage of WAR they contributed out of the total players with 300PA. What I found was that 24% of players with at least 300PA were international and they contributed 26% of WAR out of a total of 586.9 WAR. The percentage of players that are international seem to have contributed a similar percentage of overall WAR in 2013.

One small issue I came across was that there were a handful of players that went through the draft even though they are international players. A few examples are Jose Bautista (Dominican), Edwin Encarnacion (Dominican), Yan Gomes (Brazilian), Pedro Alvarez (Dominican), and Yonder Alonso (Cuban). I decided to switch this group of players from domestic to international. Table 2 shows WAR per 600PA, while changing this group of players from domestic to international.

Table 2: WAR per 600PA for international and domestic players during 2013 season, taking into account international players who were part of Rule 4 Draft. Minimum 300PA. WAR values taken from Baseball-reference.com.

PA

WAR

WAR/600PA

Int’l Players

36495

171.9

2.8

Domestic Players

98161

415.0

2.5


The data from Table 2 shows that the gap between international and domestic players of WAR/600PA increased to 0.3, but this gap is still not significant. The question about percentage of WAR contributed changes slightly, but also not significantly. International players contribute 29% of total WAR while international players only make up 27% of total players who had at least 300PA in 2013.

In conclusion, from this short study, I cannot say that international players contributed significantly more WAR than do domestic players in 2013, but there was a difference of 0.3 WAR/600PA in favor of international players. Furthermore, 27% of players with at least 300PA were international and they contributed 29% of the total WAR in 2013 of all players with at least 300PA.

I did not look at pitchers yet, but am open to hear thoughts, criticism, and possible future directions to continue this brief study!


Ten Most Valuable Hitting Fantasy Seasons Since 1920

One of the best features of the wins above replacement (WAR) statistic is that it allows us to compare the greatest single-season performances across different eras in baseball history.  Anyone who has browsed the FanGraphs Leaders page should know that Babe Ruth had the top-five WAR seasons in history, all in the 1920s.  In terms of offensive runs added (batting and base running), Ruth’s 1921 season ranks as the best ever, followed by Barry Bonds’ 73 home run “asterisk” season of 2001.  But what about fantasy baseball?  Were these also the greatest (read most valuable) rotisserie seasons ever recorded?  That’s the question I set out to answer.

Using a slightly modified version of Zach Sander’s fantasy value above replacement (FVAR) system for valuing fantasy players, I estimated the auction value for every hitting season from 1920-2013.  First, I determined every player’s position eligibility based on some simple assumptions (meant to reflect Yahoo’s approach) whereby a player is eligible for a position if they meet any of the following criteria:

  • Played at least 20 games at the position in the previous season.
  • Started at least 5 games at the position during the current season.
  • Played at least 10 games at the position in the current season.

With that established, I proceeded to calculate the z-scores, FVAR and  auction values (FVAR$) for roto leagues.  Based on a 5×5 12-team mixed league with $260 budget per team (and quite a few other assumptions) here are the ten most valuable fantasy seasons for hitters since 1920 (5×5, 12-team mixed):

Rank

Season

Name

POS

PA

AVG

R

HR

RBI

SB

FVAR$

1

2007

Alex Rodriguez

3B

708

0.314

143

54

156

24

$56

2

1997

Larry Walker

OF

664

0.366

143

49

130

33

$55

3

1985

Rickey Henderson

OF

654

0.314

146

24

72

80

$55

4

1983

Tim Raines

2B

720

0.298

133

11

71

90

$53

5

1963

Hank Aaron

OF

714

0.319

121

44

130

31

$53

6

1988

Jose Canseco

OF

705

0.307

120

42

124

40

$53

7

1993

Barry Bonds

OF

674

0.336

129

46

123

29

$52

8

1982

Rickey Henderson

OF

656

0.267

119

10

51

130

$52

9

1921

Babe Ruth

OF

693

0.378

177

59

171

17

$51

10

1974

Lou Brock

OF

702

0.306

105

3

48

118

$51

At this point you’re probably asking: “What, A-Rod?!?!”  I know, as a Red Sox fan and sentient being I was not happy to see A-Rod at the top of the heap.  As much as you may like or dislike A-Rod in real life, if you drafted him first overall in your 2007 fantasy league you were not disappointed with his across-the-board production.  But, you might also be asking, as I did, how was A-Rod’s 2007 season worth $5 more than Babe Ruth’s 1921 season?   Ruth’s hitting and base running in 1921 added 119 runs compared to 75 runs added for A-Rod in 2007, so what gives?  As best I can tell, here are some reasons why A-Rod-2007 had a higher FVAR$ than Ruth-1921:

  • Ruth’s replacement in 1921, Ralph Miller, was much worse than A-Rod’s replacement in 2007, Melky Cabrera.
  • As a result Ruth-1921 had a much higher FVARz score than A-Rod-2007, but the average above-replacement player in 1921 also had a higher FVARz than the average above-replacement player in 2007.
  • As shown in Zach Sanders’ third post on FVAR, the auction values are a function of FVARz divided by the average FVARz for above-replacement players.  Hence, Ruth’s FVARz was divided by a larger number to calculate FVAR$.

Does this make sense?  Yes actually, I think it does.  What it means is that in 2007 A-Rod and Melky Cabrera together were worth more than Babe Ruth and Ralph Miller together in 1921.  In a fantasy auction in 1921 it would have been unwise to spend too many fake dollars on the best players like Ruth and Hornsby (or drink in public because of that Prohibition thing) because you would have been stuck with the bottom players, like Ralph Miller, who were really, really bad (there were only 16 teams back then and no DH).

For fun, below is a dream fantasy lineup with the best hitters since 1920 at each position (5×5, 12-team mixed).  Enjoy.

Order

Season

Name

POS

PA

AVG

R

HR

RBI

SB

FVAR$

1

1983

Tim Raines

2B

720

0.298

133

11

71

90

$53

2

1985

Rickey Henderson

OF

654

0.314

146

24

72

80

$55

3

2007

Alex Rodriguez

3B

708

0.314

143

54

156

24

$56

4

1927

Lou Gehrig

1B

717

0.373

149

47

175

10

$48

5

2006

David Ortiz

Util

686

0.287

115

54

137

1

$34

6

1997

Larry Walker

OF

664

0.366

143

49

130

33

$55

7

1963

Hank Aaron

OF

714

0.319

121

44

130

31

$53

8

1997

Mike Piazza

C

633

0.362

104

40

124

5

$45

9

1998

Alex Rodriguez

SS

748

0.31

123

42

124

46

$48

I’m hoping to write more posts like this using historical FVAR, especially if readers/commenters think it worthwhile.

Twitter: @FVARBaseball

Website: fvarbaseball.wordpress.com


Pitcher Runs

Pitching statistics are mostly based on rates. Sure, we have innings pitched, and if you want to annoy me, you can talk about wins and losses, and of course there are the “three true outcomes” of strikeouts, walks, and home runs, plus WAR. But nobody ever looks at how many runs a pitcher was above or below average. Runs allowed isn’t all that common of a statistic; you’re more likely to see ERA or RA9. Even strikeouts and walks are often expressed as a percentage of all plate appearances, or as an amount per nine innings. The defense-independent ERA estimators like FIP and its spinoffs are rates, just like ERA. Where batters have regressed plus-minus or counting stats like wRAA and wRC, pitchers have nothing.

However, there has got to be some value in counting stats for pitchers. If we want to know how many more or fewer runs a team would allow by putting in an average pitcher instead of any given pitcher, that statistic would be able to tell us. So I’m going to present here three basic different numbers, one based off of FIP, one based off of straight runs allowed, and the third based off of linear weights. Each will be in two forms – raw runs allowed and runs allowed above or below average. I’ll call them FIP-Runs and FIP-Runs Above Average (FIPRAA), wRC-Runs and wRC-Runs Above Average (wRCRAA), and, obviously Runs and Runs Above Average (RAA). Kind of long, yeah, but I didn’t want to call the FIP one FRAA because that already exists.

All data was obtained from FanGraphs except for the singles, doubles, triples, home runs, walks, and HBP against used to calculate wRC; FanGraphs does not have some of those so I used Baseball-Reference.

FIP-Runs

This should be pretty simple. Take a pitcher’s FIP. FIP is scaled like ERA, but we want to scale it to RA9 because we want to scale it to all the runs a pitcher allows, not just the earned runs. To do this, multiply it by a constant that changes yearly – for 2013, it was 1.08. This is the league RA9 divided by the league ERA.

Take that figure, multiply it by the number of innings they pitched, and divide by nine to get the number of runs that FIP says a pitcher should have allowed. That’s their FIP-Runs. Great. But now how do we get that to express how many runs above average they were worth?

Well, we already have FIP-, which tells us how much better a pitcher’s FIP was than league average – and it’s already park- and league-adjusted, to boot. So what I did was subtract each pitcher’s FIP- from 200 to get the inverse of their FIP- (so if a pitcher had a 90 FIP-, the inverse would be 110) and multiplied that by their FIP-Runs. That gave me the number of runs (adjusted to the park and league) that an average pitcher would give up in the same number of innings. Just subtract the pitcher’s FIP-Runs, and you have your FIPRAA. And while I was at it, I did the same thing for xFIP. You can find the numbers at the end of the article. But first, the next part:

Runs

I didn’t have to calculate these like I did with FIP-Runs because the numbers are already there – it’s just the total number of runs a pitcher allowed. I did, however, have to calculate RAA, for which I used the same method as I did with FIP-Runs: find the RA9- (this was not park- or league-adjusted because I calculated it myself), take the inverse, multiply it by the runs, and subtract the runs from that. Piece of cake. Now for the last, and hardest, part of this:

wRC-Runs

These were tricky. I had to calculate each pitcher’s wRC against by first finding their wOBA against with the raw number of singles, doubles, triples, etc. they gave up and converting that into wRC. (I’ve actually already put this in a community post in a different form). But from there, I could follow the same instructions as before: use the wRC against as runs allowed, find the wRC/9- (if you didn’t read the article I linked to earlier, wRC/9 is just wRC against scaled like RA/9), and from those two find the wRCRAA (quite a mouthful, I know).

So, without further ado, here are the numbers (sorted by FIPRAA):

Name Team IP FIP-Runs FIPRAA xFIP-Runs xFIPRAA wRC-Runs wRCRAA Runs RAA
Clayton Kershaw Dodgers 236 67.7 23.0 81.6 19.6 40.5 25.1 55 27.4
Max Scherzer Tigers 214.1 70.5 22.6 81.3 16.3 55.4 23.7 73 19.5
Adam Wainwright Cardinals 241.2 74.0 22.2 81.2 21.1 76.2 23.0 83 21.6
Felix Hernandez Mariners 204.1 64.0 21.8 65.2 21.5 69.9 16.9 74 16.3
Anibal Sanchez Tigers 182 52.2 21.4 63.6 16.5 57.8 17.1 56 18.9
Cliff Lee Phillies 222.2 75.4 19.6 74.3 19.3 69.6 21.4 77 19.7
Matt Harvey Mets 178.1 42.8 19.3 56.3 16.9 32.9 19.4 46 20.5
Chris Sale White Sox 214.1 81.5 18.8 75.9 19.0 72.8 18.0 81 15.1
Yu Darvish Rangers 209.2 82.5 18.2 71.5 20.0 66.4 19.8 68 20.5
Jhoulys Chacin Rockies 197.1 82.2 16.4 94.0 -4.7 8.1 7.4 82 8.6
Justin Verlander Tigers 218.1 85.9 16.3 96.2 7.7 95.7 2.7 94 6.9
Jose Fernandez Marlins 172.2 56.6 15.8 63.8 11.5 4.8 4.5 47 19.5
Derek Holland Rangers 213 87.9 15.8 94.1 6.6 95.7 0.4 90 8.1
Doug Fister Tigers 208.2 81.6 15.5 85.6 12.0 96.2 -2.1 91 5.6
A.J. Burnett Pirates 191 64.2 15.4 66.9 15.4 68.2 14.2 79 8.6
Mat Latos Reds 210.2 78.4 14.9 90.0 4.5 79.9 12.7 82 13.3
David Price Rays 186.2 67.9 13.6 73.2 13.2 67.3 13.5 78 7.8
James Shields Royals 228.2 95.2 13.3 102.1 6.1 21.9 17.3 82 18.7
Cole Hamels Phillies 220 86.1 12.0 90.8 8.2 89.2 9.0 94 7.5
Jon Lester Red Sox 213.1 91.9 11.9 99.8 2.0 46.8 24.0 94 4.8
Bartolo Colon Athletics 190.1 73.8 11.8 90.2 0.0 69.1 13.5 60 19.3
Hisashi Iwakuma Mariners 219.2 90.7 11.8 86.5 14.7 66.5 21.9 69 22.3
Clay Buchholz Red Sox 108.1 36.1 11.6 44.3 6.2 24.5 12.2 23 12.5
Francisco Liriano Pirates 161 56.4 11.3 60.3 10.2 53.3 14.2 54 15.0
Patrick Corbin Diamondbacks 208.1 85.8 11.1 87.0 7.0 81.2 11.1 81 13.2
Homer Bailey Reds 209 83.0 10.8 83.8 9.2 76.4 14.5 85 10.6
Stephen Strasburg Nationals 183 70.5 10.6 69.2 11.1 52.3 19.2 71 11.7
Hiroki Kuroda Yankees 201.1 86.0 10.3 87.0 7.8 79.8 9.7 79 12.3
Madison Bumgarner Giants 201.1 73.7 10.3 80.2 9.6 49.2 22.5 68 18.5
Jorge de la Rosa Rockies 167.2 75.7 9.8 82.1 -6.6 75.4 0.2 70 7.1
Rick Porcello Tigers 177 75.0 9.7 67.8 12.9 77.2 2.5 87 -5.1
Jordan Zimmermann Nationals 213.1 86.0 9.5 89.1 7.1 13.3 11.5 81 14.8
Justin Masterson Indians 193 77.6 9.3 77.1 12.3 69.6 14.0 75 12.2
Drew Smyly Tigers 76 21.1 9.1 27.3 6.5 21.2 8.1 20 8.7
Nate Jones White Sox 78 24.7 8.9 25.9 7.8 28.1 5.6 40 -4.2
Koji Uehara Red Sox 74.1 14.4 8.8 18.6 8.7 -0.4 -0.4 10 7.1
Ivan Nova Yankees 139.1 58.0 8.7 61.5 4.3 58.9 3.7 49 11.9
Gerrit Cole Pirates 117.1 41.0 8.6 44.2 7.5 40.0 9.8 43 9.1
Trevor Rosenthal Cardinals 75.1 17.3 8.3 21.2 8.0 24.0 7.0 25 7.1
Mike Minor Braves 204.2 82.8 8.3 89.4 2.7 71.2 16.3 79 13.3
Kenley Jansen Dodgers 76.2 18.3 8.2 19.0 8.7 12.6 8.0 16 8.8
Joe Nathan Rangers 64.2 17.5 8.1 25.4 4.3 0.8 0.8 10 6.7
Adam Ottavino Rockies 78.1 29.6 8.0 33.3 2.0 29.3 5.0 27 7.0
Ricky Nolasco – – – 199.1 79.9 8.0 85.6 4.3 83.6 5.9 90 2.5
Brandon Kintzler Brewers 77 23.5 8.0 27.1 6.0 17.5 8.7 26 7.1
Matt Belisle Rockies 73 26.5 8.0 26.2 5.5 30.6 2.1 37 -3.4
Lance Lynn Cardinals 201.2 79.4 7.9 88.6 2.7 90.4 0.6 92 1.6
Mark Melancon Pirates 71 14.0 7.8 17.5 8.0 12.0 7.5 15 8.2
Corey Kluber Indians 147.1 58.3 7.6 54.8 12.1 69.1 -2.8 67 1.4
Ubaldo Jimenez Indians 182.2 75.2 7.5 79.4 7.1 79.5 2.8 75 8.7
David Robertson Yankees 66.1 20.8 7.5 20.7 7.0 17.3 7.3 15 7.7
Hyun-Jin Ryu Dodgers 192 74.6 7.5 79.7 6.4 69.4 13.8 67 16.7
Craig Kimbrel Braves 67 15.5 7.4 15.7 7.7 9.4 6.5 10 6.8
Andy Pettitte Yankees 185.1 82.3 7.4 86.3 1.7 89.0 -5.7 85 1.1
Tyler Chatwood Rockies 111.1 48.9 7.3 53.4 -3.2 50.7 -0.5 44 6.6
Greg Holland Royals 67 10.9 7.2 13.5 7.7 8.1 5.9 11 7.1
Gio Gonzalez Nationals 195.2 80.1 7.2 82.4 5.8 77.8 9.2 79 10.3
Steve Cishek Marlins 69.2 21.1 7.2 24.9 5.2 2.4 2.2 19 7.8
Alex Wood Braves 77.2 24.7 7.2 29.6 4.7 30.4 4.0 29 5.7
C.J. Wilson Angels 212.1 89.4 7.2 100.1 1.0 92.7 3.0 93 5.3
Neal Cotts Rangers 57 14.8 7.1 19.3 5.6 8.5 5.7 8 5.6
Glen Perkins Twins 62.2 18.7 6.9 19.6 6.7 14.5 7.1 16 7.2
Craig Stammen Nationals 81.2 27.6 6.9 30.2 5.4 31.1 4.8 30 6.3
Zack Greinke Dodgers 177.2 68.9 6.9 73.6 6.6 60.8 14.7 54 18.7
Aroldis Chapman Reds 63.2 18.9 6.8 15.8 7.1 15.9 7.1 18 7.0
Joaquin Benoit Tigers 67 23.1 6.7 25.4 5.1 8.0 5.9 15 7.8
Danny Farquhar Mariners 55.2 12.4 6.6 16.0 6.3 14.2 6.2 29 -3.5
Sean Doolittle Athletics 69 22.4 6.5 30.5 2.1 16.0 7.8 24 6.0
Luke Hochevar Royals 70.1 25.0 6.5 24.5 6.6 12.4 7.6 15 8.1
Anthony Swarzak Twins 96 37.8 6.4 43.9 1.8 33.1 7.8 33 8.6
Ryan Cook Athletics 67.1 22.1 6.4 30.0 1.8 23.9 5.1 22 6.5
Jose Quintana White Sox 200 91.7 6.4 92.6 2.8 5.1 4.8 83 8.8
Alex Cobb Rays 143.1 57.8 6.4 51.9 12.5 49.1 11.8 46 14.2
Steve Delabar Blue Jays 58.2 19.1 6.3 23.6 3.5 14.6 6.5 25 2.1
Henderson Alvarez Marlins 102.2 39.2 6.3 48.9 -2.4 35.5 8.3 42 5.0
Addison Reed White Sox 71.1 27.1 6.2 32.3 1.6 20.3 7.5 31 2.0
Sonny Gray Athletics 64 20.7 6.2 22.4 5.8 17.0 7.0 22 5.7
Alex Torres Rays 58 16.1 6.1 23.0 3.9 7.5 5.3 12 6.7
Brett Cecil Blue Jays 60.2 21.0 6.1 21.8 5.2 16.5 6.6 20 5.8
Rex Brothers Rockies 67.1 27.1 6.0 28.2 2.0 23.1 5.5 16 7.8
Felix Doubront Red Sox 162.1 73.6 5.9 80.6 -3.2 81.9 -9.7 84 -9.6
Mariano Rivera Yankees 64 23.4 5.9 23.7 5.2 18.1 6.8 16 7.4
Wilton Lopez Rockies 75.1 32.3 5.8 33.4 0.7 37.3 -3.7 35 0.0
Junichi Tazawa Red Sox 68.1 26.4 5.8 24.8 5.7 31.3 -0.5 25 5.3
Robbie Ross Rangers 62.1 23.8 5.7 25.4 3.6 26.9 1.1 21 5.8
Fernando Rodney Rays 66.2 22.7 5.7 24.9 5.2 24.4 4.6 27 3.5
Tanner Roark Nationals 53.2 15.5 5.6 20.2 3.4 6.2 4.6 11 6.1
Jason Grilli Pirates 50 11.8 5.6 13.3 5.6 13.2 5.5 15 5.3
Casey Janssen Blue Jays 52.2 17.3 5.5 19.5 4.3 12.0 5.9 17 5.2
Dane de la Rosa Angels 72.1 26.0 5.5 30.3 3.6 18.7 8.0 25 6.4
Luke Gregerson Padres 66.1 21.5 5.4 26.8 3.0 15.8 7.5 24 5.3
David Carpenter Braves 65.2 22.3 5.4 24.5 4.2 13.9 7.4 13 7.5
Scott Kazmir Indians 158 66.5 5.3 63.7 9.6 77.8 -7.2 76 -2.7
Cody Allen Indians 70.1 25.2 5.3 27.6 4.7 27.7 3.5 22 7.2
Tyson Ross Padres 125 48.0 5.3 51.5 4.6 40.4 11.4 51 6.2
Matt Lindstrom White Sox 60.2 22.9 5.3 28.2 0.6 26.2 1.1 23 4.2
Josh Outman Rockies 54 21.1 5.3 23.5 0.9 14.5 5.9 27 -2.1
John Lackey Red Sox 189.1 87.7 5.3 79.3 9.5 4.8 4.6 80 7.2
Charlie Furbush Mariners 65 23.9 5.3 26.3 3.9 13.0 7.2 33 -3.1
Bryan Shaw Indians 75 27.6 5.2 32.2 3.2 21.6 7.8 31 3.4
Jean Machi Giants 53 14.6 5.2 17.7 4.6 8.3 5.4 15 5.9
Will Harris Diamondbacks 52.2 17.3 5.2 19.7 3.4 19.8 3.3 17 5.2
Brian Matusz Orioles 51 17.8 5.2 22.0 2.0 15.6 5.0 21 2.4
Bobby Parnell Mets 50 14.0 5.0 18.3 3.5 9.5 5.5 17 4.6
Aaron Loup Blue Jays 69.1 27.6 5.0 27.5 4.4 24.7 5.2 23 6.6
Kris Medlen Braves 197 82.3 4.9 83.9 5.0 85.4 3.3 77 12.2
Nick Vincent Padres 46.1 11.5 4.9 16.1 3.7 7.0 4.6 11 5.4
Andrew Cashner Padres 175 70.4 4.9 76.0 3.0 58.2 15.3 68 11.1
Sam LeCure Reds 61 21.7 4.8 24.3 2.9 -0.1 -0.1 18 6.6
Tyler Thornburg Brewers 66.2 24.9 4.7 35.4 -6.4 17.9 7.3 17 7.7
Casey Fien Twins 62 23.5 4.7 20.2 6.5 17.2 6.6 28 0.8
A.J. Ramos Marlins 80 31.1 4.7 39.1 -3.1 25.7 7.4 32 4.4
Josh Collmenter Diamondbacks 92 38.3 4.6 44.8 -3.6 27.1 9.4 34 6.9
Mike Dunn Marlins 67.2 25.3 4.6 30.0 0.6 18.7 7.3 21 7.0
Jesse Chavez Athletics 57.1 20.7 4.6 26.4 0.8 20.0 4.5 27 -0.4
Michael Wacha Cardinals 64.2 22.7 4.5 26.1 2.9 75.2 -118.8 20 6.7
Jonathan Papelbon Phillies 61.2 22.6 4.5 26.0 1.8 20.3 5.5 23 4.5
Jamey Wright Rays 70 26.3 4.5 29.2 3.5 -0.4 -0.4 25 5.8
Jim Johnson Orioles 70.1 29.1 4.4 28.5 4.3 19.7 7.5 26 5.3
Dan Otero Athletics 39 9.9 4.4 14.9 3.0 11.8 3.9 7 4.3
J.P. Howell Dodgers 62 21.5 4.3 25.9 2.1 13.3 7.0 15 7.2
Brian Duensing Twins 61 23.7 4.3 27.2 1.6 30.5 -3.3 28 0.3
Jesse Crain White Sox 36.2 6.7 4.2 12.9 3.4 17.2 -0.7 6 3.9
Blake Parker Cubs 46.1 16.1 4.2 19.7 1.2 15.8 3.9 17 3.6
Sergio Romo Giants 60.1 20.6 4.1 23.2 3.5 17.2 6.3 20 5.7
Kevin Siegrist Cardinals 39.2 10.9 4.0 14.3 3.0 3.6 2.9 2 1.8
Jason Frasor Rangers 49 19.8 4.0 21.3 1.9 83.2 -229.7 15 5.1
Jake Diekman Phillies 38.1 11.5 3.9 13.2 3.2 36.2 -39.6 15 2.4
LaTroy Hawkins Mets 70.2 25.9 3.9 26.5 4.5 23.8 6.0 27 4.8
Brad Ziegler Diamondbacks 73 29.8 3.9 29.1 3.5 18.5 8.1 20 8.2
Tim Hudson Braves 131.1 54.5 3.8 56.1 2.8 47.6 9.3 60 1.0
Tommy Hunter Orioles 86.1 38.1 3.8 37.6 3.0 6.7 5.6 28 8.4
Jordan Walden Braves 47 15.8 3.8 19.8 1.4 89.2 -285.9 19 2.5
Dan Jennings Marlins 40.2 13.1 3.8 17.6 0.7 17.6 0.7 17 1.7
Tanner Scheppers Rangers 76.2 34.4 3.8 35.7 0.7 22.1 8.0 21 8.6
Oliver Perez Mariners 53 20.7 3.7 21.4 3.2 25.6 -1.8 23 1.5
Javier Lopez Giants 39.1 11.4 3.6 13.8 3.2 78.9 -271.9 10 4.5
Matt Garza – – – 155.1 72.3 3.6 69.5 2.8 67.9 2.1 73 -0.9
Tony Watson Pirates 71.2 27.5 3.6 32.0 0.3 14.5 8.0 19 8.2
Louis Coleman Royals 29.2 7.3 3.6 9.6 3.1 3.7 2.7 2 1.7
Tim Collins Royals 53.1 21.8 3.5 27.5 -2.2 23.1 0.9 26 -1.3
Roy Oswalt Rockies 32.1 12.0 3.5 13.2 1.3 25.7 -19.5 31 -33.0
Manny Parra Reds 46 16.9 3.4 15.4 4.0 18.4 2.1 18 2.8
Danny Salazar Indians 52 19.7 3.4 17.2 5.1 19.0 3.6 18 4.6
Craig Breslow Red Sox 59.2 25.8 3.4 31.3 -3.1 20.4 5.0 16 6.8
Randy Choate Cardinals 35.1 10.9 3.3 14.0 1.7 7.8 4.0 9 4.1
Antonio Bastardo Phillies 42.2 15.4 3.2 20.9 -1.9 14.9 3.4 12 4.7
Darren O’Day Orioles 62 26.6 3.2 26.7 2.4 18.9 6.1 16 7.1
Yusmeiro Petit Giants 48 16.5 3.1 20.0 1.6 17.3 3.5 19 2.8
Luis Avilan Braves 65 25.6 3.1 31.4 -2.2 9.1 6.3 12 7.2
Sergio Santos Blue Jays 25.2 5.7 3.1 8.0 2.7 -1.1 -1.2 5 2.9
Brandon McCarthy Diamondbacks 135 60.8 3.0 61.1 0.0 68.9 -9.0 71 -9.4
Ervin Santana Royals 211 99.5 3.0 93.4 6.5 79.9 12.9 85 11.3
Chad Qualls Marlins 62 24.7 3.0 24.2 3.4 19.5 5.9 18 6.7
Pedro Strop – – – 57.1 24.4 2.9 22.7 3.4 22.4 3.0 30 -3.8
Vin Mazzaro Pirates 73.2 29.3 2.9 35.4 -2.1 23.8 6.8 23 7.5
Andrew Miller Red Sox 30.2 11.2 2.9 9.0 3.4 12.2 1.4 12 1.9
Brandon Workman Red Sox 41.2 17.2 2.9 15.9 3.2 21.1 -2.6 23 -4.3
Jeff Samardzija Cubs 213.2 96.7 2.9 88.5 7.1 21.1 16.5 109 -10.7
Scott Downs – – – 43.1 16.1 2.9 17.2 2.7 19.0 0.6 13 4.6
Rafael Betancourt Rockies 28.2 11.1 2.9 14.5 -1.7 10.2 2.1 15 -1.9
Paco Rodriguez Dodgers 54.1 20.1 2.8 19.0 4.4 7.5 5.2 15 6.1
Brandon Cumpton Pirates 30.2 9.6 2.8 12.5 1.3 6.3 3.4 8 3.5
Jake Peavy – – – 144.2 68.7 2.7 70.0 -1.4 14.5 11.3 70 -2.9
Bruce Rondon Tigers 28.2 10.4 2.7 11.0 2.1 13.4 -0.5 11 1.9
Caleb Thielbar Twins 46 18.8 2.6 22.9 -0.9 6.2 4.3 11 5.3
Jenrry Mejia Mets 27.1 8.1 2.6 7.6 3.0 106.3 -810.8 9 2.6
Jared Burton Twins 66 28.6 2.6 31.2 0.3 24.3 4.5 29 1.6
Alex Wilson Red Sox 27.2 10.2 2.6 16.0 -3.4 18.1 -8.1 16 -3.9
Shawn Kelley Yankees 53.1 23.2 2.6 20.7 3.7 25.0 -0.9 28 -3.7
Garrett Richards Angels 145 63.7 2.5 62.3 6.2 61.8 3.4 73 -6.1
Jose Mijares Giants 49 17.9 2.5 22.9 -0.9 31.8 -14.0 24 -1.3
J.J. Hoover Reds 66 27.5 2.5 31.4 -1.6 20.7 6.3 21 6.6
Bud Norris – – – 176.2 81.8 2.5 89.5 -5.4 101.3 -27.4 89 -7.5
Jose Veras – – – 62.2 27.2 2.5 29.7 0.0 11.5 6.8 23 4.8
Edwin Jackson Cubs 175.1 79.7 2.4 81.2 -1.6 95.6 -20.0 110 -38.6
Gonzalez Germen Mets 34.1 11.9 2.4 17.1 -1.7 14.6 0.8 15 0.9
David Phelps Yankees 86.2 39.6 2.4 41.9 -0.8 45.7 -7.8 50 -12.1
Ryan Pressly Twins 76.2 33.8 2.4 39.5 -3.2 30.4 3.7 37 -1.4
Grant Balfour Athletics 62.2 26.2 2.4 25.7 3.6 19.7 6.0 20 6.3
Matt Reynolds Diamondbacks 27.1 9.7 2.3 10.9 1.3 9.0 2.4 7 3.1
Chad Gaudin Giants 97 38.9 2.3 46.6 -2.8 34.2 7.5 34 8.3
Jake McGee Rays 62.2 25.6 2.3 23.4 5.1 -0.4 -0.4 28 1.1
Nathan Eovaldi Marlins 106.1 45.8 2.3 53.0 -5.3 42.8 4.6 44 4.8
Brett Oberholtzer Astros 71.2 31.4 2.2 36.7 -2.9 26.0 5.1 26 5.7
Anthony Varvaro Braves 73.1 30.5 2.1 36.9 -4.1 25.8 5.7 25 6.6
Michael Roth Angels 20 5.8 2.1 8.7 0.7 2.4 1.8 16 -11.6
Burke Badenhop Brewers 62.1 26.4 2.1 25.4 2.5 22.2 4.7 32 -3.4
Matt Albers Indians 63 26.4 2.1 28.9 1.2 20.3 5.8 25 3.6
Justin Wilson Pirates 73.2 30.1 2.1 33.8 -0.3 16.9 8.3 17 8.6
Danny Duffy Royals 24.1 9.0 2.1 13.4 -2.1 8.9 1.7 5 2.8
Kelvin Herrera Royals 58.1 25.9 2.1 20.0 5.6 24.5 1.7 27 0.1
T.J. McFarland Orioles 74.2 34.4 2.1 33.0 2.3 36.6 -3.1 37 -2.5
B.J. Rosenberg Phillies 19.2 5.9 2.1 10.1 -1.4 8.3 0.5 10 -0.9
Drake Britton Red Sox 21 7.7 2.0 8.9 1.0 8.9 0.6 9 0.7
Darin Downs Tigers 35.1 15.0 1.9 15.0 1.6 17.9 -2.2 20 -4.4
Fernando Abad Nationals 37.2 14.7 1.9 17.9 -0.9 17.3 -0.3 14 2.8
Will Smith Royals 33.1 14.1 1.8 10.0 3.7 10.1 3.3 16 -0.5
Tom Wilhelmsen Mariners 59 26.1 1.8 32.4 -4.9 45.0 -31.0 28 -0.6
Al Alburquerque Tigers 49 21.9 1.7 20.5 2.5 20.9 1.2 25 -2.5
Taijuan Walker Mariners 15 4.1 1.7 6.8 0.3 3.2 1.7 7 0.0
Ryan Webb Marlins 80.1 34.7 1.7 36.5 -0.4 28.9 5.9 30 5.9
Eric Stults Padres 203.2 86.3 1.7 100.9 -10.1 93.3 -1.4 97 -2.5
Robert Coello Angels 17 5.1 1.7 6.7 1.1 5.7 1.5 7 0.8
Rob Wooten Brewers 27.2 10.6 1.7 14.1 -1.8 9.7 2.2 12 0.8
James Paxton Mariners 24 9.4 1.7 8.9 2.0 18.2 -12.5 5 2.8
Carlos Martinez Cardinals 28.1 10.5 1.7 13.0 -0.3 13.2 -0.4 16 -3.5
Francisco Rodriguez – – – 46.2 20.4 1.6 17.0 3.4 19.4 1.5 14 5.0
Joe Smith Indians 63 27.2 1.6 28.0 2.0 6.8 5.2 17 7.1
Juan Nicasio Rockies 157.2 80.4 1.6 81.7 -12.3 88.9 -22.2 97 -31.5
Kevin Jepsen Angels 36 14.6 1.6 17.0 0.2 18.3 -2.4 21 -5.4
Jim Henderson Brewers 60 25.8 1.5 23.8 2.9 80.2 -157.7 18 6.4
Seth Maness Cardinals 62 25.5 1.5 23.3 4.0 23.8 3.6 17 7.0
Taylor Jordan Nationals 51.2 21.6 1.5 23.6 -0.2 23.7 -0.4 27 -3.4
Brian Wilson Dodgers 13.2 3.3 1.5 4.6 1.2 1.7 1.2 1 0.8
Joe Thatcher – – – 39.1 16.0 1.4 16.8 1.0 22.2 -5.6 14 3.3
Daniel Webb White Sox 11.1 3.2 1.4 4.3 0.9 2.2 1.2 4 1.0
Michael Tonkin Twins 11.1 2.8 1.3 4.8 0.5 3.0 1.2 6 -0.8
Joe Ortiz Rangers 44.2 21.3 1.3 20.5 0.8 6.2 4.3 26 -6.6
Joakim Soria Rangers 23.2 10.5 1.3 10.1 1.0 -0.6 -0.7 10 0.9
Scott Rice Mets 51 20.8 1.2 23.4 -0.2 17.2 4.4 22 1.6
Bobby LaFromboise Mariners 10.2 2.7 1.2 4.5 0.5 4.2 0.5 8 -4.9
Marc Rzepczynski – – – 30.2 12.4 1.2 13.1 1.2 11.3 2.1 13 1.1
Juan Gutierrez – – – 55.1 24.8 1.2 27.2 -0.8 12.6 6.2 29 -3.7
Sean Marshall Reds 10.1 2.5 1.2 3.4 0.9 -0.6 -0.7 3 1.1
Ryan Mattheus Nationals 35.1 14.6 1.2 17.1 -1.2 25.1 -14.3 26 -15.2
Kyuji Fujikawa Cubs 12 4.0 1.1 4.1 1.0 5.2 0.2 7 -1.8
Juan Perez Blue Jays 31.2 14.1 1.1 12.9 1.9 10.9 2.6 17 -2.6
Boone Logan Yankees 39 17.9 1.1 12.7 3.9 14.1 2.8 15 2.6
Drew Storen Nationals 61.2 26.8 1.1 27.5 0.3 29.2 -1.4 34 -6.4
Buddy Boshers Angels 15.1 5.7 1.0 7.9 -0.6 5.7 1.0 8 -1.0
Stolmy Pimentel Pirates 9.1 2.0 1.0 3.8 0.4 0.4 0.4 4 0.3
Dustin McGowan Blue Jays 25.2 11.3 1.0 12.9 -0.8 8.8 2.1 11 0.8
Charlie Morton Pirates 116 50.1 1.0 51.4 1.0 50.6 1.6 51 2.7
Francisley Bueno Royals 8.1 2.6 0.9 4.0 -0.1 -0.6 -0.7 0 0.0
Rafael Soriano Nationals 66.2 29.2 0.9 32.4 -2.3 25.3 4.0 24 5.4
Keith Butler Cardinals 20 7.8 0.9 13.0 -5.9 6.1 2.0 9 0.3
Kris Johnson Pirates 10.1 3.4 0.9 4.9 -0.2 5.2 -0.6 7 -3.2
Sam Freeman Cardinals 12.1 4.4 0.8 6.9 -1.6 9.3 -6.3 3 1.4
Lucas Luetge Mariners 37 16.7 0.8 18.5 -0.9 20.7 -4.9 22 -6.2
David Hale Braves 11 1.0 0.8 1.7 1.1 2.8 1.2 1 0.8
Julio Teheran Braves 185.2 82.2 0.8 83.8 0.0 77.6 5.7 69 13.8
Stephen Pryor Mariners 7.1 1.4 0.8 2.5 0.7 -0.9 -1.2 0 0.0
Luke Putkonen Tigers 29.2 13.6 0.8 12.3 1.6 12.3 1.0 11 2.2
Jimmy Nelson Brewers 10 3.5 0.8 4.5 0.0 2.8 1.1 1 0.8
Jake Petricka White Sox 19.1 8.6 0.8 10.3 -1.2 60.2 -355.1 7 1.5
Charles Brewer Diamondbacks 6 1.7 0.7 2.7 0.0 3.6 -1.1 2 0.6
Wei-Yin Chen Orioles 137 66.4 0.7 68.1 -2.7 69.4 -8.5 62 1.6
Jeremy Jeffress Blue Jays 10.1 4.3 0.6 3.0 1.1 20.3 -67.9 1 0.8
Joel Peralta Rays 71.1 31.5 0.6 36.5 -2.6 9.3 6.6 31 2.0
Yoervis Medina Mariners 68 31.5 0.6 31.4 0.9 22.6 5.9 22 6.7
Ross Detwiler Nationals 71.1 31.3 0.6 36.4 -4.7 42.9 -14.2 37 -4.3
Jon Niese Mets 143 61.4 0.6 65.9 -1.3 97.6 -50.0 68 -1.6
Ernesto Frieri Angels 68.2 30.7 0.6 28.8 3.5 29.1 1.8 29 2.6
Donnie Joseph Royals 5.2 1.8 0.6 2.8 -0.1 1.8 0.5 0 0.0
Luis Perez Blue Jays 5 1.1 0.6 1.6 0.5 1.0 0.6 3 -0.9
Cesar Ramos Rays 67.1 29.9 0.6 32.5 -0.3 25.8 3.9 31 0.3
Carlos Villanueva Cubs 128.2 59.6 0.6 61.3 -3.1 55.6 2.3 58 1.7
Joe Martinez Indians 5 1.1 0.6 2.3 0.1 54.4 -1259.6 1 0.6
Jon Rauch Marlins 16.2 6.9 0.6 8.3 -0.9 10.3 -3.8 14 -11.3
Matt Shoemaker Angels 5 1.4 0.6 2.0 0.3 -0.1 -0.1 0 0.0
Erik Davis Nationals 8.2 0.6 0.5 1.5 0.9 3.8 0.1 3 0.8
Evan Reed Tigers 23.1 10.8 0.5 11.0 0.1 13.5 -3.8 16 -7.6
Michael Kirkman Rangers 22 10.6 0.5 11.7 -1.4 9.3 0.6 20 -19.1
Heath Hembree Giants 7.2 0.6 0.5 1.5 0.8 0.2 0.2 0 0.0
Dellin Betances Yankees 5 1.7 0.5 0.8 0.5 5.1 -6.3 6 -9.5
Mauricio Robles Phillies 4.2 1.3 0.5 2.3 -0.3 3.4 -2.1 3 -1.2
Phillippe Aumont Phillies 19.1 8.3 0.5 10.4 -2.0 14.0 -8.5 11 -2.5
Matt Daley Yankees 6 0.6 0.5 1.3 0.7 -0.3 -0.3 0 0.0
Steven Wright Red Sox 13.1 6.1 0.5 8.4 -2.7 6.4 -0.4 8 -2.3
Tony Cingrani Reds 104.2 47.5 0.5 43.8 3.1 36.4 8.4 37 8.8
Chad Jenkins Blue Jays 33.1 15.8 0.5 17.0 -1.2 13.7 1.2 13 2.1
Kevin Gausman Orioles 47.2 22.8 0.5 17.4 4.0 25.3 -4.5 30 -10.7
Chris Capuano Dodgers 105.2 45.0 0.5 46.5 1.4 55.4 -9.0 57 -9.2
Matt Thornton – – – 43.1 21.0 0.4 21.5 -0.9 21.3 -1.9 20 0.1
Steven Ames Marlins 4 1.2 0.4 1.6 0.2 10.0 -45.4 2 -0.2
Cesar Cabral Yankees 3.2 0.6 0.4 0.8 0.4 1.2 0.3 1 0.4
Neftali Feliz Rangers 4.2 1.8 0.4 3.0 -1.0 2.3 -0.2 0 0.0
Jair Jurrjens Orioles 7.1 3.2 0.4 3.9 -0.5 26.1 -180.0 4 -0.7
Frank Francisco Mets 6.1 2.3 0.4 3.3 -0.5 2.0 0.6 3 -0.1
Chris Dwyer Royals 3 1.0 0.3 1.5 0.0 0.4 0.3 0 0.0
J.J. Putz Diamondbacks 34.1 15.8 0.3 14.0 1.4 18.5 -3.6 9 3.9
Mickey Storey Blue Jays 4 0.4 0.3 1.5 0.3 13.6 -89.1 3 -1.8
Tim Stauffer Padres 69.2 29.7 0.3 26.8 4.0 24.3 5.5 29 3.0
Luis Ayala – – – 33 14.6 0.3 14.9 0.0 16.6 -2.0 12 2.6
Donnie Veal White Sox 29.1 14.2 0.3 13.4 0.5 13.1 0.1 16 -2.8
Vic Black – – – 17 7.1 0.3 9.6 -2.4 8.0 -0.4 7 0.8
Cody Eppley Yankees 1.2 0.4 0.2 0.4 0.2 2.0 -3.3 4 -16.7
Cristhian Martinez Braves 2.1 0.9 0.2 1.0 0.0 2.1 -2.2 2 -1.7
Chris Withrow Dodgers 34.2 14.9 0.1 12.6 2.5 7.5 3.9 10 3.8
Josh Tomlin Indians 2 0.7 0.1 1.6 -1.0 4.7 -19.6 0 0.0
Duke Welker Pirates 1.1 0.2 0.1 0.6 0.0 -0.5 -1.0 0 0.0
Fernando Salas Cardinals 28 12.2 0.1 15.0 -2.9 11.5 1.0 15 -2.3
David Murphy Rangers 1 0.1 0.1 0.3 0.1 0.5 0.0 0 0.0
Ryan Raburn Indians 1 0.1 0.1 0.1 0.1 -0.4 -0.8 0 0.0
Octavio Dotel Tigers 4.2 2.2 0.1 3.2 -1.3 6.8 -15.1 7 -15.6
Jamey Carroll Twins 1 0.4 0.1 0.5 -0.1 93.4 -19255.5 0 0.0
Jake Elmore Astros 1 0.4 0.1 0.5 -0.1 10.0 -210.6 0 0.0
Jose Dominguez Dodgers 8.1 3.5 0.1 5.3 -2.2 8.5 -10.8 3 0.7
Everett Teaford Royals 0.2 0.2 0.1 0.6 -0.5 0.3 0.0 0 0.0
Alex Burnett – – – 2.1 1.1 0.0 1.9 -1.4 3.3 -6.8 3 -5.3
Alberto Gonzalez Yankees 0.1 0.1 0.0 0.3 -0.2 -0.1 -0.3 0 0.0
Sam Fuld Rays 0.1 0.1 0.0 0.3 -0.2 2.4 -35.0 0 0.0
Josh Harrison Pirates 0.1 0.1 0.0 0.3 -0.3 18.5 -2269.2 0 0.0
Andrew Albers Twins 60 28.5 0.0 31.8 -3.5 25.2 1.8 34 -7.5
Brett Anderson Athletics 44.2 20.6 0.0 17.5 3.1 27.1 -9.4 32 -17.4
CC Sabathia Yankees 211 103.8 0.0 95.2 4.8 111.0 -18.4 122 -29.9
Darren Oliver Blue Jays 49 23.8 0.0 22.0 1.3 23.2 -1.1 24 -1.3
David Martinez Astros 11.1 5.3 0.0 6.6 -1.4 8.7 -6.0 11 -12.0
Duane Below Marlins 2.2 1.2 0.0 1.9 -1.0 3.0 -4.4 3 -4.3
Johnny Cueto Reds 60.2 27.7 0.0 23.5 3.3 1.0 0.9 20 5.8
Nick Tepesch Rangers 93 46.8 0.0 42.6 1.7 48.9 -8.0 53 -12.0
Rich Hill Indians 38.2 17.7 0.0 19.1 -0.8 19.0 -1.7 30 -20.1
Shawn Tolleson Dodgers 0 0.0 0.0 0.0 0.0 0.8 #DIV/0! 0 #DIV/0!
Travis Wood Cubs 200 93.4 0.0 108.0 -21.6 70.2 15.6 73 15.6
Logan Kensing Rockies 0.2 0.4 0.0 0.4 -0.1 0.3 0.0 0 0.0
C.C. Lee Indians 4.1 2.1 -0.1 3.2 -1.8 2.5 -0.8 3 -1.5
Brandon Gomes Rays 19.1 8.9 -0.1 7.4 1.5 8.6 0.1 15 -10.1
Evan Scribner Athletics 26.2 12.4 -0.1 14.4 -2.0 13.3 -1.4 13 -0.6
Phil Irwin Pirates 4.2 2.2 -0.2 2.5 -0.5 3.5 -2.3 5 -6.5
Pedro Beato Red Sox 10 5.1 -0.2 6.8 -2.9 5.0 -0.5 5 -0.4
Xavier Cedeno – – – 12.1 5.9 -0.2 7.6 -2.3 8.9 -5.3 12 -13.1
Chris Narveson Brewers 2 1.1 -0.2 1.4 -0.8 0.1 0.1 0 0.0
John McDonald Phillies 0.1 -0.1 -0.2 -0.1 -0.2 9.4 -572.8 0 0.0
Rob Johnson Cardinals 0.1 -0.1 -0.2 -0.1 -0.2 -0.1 -0.3 0 0.0
Rafael Dolis Cubs 5 2.6 -0.2 3.7 -2.4 1.2 0.6 2 0.3
Wesley Wright – – – 53.2 25.2 -0.3 21.4 3.4 28.3 -4.8 24 0.9
Jerry Blevins Athletics 60 27.9 -0.3 30.6 -2.1 92.8 -225.1 23 4.0
Ronald Belisario Dodgers 68 29.7 -0.3 31.3 -0.6 29.8 0.9 34 -2.6
Zach Putnam Cubs 3.1 1.8 -0.3 0.8 0.4 5.2 -12.9 7 -24.7
Shaun Marcum Mets 78.1 34.2 -0.3 39.7 -4.8 38.6 -3.5 48 -15.3
Zach Clark Orioles 1.2 1.1 -0.4 1.7 -2.1 2.1 -3.8 3 -8.6
Neil Wagner Blue Jays 38 18.8 -0.4 16.1 1.8 18.8 -1.9 17 0.6
Joe Savery Phillies 20 9.5 -0.4 10.7 -2.0 127.3 -1669.2 11 -2.0
Phil Coke Tigers 38.1 19.0 -0.4 21.1 -3.4 20.2 -3.3 24 -8.4
Preston Guilmet Indians 5.1 2.8 -0.4 4.4 -3.3 4.5 -4.1 6 -8.5
Jake Odorizzi Rays 29.2 13.8 -0.4 15.4 -1.4 21.1 -12.3 13 0.7
Kevin Slowey Marlins 92 42.1 -0.4 44.3 -3.1 53.2 -14.9 44 -1.3
Manny Corpas Rockies 41.2 22.0 -0.4 20.7 -2.1 18.7 0.1 21 -1.8
Joe Paterson Diamondbacks 2.1 1.5 -0.5 1.8 -1.2 20.1 -363.3 1 0.1
Tyler Lyons Cardinals 53 23.7 -0.5 24.4 -0.5 25.0 -1.2 29 -5.2
Sean Burnett Angels 9.2 4.9 -0.5 4.1 0.4 3.9 0.4 1 0.8
Jaime Garcia Cardinals 55.1 24.7 -0.5 21.7 2.8 58.6 -79.1 26 -0.3
Preston Claiborne Yankees 50.1 25.0 -0.5 23.4 0.5 22.5 0.2 23 0.4
Sandy Rosario Giants 41.2 18.3 -0.5 22.9 -5.0 13.4 3.8 15 3.4
Ryan Brasier Angels 9 4.6 -0.6 4.9 -0.6 3.2 0.7 2 1.0
Javy Guerra Dodgers 10.2 5.1 -0.6 5.2 -0.4 7.0 -3.2 9 -7.4
Miles Mikolas Padres 1.2 1.1 -0.6 1.6 -1.8 0.2 0.1 0 0.0
Edward Mujica Cardinals 64.2 28.8 -0.6 27.4 1.6 22.5 5.1 20 6.7
Arquimedes Caminero Marlins 13 6.4 -0.6 6.8 -1.0 4.0 1.3 4 1.4
Daniel Bard Red Sox 1 0.8 -0.6 1.0 -1.1 1.0 -1.1 1 -1.2
Marco Estrada Brewers 128 59.3 -0.6 55.8 2.2 47.6 8.4 56 3.2
John Gast Cardinals 12.1 5.9 -0.6 6.4 -0.9 78.2 -1020.0 7 -1.6
Brad Hand Marlins 20.2 10.0 -0.6 10.4 -1.3 5.0 2.3 7 1.9
Jeff Beliveau Rays 0.2 0.6 -0.6 0.8 -1.1 24.4 -1953.9 0 0.0
Chris Bootcheck Yankees 1 0.8 -0.6 1.0 -1.1 1.5 -3.6 1 -1.2
Chris Hatcher Marlins 8.2 4.5 -0.6 4.7 -1.0 7.7 -7.4 13 -29.0
Martin Perez Rangers 124.1 63.1 -0.6 60.3 -1.2 60.6 -4.9 55 2.6
Tyler Clippard Nationals 71 32.5 -0.7 34.3 -2.4 12.8 7.7 19 8.1
Josh Zeid Astros 27.2 13.7 -0.7 12.6 0.5 10.9 1.4 12 0.8
Jered Weaver Angels 154.1 70.7 -0.7 79.8 -7.2 9.2 8.0 58 11.1
Alberto Cabrera Cubs 6 3.4 -0.7 4.4 -2.7 5.6 -5.9 3 -0.2
Mike Pelfrey Twins 152.2 73.1 -0.7 83.2 -11.6 92.1 -31.1 92 -27.4
Chris Volstad Rockies 8.1 5.0 -0.7 5.5 -2.6 11.8 -25.5 10 -15.8
Shelby Miller Cardinals 173.1 76.3 -0.8 77.6 0.8 68.8 8.2 65 12.5
Logan Ondrusek Reds 55 26.0 -0.8 22.7 2.0 25.3 -0.5 26 -0.5
Matt Guerrier – – – 42.2 19.6 -0.8 22.7 -4.1 20.1 -0.9 22 -2.4
Scott Atchison Mets 45.1 20.4 -0.8 21.9 -1.5 16.7 3.1 27 -7.6
Josh Lindblom Rangers 31.1 16.6 -0.8 16.9 -2.2 56.7 -170.8 19 -5.8
Simon Castro White Sox 6.2 4.0 -0.8 3.9 -0.9 2.8 0.2 2 0.7
Clay Rapada Indians 2 1.5 -0.8 1.9 -2.0 0.6 0.2 0 0.0
Scott Feldman – – – 181.2 87.9 -0.9 86.3 -1.7 71.5 9.2 87 -2.7
Santiago Casilla Giants 50 22.0 -0.9 25.4 -3.3 14.9 5.1 14 5.6
Brian Omogrosso White Sox 16.1 8.9 -0.9 9.2 -1.7 18.1 -26.4 18 -24.7
Sean O’Sullivan Padres 25 11.7 -0.9 16.9 -8.5 16.4 -7.4 12 -0.4
Kevin Chapman Astros 20.1 10.4 -0.9 12.3 -3.3 5.6 2.2 6 2.2
Wilmer Font Rangers 1.1 1.2 -1.0 1.9 -3.6 0.8 -0.3 0 0.0
Wade Miley Diamondbacks 202.2 96.8 -1.0 91.7 0.0 94.4 -3.1 88 5.7
David Holmberg Diamondbacks 3.2 2.4 -1.0 3.7 -4.7 3.7 -4.5 3 -2.3
Eric O’Flaherty Braves 18 8.9 -1.0 8.2 -0.1 3.5 2.0 5 2.0
Mark Buehrle Blue Jays 203.2 100.2 -1.0 100.0 -3.0 105.4 -15.5 100 -5.7
Ryan Reid Pirates 11 5.7 -1.0 5.6 -0.7 3.9 0.8 2 1.2
Samuel Deduno Twins 108 52.4 -1.0 52.6 -1.1 21.3 12.0 48 2.1
Vidal Nuno Yankees 20 10.8 -1.1 12.8 -4.3 7.5 1.3 5 2.3
Victor Marte Cardinals 3 2.1 -1.2 2.2 -1.4 2.4 -1.9 2 -0.9
Michael Stutes Phillies 17.2 9.1 -1.2 11.5 -5.0 19.1 -26.7 11 -3.7
Bruce Chen Royals 121 59.8 -1.2 71.6 -17.2 45.7 7.4 46 8.3
Tom Gorzelanny Brewers 85.1 40.3 -1.2 37.3 1.1 37.1 1.3 41 -1.4
Steve Johnson Orioles 15.2 8.7 -1.2 8.6 -1.3 22.8 -50.5 13 -10.2
Heath Bell Diamondbacks 65.2 32.3 -1.3 24.3 4.4 38.5 -11.5 30 0.5
Skip Schumaker Dodgers 2 1.6 -1.3 1.9 -2.1 2.4 -3.9 0 0.0
Zach Phillips Marlins 1.2 1.5 -1.3 1.8 -2.4 2.2 -4.3 1 -0.3
Greg Burke Mets 31.2 14.9 -1.3 15.0 -0.8 22.7 -13.4 27 -22.6
Justin De Fratus Phillies 46.2 22.5 -1.3 24.4 -3.9 23.8 -3.1 21 0.7
David Purcey White Sox 25.1 13.7 -1.4 15.7 -4.7 10.0 1.3 7 2.8
Franklin Morales Red Sox 25.1 13.8 -1.4 15.1 -3.8 13.3 -2.2 13 -1.4
Chad Billingsley Dodgers 12 6.3 -1.4 6.7 -1.6 5.9 -0.6 4 1.1
Chaz Roe Diamondbacks 22.1 11.8 -1.4 9.9 0.2 9.0 0.9 10 0.4
Hector Noesi Mariners 27.1 14.3 -1.4 15.5 -3.0 22.0 -17.3 21 -13.7
Pedro Feliciano Mets 11.1 6.1 -1.5 6.5 -1.7 5.9 -0.9 5 0.3
Brandon Beachy Braves 30 14.7 -1.5 13.0 0.5 11.7 1.5 17 -3.7
Kevin Gregg Cubs 62 30.5 -1.5 32.6 -5.2 26.9 1.0 26 2.5
Enny Romero Rays 4.2 3.1 -1.5 3.8 -2.7 0.4 0.3 0 0.0
Blake Wood Indians 1.1 1.3 -1.6 1.5 -2.0 1.2 -1.3 0 0.0
Matt Harrison Rangers 10.2 6.7 -1.6 5.2 -0.1 8.6 -6.7 11 -13.4
Carlos Carrasco Indians 46.2 23.0 -1.6 24.2 -2.2 33.0 -18.6 36 -23.8
Gavin Floyd White Sox 24.1 13.5 -1.6 10.5 0.9 16.8 -8.9 15 -4.9
Cesar Jimenez Phillies 17 9.1 -1.6 11.5 -5.7 7.8 -0.1 7 0.8
Brandon Lyon Mets 34.1 16.4 -1.6 18.5 -3.5 21.0 -7.4 20 -5.1
Josh Edgin Mets 28.2 13.8 -1.7 16.5 -4.4 29.5 -37.8 12 1.2
Alfredo Simon Reds 87.2 41.7 -1.7 44.4 -5.3 28.1 8.1 31 7.4
Yovani Gallardo Brewers 180.2 84.3 -1.7 81.1 0.8 85.3 -4.0 92 -8.9
Zach Duke – – – 31.1 15.8 -1.7 16.4 -2.6 17.7 -4.5 23 -13.4
Aaron Crow Royals 48 25.0 -1.7 22.7 0.2 25.6 -4.7 19 2.8
Chang-Yong Lim Cubs 5 3.5 -1.8 3.8 -2.7 4.9 -5.8 3 -0.9
Robbie Erlin Padres 54.2 25.1 -1.8 26.1 -1.6 23.1 1.5 26 -0.6
Dale Thayer Padres 65 29.6 -1.8 27.7 1.7 26.5 2.5 25 4.3
Jose Cisnero Astros 43.2 22.2 -1.8 22.6 -2.0 25.8 -8.0 23 -3.1
Josh Lueke Rays 21.1 11.2 -1.8 11.7 -1.8 17.4 -13.9 12 -2.5
Jeanmar Gomez Pirates 80.2 37.3 -1.9 38.2 -1.9 12.7 8.3 35 2.3
Jared Hughes Pirates 32 15.8 -1.9 16.6 -2.5 26.4 -22.0 17 -2.4
Kyle Farnsworth – – – 38.1 19.0 -1.9 17.2 0.9 21.6 -5.3 20 -2.5
James McDonald Pirates 29.2 14.7 -1.9 19.2 -8.4 66.7 -265.7 24 -17.8
Jeff Francis Rockies 70.1 38.3 -1.9 32.2 -0.3 1.0 1.0 54 -35.3
Michael Bowden Cubs 37.2 19.4 -1.9 22.8 -7.7 20.5 -4.3 18 -0.5
Jairo Asencio Orioles 2.1 2.2 -2.0 0.9 0.1 5.6 -24.5 2 -1.7
Wade Davis Royals 135.1 67.9 -2.0 67.4 -3.4 89.9 -42.4 89 -37.0
Ross Ohlendorf Nationals 60.1 29.2 -2.0 28.7 -1.4 25.0 2.0 22 4.7
Ross Wolf Rangers 47.2 26.0 -2.1 25.3 -3.0 28.1 -8.5 24 -2.0
Matt Langwell – – – 14 8.2 -2.1 7.7 -1.6 8.0 -2.2 8 -1.8
Cory Burns Rangers 11.1 7.4 -2.1 9.4 -7.0 6.1 -1.2 4 1.0
Alexi Ogando Rangers 104.1 54.6 -2.2 58.1 -9.9 42.6 4.0 38 8.2
Justin Germano Blue Jays 2 2.1 -2.3 1.0 0.0 4.1 -14.5 2 -2.3
Eduardo Sanchez Cubs 6.1 4.5 -2.3 4.6 -2.7 3.5 -0.8 4 -1.4
Chia-Jen Lo Astros 19.1 11.0 -2.3 11.3 -2.6 7.2 1.2 9 0.0
Troy Patton Orioles 56 29.7 -2.4 27.6 -0.8 28.1 -3.2 25 1.0
Hisanori Takahashi Cubs 3 2.7 -2.4 1.8 -0.5 2.2 -1.4 2 -0.9
Adam Warren Yankees 77 39.9 -2.4 36.8 0.0 41.8 -8.5 29 5.5
Jose Ortega Tigers 11.2 7.5 -2.4 6.4 -0.9 33.7 -181.5 5 0.4
Casper Wells – – – 1.2 1.8 -2.4 2.1 -3.8 2.4 -5.1 5 -27.3
Andrew Bailey Red Sox 28.2 16.4 -2.5 11.0 2.1 14.3 -1.5 12 1.2
Brad Brach Padres 31 15.4 -2.5 16.5 -3.0 20.8 -10.1 15 -0.6
Brooks Raley Cubs 14 8.5 -2.5 6.8 -0.5 7.6 -1.5 9 -3.5
Zac Rosscup Cubs 6.2 4.8 -2.7 5.1 -3.5 2.5 0.4 1 0.7
Brad Boxberger Padres 22 11.6 -2.7 10.4 -0.5 11.2 -1.5 9 1.1
David Huff – – – 37.2 20.8 -2.7 16.3 1.5 16.4 0.6 23 -7.2
Jorge De Leon Astros 10 6.7 -2.7 7.6 -4.4 76.9 -1235.0 7 -3.6
Cory Gearrin Braves 31 16.1 -2.7 16.4 -3.0 16.3 -2.7 13 1.3
Jose De La Torre Red Sox 11.1 7.6 -2.7 6.1 -0.9 5.6 -0.5 8 -4.2
Rubby de la Rosa Red Sox 11.1 7.6 -2.7 7.1 -2.3 8.8 -6.4 7 -2.3
J.A. Happ Blue Jays 92.2 47.9 -2.9 53.6 -11.3 49.3 -8.8 53 -12.3
Maikel Cleto Cardinals 2.1 2.3 -2.9 1.1 0.0 4.1 -11.6 5 -18.1
Tyler Robertson Twins 1 1.4 -2.9 0.0 0.0 1.1 -1.6 1 -1.2
Raul Valdes Phillies 35 18.4 -3.0 15.7 0.2 24.8 -14.2 29 -22.7
Rob Scahill Rockies 33.1 19.9 -3.0 17.5 -2.8 22.5 -11.1 19 -4.3
Clayton Mortensen Red Sox 30.1 17.6 -3.0 18.3 -4.9 16.9 -4.0 19 -6.6
Thad Weber – – – 15 9.1 -3.1 7.8 -0.9 7.2 -0.4 5 1.4
Hideki Okajima Athletics 4 3.5 -3.1 2.8 -1.2 3.9 -4.4 1 0.5
Yordano Ventura Royals 15.1 9.8 -3.1 7.9 -0.6 6.7 0.2 6 0.9
Tom Layne Padres 8.2 5.8 -3.3 5.2 -1.8 17.4 -60.4 4 0.0
Alex Colome Rays 16 9.7 -3.3 9.4 -2.2 8.3 -1.3 8 -0.6
Jarred Cosart Astros 60 31.3 -3.4 33.7 -6.1 19.4 5.5 15 6.9
Edgmer Escalona Rockies 46 26.9 -3.5 24.7 -4.7 28.6 -10.7 32 -15.9
Josh Stinson Orioles 17 11.0 -3.5 7.6 0.5 34.1 -117.9 7 0.8
Jake Dunning Giants 25.1 13.6 -3.5 12.8 -1.5 11.3 0.1 8 2.6
Matt Moore Rays 150.1 71.3 -3.6 77.9 -7.0 59.9 7.0 58 9.8
David Hernandez Diamondbacks 62.1 32.6 -3.6 29.8 -1.8 25.8 2.2 33 -4.6
Todd Redmond Blue Jays 77 40.7 -3.7 38.4 -1.9 38.6 -4.3 38 -2.4
Chad Bettis Rockies 44.2 26.4 -3.7 25.1 -6.0 31.0 -16.6 34 -21.7
Dan Straily Athletics 152.1 74.0 -3.7 80.8 -8.9 61.7 6.3 74 -3.4
Hector Rondon Cubs 54.2 28.9 -3.8 29.0 -5.2 25.3 -0.7 29 -4.1
Ian Krol Nationals 27.1 15.4 -3.8 13.3 -1.1 14.2 -2.2 12 0.7
Anthony Bass Padres 42 21.4 -3.8 21.5 -2.8 26.4 -10.4 26 -8.7
Zach McAllister Indians 134.1 65.0 -3.9 73.0 -10.2 68.1 -8.5 65 -2.7
Derek Lowe Rangers 13 9.3 -3.9 6.6 -0.5 9.9 -6.8 13 -15.0
Zach Britton Orioles 40 23.0 -3.9 22.0 -3.5 27.1 -13.6 23 -5.5
Chance Ruffin Mariners 9.2 7.1 -3.9 3.9 0.6 10.1 -13.4 10 -12.3
Aaron Laffey – – – 12.2 8.4 -3.9 8.8 -4.4 12.5 -14.9 10 -7.0
James Russell Cubs 52.2 28.1 -3.9 30.1 -8.1 3.8 3.2 21 3.0
Jonathan Broxton Reds 30.2 17.2 -4.0 16.6 -3.3 13.7 0.2 17 -3.3
Kyle Drabek Blue Jays 2.1 2.8 -4.0 1.5 -0.6 3.5 -8.0 2 -1.7
Daisuke Matsuzaka Mets 38.2 20.0 -4.0 22.3 -6.2 17.1 0.4 21 -3.6
George Kontos Giants 55.1 27.1 -4.1 26.3 -1.3 30.3 -6.4 30 -5.0
Rhiner Cruz Astros 21.1 13.2 -4.1 15.7 -8.5 14.8 -8.0 9 0.8
Mark Lowe Angels 11.2 8.1 -4.2 9.2 -6.0 7.9 -3.9 12 -14.6
Jose Contreras Pirates 5 4.4 -4.3 3.3 -1.5 26.4 -283.4 5 -5.8
Nick Christiani Reds 4 3.9 -4.3 3.3 -2.7 1.8 0.0 1 0.5
Tim Lincecum Giants 197.2 88.7 -4.4 84.4 5.1 86.8 2.3 102 -11.3
Scott Baker Cubs 15 10.2 -4.6 9.9 -4.7 4.4 1.5 6 0.8
John Maine Marlins 7.1 5.9 -4.6 4.1 -1.0 44.4 -552.3 10 -19.4
Jeremy Affeldt Giants 33.2 17.9 -4.7 18.1 -3.4 60.8 -182.4 14 1.5
Nick Hagadone Indians 31.1 18.0 -4.7 17.6 -3.2 14.4 -0.3 21 -9.3
Pat Neshek Athletics 40.1 22.6 -4.7 23.5 -5.2 19.4 -1.3 17 1.6
John Axford – – – 65 33.9 -4.7 27.8 1.7 20.6 6.1 32 -1.9
Justin Grimm – – – 98 54.0 -4.9 49.6 -3.5 65.9 -32.3 70 -37.7
Chris Archer Rays 128.2 62.8 -5.0 60.4 0.6 47.8 8.4 49 8.8
Jonathan Pettibone Phillies 100.1 50.3 -5.0 51.8 -7.2 55.0 -11.8 50 -3.6
Brayan Villarreal – – – 4.1 4.9 -5.1 4.4 -3.8 8.6 -29.5 10 -39.7
Sam Dyson Marlins 11 8.1 -5.1 6.8 -2.5 52.0 -492.9 12 -16.2
Jeremy Horst Phillies 26 15.8 -5.2 16.4 -6.6 94.5 -666.3 19 -10.9
Kyle Kendrick Phillies 182 87.6 -5.3 90.6 -9.1 92.5 -11.7 104 -24.0
Tony Sipp Diamondbacks 37.2 22.1 -5.3 22.6 -7.4 21.8 -6.1 22 -5.7
Ramon Troncoso White Sox 30 19.0 -5.3 17.7 -4.2 16.2 -3.2 22 -12.7
Tyler Skaggs Diamondbacks 38.2 22.6 -5.4 18.3 -0.9 21.1 -4.4 23 -6.5
Kyle McClellan Rangers 9.1 8.0 -5.5 7.1 -4.4 5.5 -1.6 8 -6.8
Erik Johnson White Sox 27.2 17.9 -5.6 15.7 -3.0 17.9 -7.7 16 -3.9
Mike Leake Reds 192.1 93.2 -5.6 90.2 -3.6 85.2 1.5 78 9.9
Jon Garland Rockies 68 40.2 -5.6 37.0 -7.8 28.7 1.8 45 -19.1
Michael Kohn Angels 53 29.0 -5.8 31.2 -7.2 6.3 4.6 22 2.3
Zeke Spruill Diamondbacks 11.1 8.8 -5.8 6.6 -1.9 11.6 -14.8 11 -12.0
Shairon Martis Twins 9.2 8.0 -5.8 5.3 -0.7 4.5 -0.1 6 -2.0
John Lannan Phillies 74.1 39.0 -5.8 42.0 -10.5 81.3 -115.7 48 -18.7
Nick Maronde Angels 5.1 5.2 -5.9 4.3 -2.9 4.0 -2.7 6 -8.5
Josh Roenicke Twins 62 34.5 -5.9 39.4 -13.4 25.2 2.5 31 -2.4
Jason Vargas Angels 150 73.6 -5.9 77.2 -6.2 67.5 0.1 68 1.6
Scott Barnes Indians 8.2 7.2 -5.9 4.0 0.1 6.6 -4.5 7 -5.2
Joe Kelly Cardinals 124 59.7 -6.0 62.3 -6.9 101.0 -81.3 42 11.4
Chien-Ming Wang Blue Jays 27 17.6 -6.0 13.2 -0.4 23.1 -20.7 24 -21.9
Mike Adams Phillies 25 15.8 -6.1 11.4 -0.1 19.6 -14.3 11 0.6
Jeff Manship Rockies 30.2 20.6 -6.2 16.3 -2.9 71.5 -298.2 25 -18.9
Blake Beavan Mariners 39.2 23.8 -6.2 20.6 -1.9 22.9 -6.5 27 -12.6
Tyler Cloyd Phillies 60.1 32.5 -6.2 34.5 -9.3 48.5 -38.0 45 -27.3
Justin Freeman Reds 1 1.9 -6.2 0.9 -0.8 2.0 -6.6 2 -6.6
Chris Resop Athletics 18 12.5 -6.2 11.1 -3.2 13.8 -9.6 13 -7.2
Dallas Keuchel Astros 153.2 78.4 -6.3 66.0 6.6 95.4 -35.9 96 -33.1
Ted Lilly Dodgers 23 14.3 -6.3 13.6 -4.2 16.1 -8.9 16 -8.0
Josh Johnson Blue Jays 81.1 45.1 -6.3 34.9 3.5 -0.1 -0.1 64 -44.4
Hector Santiago White Sox 149 79.4 -6.4 83.1 -14.1 79.0 -13.9 69 0.2
Carter Capps Mariners 59 33.5 -6.4 25.2 2.5 41.4 -22.9 37 -13.0
Colt Hynes Padres 17 11.4 -6.4 10.3 -3.5 15.2 -14.9 17 -19.6
Stephen Fife Dodgers 58.1 30.5 -6.4 27.2 -0.8 35.4 -12.3 28 -0.9
P.J. Walters Twins 39.1 23.7 -6.4 24.6 -7.6 30.1 -20.9 30 -19.3
Jim Miller Yankees 1.1 2.4 -6.4 1.5 -2.0 29.5 -1416.8 3 -11.5
Charlie Leesman White Sox 15.1 11.7 -6.4 10.1 -3.8 20.3 -39.1 14 -13.5
Josh Wall Dodgers 7 6.2 -6.5 4.7 -2.2 0.2 0.2 14 -46.3
Sean Nolin Blue Jays 1.1 2.4 -6.5 1.5 -2.0 5.5 -44.2 6 -52.1
Barry Enright Angels 8.1 7.3 -6.5 5.9 -2.9 9.7 -15.3 12 -25.2
Daniel Stange Angels 1.2 2.7 -6.5 1.6 -1.6 2.2 -4.2 3 -8.6
Sean Henn Mets 2.2 3.4 -6.5 2.5 -2.6 2.9 -4.1 1 0.2
Chad Durbin Phillies 16 11.5 -6.7 8.5 -1.5 16.9 -22.6 17 -21.9
Luis Garcia Phillies 31.1 19.3 -6.7 18.5 -5.7 18.5 -5.8 15 -0.5
Jose Alvarez Tigers 38.2 24.1 -6.7 20.4 -2.2 7.5 4.3 26 -11.6
Trevor Cahill Diamondbacks 146.2 75.0 -6.7 72.3 -6.5 74.3 -9.2 70 -1.9
Tim Byrdak Mets 4.2 4.8 -6.8 3.2 -1.6 4.2 -4.2 4 -3.4
Jeurys Familia Mets 10.2 8.3 -6.8 7.0 -3.2 8.9 -7.7 5 0.0
Eury De la Rosa Diamondbacks 14.2 11.1 -6.8 6.8 -0.1 8.9 -3.1 13 -11.8
Kyle Lohse Brewers 198.2 97.3 -6.8 96.1 -6.7 81.9 7.0 78 12.1
Vinnie Pestano Indians 35.1 21.3 -6.8 19.2 -2.7 23.6 -11.3 18 -1.7
Chris Leroux Pirates 4 4.5 -6.9 3.1 -2.1 4.1 -5.3 3 -1.8
Josh Fields Astros 38 23.3 -7.0 19.2 -1.1 11.2 3.9 21 -4.0
Wandy Rodriguez Pirates 62.2 33.2 -7.0 30.1 -1.8 26.9 1.3 26 2.8
Josh Beckett Dodgers 43.1 24.2 -7.3 19.8 -0.2 19.1 0.5 30 -14.7
Brad Lincoln Blue Jays 31.2 20.8 -7.3 22.5 -11.0 18.8 -5.9 17 -2.6
Dan Haren Nationals 169.2 83.3 -7.5 74.7 2.2 86.3 -11.0 92 -15.4
Brett Marshall Yankees 12 10.3 -7.6 7.9 -3.0 9.2 -6.4 6 -0.5
Hiram Burgos Brewers 29.1 18.9 -7.7 19.0 -8.2 22.1 -14.7 23 -15.8
Collin McHugh – – – 26 18.0 -7.8 14.1 -2.8 26.3 -32.6 29 -40.6
Mike Zagurski – – – 6.1 6.3 -7.8 5.7 -5.6 8.9 -18.9 12 -37.0
Wade LeBlanc – – – 55 31.4 -7.9 33.1 -10.6 38.3 -20.9 40 -22.6
Phil Hughes Yankees 145.2 78.7 -7.9 76.7 -8.4 90.2 -33.7 91 -31.4
Greg Reynolds Reds 29.1 19.0 -8.0 18.1 -6.7 20.0 -10.3 19 -7.5
Zack Wheeler Mets 100 50.0 -8.0 50.5 -6.1 44.6 0.5 42 4.0
Jeff Locke Pirates 166.1 80.4 -8.0 83.6 -9.2 48.9 17.0 69 7.4
Edgar Olmos Marlins 5 5.6 -8.0 3.6 -2.1 5.2 -6.6 9 -25.9
Michael Gonzalez Brewers 50 29.2 -8.2 23.3 -0.7 24.1 -1.7 28 -5.8
Peter Moylan Dodgers 15.1 11.4 -8.2 10.8 -6.0 13.5 -12.8 11 -6.0
Miguel Gonzalez Orioles 171.1 91.5 -8.2 88.6 -8.0 3.6 3.4 81 -1.5
Zach Miner Phillies 28.2 18.7 -8.2 17.1 -5.5 19.9 -10.8 14 -0.7
Michael Blazek – – – 17.1 12.7 -8.3 12.1 -6.7 15.6 -15.6 12 -5.9
Jose Valverde Tigers 19.1 14.8 -8.3 9.5 -0.3 84.6 -736.6 12 -4.0
Chris Rusin Cubs 66.1 37.8 -8.3 35.5 -6.7 33.0 -3.4 30 0.8
Drew Pomeranz Rockies 21.2 16.8 -8.4 14.0 -6.0 19.0 -18.0 15 -7.4
Carlos Torres Mets 86.1 44.5 -8.5 36.3 2.5 35.6 3.1 34 5.2
Erik Bedard Astros 151 79.4 -8.7 83.5 -13.4 86.7 -23.6 83 -15.2
Chris Tillman Orioles 206.1 109.4 -8.8 96.1 1.9 94.6 -1.6 87 8.0
Tommy Hanson Angels 73 40.7 -9.0 42.3 -9.3 25.3 5.9 47 -18.2
Luis Mendoza Royals 94 53.6 -9.1 53.4 -10.1 60.4 -25.7 60 -22.5
Philip Humber Astros 54.2 32.9 -9.2 30.2 -4.8 45.8 -39.1 48 -42.7
Erasmo Ramirez Mariners 72.1 41.9 -9.2 37.0 -2.6 41.8 -11.7 44 -13.6
Ricky Romero Blue Jays 7.1 7.8 -9.3 5.9 -4.0 9.0 -15.5 9 -14.8
Jeremy Bonderman – – – 55 33.8 -9.5 34.1 -10.2 10.8 6.1 36 -14.7
Kyle Gibson Twins 51 31.6 -9.5 29.2 -5.8 39.2 -27.6 38 -23.0
Tom Koehler Marlins 143 73.3 -9.5 73.4 -10.3 72.9 -9.4 72 -6.1
Matt Cain Giants 184.1 86.9 -9.6 85.8 -2.6 71.8 9.8 85 0.6
Jake Arrieta – – – 75.1 43.8 -9.6 41.7 -8.3 2.2 2.1 41 -7.0
Tommy Milone Athletics 156.1 80.7 -9.7 77.9 -3.9 76.2 -6.2 83 -11.9
Anthony Recker Mets 1 2.3 -9.9 1.4 -2.9 1.5 -3.5 2 -6.6
Brian Flynn Marlins 18 13.9 -9.9 10.5 -3.0 19.1 -26.0 17 -17.6
Henry Rodriguez – – – 22 16.2 -10.0 16.7 -11.3 13.6 -5.0 12 -2.1
Pedro Figueroa Athletics 3 4.6 -10.5 1.9 -0.7 5.5 -17.2 4 -7.5
Dillon Gee Mets 199 95.5 -10.5 97.2 -7.8 96.8 -7.6 84 7.7
Jeremy Hellickson Rays 174 88.1 -10.6 86.7 -4.3 65.4 10.9 103 -28.3
Jacob Turner Marlins 118 62.7 -10.7 66.7 -16.7 11.7 9.1 55 -0.2
Kevin Correia Twins 185.1 97.9 -10.8 94.3 -6.6 106.3 -28.9 89 -3.0
Joba Chamberlain Yankees 42 28.4 -10.8 23.2 -3.7 16.1 2.4 23 -4.1
Hector Ambriz Astros 36.1 24.7 -10.9 19.3 -2.1 29.1 -22.6 28 -18.5
Chris Perez Indians 54 32.9 -10.9 24.8 0.7 34.5 -14.4 27 -2.1
Paul Maholm Braves 153 77.8 -10.9 71.4 -2.1 84.0 -18.2 82 -12.6
Carlos Marmol – – – 49 30.5 -11.3 26.6 -5.6 28.5 -8.3 26 -3.7
Guillermo Moscoso Giants 30 20.0 -11.4 20.4 -10.4 14.2 -0.7 17 -3.7
Liam Hendriks Twins 47.1 30.9 -11.4 27.1 -5.4 38.0 -29.5 39 -30.2
David Aardsma Mets 39.2 25.1 -11.5 22.0 -5.1 21.3 -4.0 20 -1.7
Brandon League Dodgers 54.1 32.1 -11.9 26.5 -2.1 34.6 -14.2 37 -17.3
Brandon Morrow Blue Jays 54.1 35.3 -12.0 29.3 -3.8 38.0 -21.0 39 -21.3
Mike Kickham Giants 28.1 19.5 -12.1 11.3 1.4 28.5 -35.2 34 -53.8
Trevor Bauer Indians 17 14.4 -12.1 13.5 -8.9 12.7 -8.3 11 -4.3
Alfredo Figaro Brewers 74 43.2 -12.1 32.3 1.0 36.6 -3.5 41 -7.9
Wily Peralta Brewers 183.1 94.6 -12.3 90.9 -9.1 89.2 -7.1 107 -27.5
Huston Street Padres 56.2 33.5 -12.4 27.2 -1.6 21.6 3.4 17 6.0
Jordan Lyles Astros 141.2 77.7 -12.4 75.0 -8.2 73.3 -10.8 98 -48.0
Ryan Dempster Red Sox 171.1 96.2 -12.5 86.6 -5.2 98.2 -26.6 97 -21.2
Burch Smith Padres 36.1 23.8 -12.6 17.8 -1.6 27.3 -18.2 26 -14.1
Brandon Maurer Mariners 90 52.9 -12.7 45.9 -3.2 65.8 -40.9 66 -38.2
Donovan Hand Brewers 68.1 41.1 -12.7 37.5 -7.9 37.2 -7.7 29 2.5
Vance Worley Twins 48.2 32.3 -12.9 27.8 -5.6 47.5 -55.4 43 -38.8
Bryan Morris Pirates 65 38.1 -13.0 33.9 -5.1 26.8 2.3 25 4.3
Cory Rasmus – – – 21.2 17.2 -13.0 13.5 -4.5 16.4 -11.2 15 -7.4
Esmil Rogers Blue Jays 137.2 78.1 -13.3 67.1 -1.3 81.2 -25.0 76 -14.3
Ethan Martin Phillies 40 27.1 -13.3 21.7 -4.6 28.2 -15.8 27 -12.2
Ramon Ramirez Giants 5.2 7.0 -13.4 5.3 -5.9 7.5 -14.6 8 -16.3
Brad Peacock Astros 83.1 49.8 -13.4 44.4 -5.3 47.7 -12.8 51 -16.2
Allen Webster Red Sox 30.1 23.7 -13.5 18.9 -5.7 25.3 -21.6 30 -33.9
Billy Buckner Angels 17.1 15.3 -14.3 11.6 -4.8 11.9 -6.2 9 -1.1
Deunte Heath White Sox 7.2 9.5 -14.4 8.2 -10.2 8.7 -13.3 10 -18.1
Jarrod Parker Athletics 197 104.0 -14.6 104.3 -11.5 22.7 16.9 92 -0.5
Alfredo Aceves Red Sox 37 28.2 -14.9 22.2 -5.8 29.3 -22.1 21 -4.7
Nate Karns Nationals 12 12.1 -15.0 6.6 -1.4 13.0 -18.2 11 -10.7
Pedro Hernandez Twins 56.2 37.7 -15.1 35.2 -10.5 47.8 -41.5 43 -27.3
Onelki Garcia Dodgers 1.1 3.2 -15.2 1.9 -3.9 2.6 -8.5 2 -4.5
Edgar Gonzalez – – – 18 16.5 -15.2 11.8 -4.4 17.7 -21.0 16 -14.6
Edinson Volquez – – – 170.1 86.7 -15.6 83.2 -6.7 105.8 -39.8 114 -50.3
Eric Surkamp Giants 2.2 4.8 -15.7 3.2 -5.2 7.1 -35.3 7 -32.6
Shawn Camp Cubs 23 19.5 -15.8 13.6 -4.2 21.5 -23.0 18 -12.3
J.C. Ramirez Phillies 24 19.7 -16.0 15.8 -7.2 24.0 -29.1 22 -21.4
R.A. Dickey Blue Jays 224.2 123.5 -16.1 114.0 -8.0 107.4 -6.4 113 -9.4
Andre Rienzo White Sox 56 39.3 -16.5 32.0 -6.4 34.0 -11.7 34 -10.4
Joel Hanrahan Red Sox 7.1 9.9 -16.9 5.9 -4.2 16.8 -68.5 8 -10.8
Mike Fiers Brewers 22.1 19.2 -16.9 11.8 -2.0 35.1 -86.9 20 -18.6
Cole DeVries Twins 15 15.2 -17.2 11.3 -6.4 17.6 -28.2 18 -28.5
Yunesky Maya Nationals 0.1 1.7 -17.3 0.3 -0.3 1.9 -22.9 2 -23.8
Jason Hammel Orioles 139.1 82.4 -17.3 76.2 -11.4 14.4 11.1 81 -20.4
Jake Westbrook Cardinals 116.2 64.7 -17.5 69.3 -22.2 8.7 7.3 69 -18.9
Travis Blackley – – – 50.1 35.8 -17.6 25.4 -1.5 26.8 -4.8 27 -4.2
Jeremy Hefner Mets 130.2 70.4 -17.6 63.5 -5.1 118.9 -120.9 75 -17.7
Ramon Ortiz Blue Jays 25.1 22.6 -18.7 18.2 -9.3 21.9 -20.1 17 -7.6
Randall Delgado Diamondbacks 116.1 69.7 -18.8 55.0 -2.8 59.7 -8.2 59 -5.4
Aaron Harang – – – 143.1 82.4 -18.9 75.3 -8.3 82.9 -23.4 91 -33.4
Pedro Villarreal Reds 5.2 8.4 -19.1 4.2 -2.6 10.4 -32.0 8 -16.3
Roberto Hernandez Rays 151 83.9 -19.3 65.2 5.9 82.9 -17.9 87 -20.9
John Danks White Sox 138.1 84.0 -19.3 67.7 -2.0 37.5 15.0 81 -21.1
Mitchell Boggs – – – 23.1 20.8 -19.3 16.1 -8.5 20.3 -18.9 23 -25.8
Freddy Garcia – – – 80.1 52.9 -19.6 38.6 -0.8 42.0 -6.6 40 -2.9
Bronson Arroyo Reds 202 108.8 -19.6 96.2 -4.8 91.9 -0.8 88 5.5
Jerome Williams Angels 169.1 93.5 -19.6 86.2 -6.0 3.4 3.2 93 -17.0
A.J. Griffin Athletics 200 109.2 -19.7 100.3 -5.0 80.6 8.6 91 1.9
Joe Saunders Mariners 183 103.7 -19.7 92.9 -6.5 1.6 1.6 117 -44.1
Michael Belfiore Orioles 1.1 4.0 -20.0 1.3 -1.5 10.8 -181.4 2 -4.5
Ian Kennedy – – – 181.1 99.9 -21.0 91.2 -10.0 102.9 -26.6 108 -30.5
Alex Sanabia Marlins 55.1 38.8 -21.4 35.2 -14.4 43.2 -31.6 33 -9.4
Johnny Hellweg Brewers 30.2 26.0 -22.3 25.1 -20.3 17.6 -4.8 30 -33.2
Paul Clemens Astros 73.1 50.1 -22.5 44.6 -12.5 49.5 -24.6 48 -19.6
Jeremy Guthrie Royals 211.2 121.7 -23.1 115.6 -17.3 33.9 21.9 99 -0.7
Matt Magill Dodgers 27.2 23.7 -23.4 20.1 -12.2 21.9 -16.6 25 -23.6
Ryan Vogelsong Giants 103.2 61.1 -23.8 56.0 -11.2 68.4 -31.7 73 -37.7
Scott Diamond Twins 131 81.6 -25.3 74.0 -14.1 85.4 -37.9 88 -39.3
Jonathan Sanchez Pirates 13.2 15.9 -26.4 8.1 -2.6 21.9 -56.1 18 -33.0
Dylan Axelrod White Sox 128.1 83.8 -26.8 75.6 -18.1 96.2 -63.7 89 -43.9
Brett Myers Indians 21.1 22.3 -28.4 12.3 -2.6 20.7 -23.8 19 -17.4
David Carpenter Angels 0.1 2.2 -28.4 0.8 -2.9 2.7 -47.3 4 -99.3
Joe Blanton Angels 132.2 81.5 -28.5 61.1 1.8 28.9 14.9 96 -53.6
Roy Halladay Phillies 62 45.7 -28.8 37.9 -13.7 39.7 -16.7 48 -32.0
Dave Bush Blue Jays 3 7.5 -30.5 2.5 -1.9 5.8 -18.9 5 -12.9
Barry Zito Giants 133.1 78.7 -30.7 77.0 -21.5 97.2 -59.8 94 -48.7
Kameron Loe – – – 26.2 26.9 -31.5 15.0 -3.5 28.9 -40.4 21 -14.6
Curtis Partch Reds 23.1 24.7 -32.9 17.0 -10.5 17.4 -11.4 16 -7.6
Clayton Richard Padres 52.2 41.3 -34.3 29.5 -7.1 41.2 -30.3 44 -35.1
Robert Carson Mets 19.2 22.2 -35.9 13.7 -7.6 16.1 -13.2 19 -20.5
Lucas Harrell Astros 153.2 99.9 -38.0 91.6 -22.9 103.7 -51.4 111 -61.6
Jason Marquis Padres 117.2 79.8 -46.3 67.9 -19.0 85.4 -52.1 61 -7.1

There you have it. I have to say, I am surprised a little that the very best pitchers don’t even save their team 30 runs over the course of a season compared to an average pitcher – at least if you trust these numbers. Of course, on the other end, we have pitchers costing their team 50+ runs, but I suppose it’s easier to be bad than it is to be good.

Obviously, the more you pitch, the more these numbers can go up/down, so these shouldn’t be used to draw too many conclusions – I still think the plain old rate stats are better. But this certainly is valuable if you want to know exactly how many runs a pitcher can save. For the record, I would trust the FIP-based one the most, because it is defense-independent while still being descriptive, unlike xFIP; also, it is park- and league-adjusted unlike wRCRAA and RAA. The others obviously have their uses, though. This is not a predictive stat, because it can’t predict innings pitched, but I think it does a pretty good job being a descriptive one.


Grading 2013 AL SP Performance with Attention to the 2-D Direction of Batted Balls

Foreword

Two years ago, I began developing a system for evaluating the performance of minor-league pitchers relative to their minor-league level/league peers. My goals were to use only game data that could be extracted from the MLB Advanced Media Gameday archives for every level of the minors (ruling out any of the pitch-outcome data that is available for AA and AAA games), to ignore whether batted balls went for hits or home runs, and to ignore runs allowed. In brief, the challenge amounts to using whatever else information can be compiled from the game-specific dataset to arrive at the best approximation of the pitcher’s true performance, as judged independent of those factors which tend to fall outside their control (defense, park effects, etc.). What eventually follows are the results of applying the latest iteration of this “Fielding and Ballpark Independent Outcomes” method to 2013’s American League starting-biased pitchers.

Basic Steps of Applying the Method to a League

  1. Download the relevant details of every plate appearance (PA) from the league’s season into a spreadsheet/database
  2. Derive a 24-outs-baserunners-state run expectancy matrix à la Tango in The Book
  3. Quantify how each PA of the season impacted the inning’s run expectancy
  4. Exclude all bunts and foulouts, plus every PA taken by a pitcher
  5. Reweight the proportion of line drives (LD), outfielder fly balls (OFFB), ground balls (GB), and infielder flyballs (IFFB) by ballpark to offset any stadium- or stringer-related anomalies in play event classifications
  6. Referencing the run-expectancy value determined for each PA in Step 3, the corresponding basic description of the play (BB vs HBP vs K vs GB vs IFFB vs OFFB vs LD), and the 2 coordinates indicating where the batted ball was fielded (if there was one), quantify what each of the following 12 general PA event types were worth in terms of runs, on average, for the season: 1) walk or hit-by-pitch, 2) strikeout, 3) IFFB, 4) GB to batter’s pull-field-third of the diamond, 5) GB to batter’s center-field-third, 6) GB to batter’s opposite-field-third, 7) LD to pull-third, 8) LD to center-third, 9) LD to opposite-third, 10) OFFB to pull-third, 11) OFFB to center-third, and 12) OFFB to opposite-third.
  7. For each pitcher in the study sample, tally up the number of each of the 12 event types that they allowed and in each instance charge them with the exact number of runs determined in Step 6 for the corresponding event type; divide the resulting sum by the total number of events to arrive at a single number for each pitcher that quantifies how a PA against them that season should have affected the inning’s run expectancy, on average (the more negative this number the better the pitcher should have performed on the year)
  8. Quantify how high or low the pitcher rated on the value in Step 7 versus the mean of the sample on a standard deviation (SD) basis

What were the 12 Event Types Worth in 2013?

The table below shows how the studied event types impacted run expectancy in AL Parks during 2013, on average. The 2-D direction of the batted ball does tend to be rather consequential for LD and even more so for OFFB.

 photo 2013ALParksPAEventType-EffectofRunExpectancies2_zps4e1054de.jpg

So as far as Step 7 described above goes, each pitcher in what follows will be charged +0.29 runs for every BB and HBP, -0.26 runs for every K, … and -0.08 runs for every OFFB to the Opposite-Field-Third, with that sum ultimately divided by the total number of PA events to arrive at a single number that quantifies what an average PA against the pitcher in 2013 was worth in terms of runs (per run expectancies). Think of that as the equation being used to evaluate each pitcher’s performance.

Study Sample

The 101 pitchers who faced more than 200 batters as an American Leaguer in 2013 while averaging more than 10 batters faced per game. Data they accumulated as relievers is included in the analysis. Data they accumulated as National Leaguers is not. As before, any PA that resulted in a bunt or foulout or that was taken by a pitcher was excluded.

Scores Computed

The overall rating number described in Step 8 above is termed Performance Score. Steps 7 and 8 can be repeated with the non-batted-ball events (BB,HBP,K) stricken from the numerator and denominator at Step 7, and this result is termed Batted Ball Subscore (in short, how should the pitcher have rated versus their peers on batted balls?). To further understand how the pitcher achieved their Performance Score, a Control Subscore (how many SDs high or low was the pitcher’s BB+HBP% versus the study population’s mean?) and a Strikeout Subscore (how many SDs high or low was the pitcher’s K% ?) are computed. An Age Score is also calculated that quantifies how young the pitcher was versus the population’s mean age, per SDs. Given the method’s minor-league origins, the scores are typically expressed on a 20-to-80 style scouting scale where 50 is league-average, scores above 50 bettered league-average, and any 10 points equates to 1 SD (percentiles will be listed for those who prefer them).

2013 American League Starting Pitcher Results

In the tables to follow, green text indicates a value that beat league-average by at least 1 SD (“very good”) while red text indicates a value that trailed league-average by at least 1 SD. Asterisks indicate left-handed throwers.

Sorting by Performance Score

Here are the Top 33 2013 AL SP per the Performance Score measure. Scherzer edged Darvish for the #1 spot as the top of the list somewhat mimicked the BBWAA’s Cy Young vote.

 photo FG-2013ALSPScoresTop33_zps7510f67e.jpg

Detroit and Cleveland each landed five in the Top 33 while Boston, Oakland, and Tampa Bay each placed four. Perhaps not coincidentally, those clubs were also the playoff teams.

And below are the Middle 34 by Performance Score.

 photo FG-2013ALSPScoresMid34_zps31e63487.jpg

And below are the Bottom 34 by Performance Score.

 photo FG-2013ALSPScoresBot34_zps37b53dab.jpg

Pedro Hernandez took last place by a comfortable margin as five other Twins joined him on this dubious list of 34. To further corner the market on these sorts of arms, the club has since inked another of the 34 to a three-year free-agent contract.

Sorting by Batted Ball Subscore

Given the system’s unique weighting of batted-ball types by direction, let us examine how the pitchers grade out on this metric. Below are the Top 20 sorted by Batted Ball Subscore. Masterson nosed out Deduno for top honors. Here, the Twins fare better as three besides Deduno crack the Top 20.

 photo FG-2013ALSPBattedBallSubscoresTop20_zps83100793.jpg

 One unique angle of this approach is that a pitcher can be a relatively strong batted-balls performer without being a noteworthy groundball-inducer if their outfield flyballs, line drives, and groundballs are skewed optimally to the least dangerous zones of the field per the batter’s handedness. Colon serves as a prime example of such a pitcher.

Below are the laggards who comprise the Bottom 20.

 photo FG-2013ALSPBattedBallSubscores2Bot20_zps7c4024d0.jpg

Garza’s 29 number as an American Leaguer is somewhat scary for the sort of money he’s likely to command as a free agent (he’d earn about a 35 Batted Ball Subscore if the Cubs NL data were factored in). Salazar’s numbers show how a very high rate of strikeouts and good control can successfully offset a dangerous distribution of batted balls by type and direction.

Admittedly, there is a third dimension to each of these batted balls (launch angle off the bat relative to the plane of the field) that would stand to further improve the batted-balls assessment if such information were available.

Other Directions

A variety of things can be done with these numbers, such as breaking them down further into LHB values and RHB values, identifying comparable pitchers who share similar subscores (MLBers to MLBers, MiLBers to MLBers), studying how these values evolve as the minor leaguer rises through the farm towards the majors and their predictive value as to future MLB performance, and so on. And then there’s also the reverse analysis — evaluating hitter performance under a similar lens.

On Tap

Perhaps the most intriguing research question that application of this system raises is, “Would advanced metrics familiarly used to grade pitcher performance yield better results if their equations included batted-ball directional terms?” As a first attempt to test those waters, I plan to follow this up with a post that shows how these results compare to those obtained by variants of more familiar advanced statistical-evaluation methods (SIERA, FIP, etc.). In the interim, I welcome whatever comments, criticisms, and suggestions this readership has to offer.


What Makes a Good Pinch-Hitter?

There seems to be quite a bit of disagreement in FanGraphs-land over what skills make for a good pinch-hitter. Some will argue that power is more important while others might say that on-base skills are more important. And while I know that it’s fashionable for the author to make a stance at the start of his article, I’m not going comply. I’m just going to unsexily dive face-first into Retrosheet.

How can we solve this problem? How do we know what skills are best for pinch-hitters? Well, we can examine the base-out states that pinch-hitters confront and then derive from those base-out states specific pinch-hitter linear weights. We will then compare pinch-hitter linear weights to league-average linear weights to see which skills retain value. Simple.

We’re also going to split the data by league, since pinch-hitting tendencies in the National League are likely going to be different than American League tendencies. I’m going to use the last five years of data, because whim. The table below, then, includes league-average linear weights followed by NL and AL pinch-hitter linear weights (aside: the run values of linear weights are from 1999-2002, per Tango’s work. This won’t make a real difference in the results, however, since we’re examining relative value of different base-out states and not overall run-value of different events).

Relative Linear Weights, 2009-2013

Linear Weight HR 3B 2B 1B NIBB Out K
League Average 1.41 1.06 0.76 0.47 0.33 -0.300 -0.310
AL Pinch-Hitting 1.45 1.07 0.77 0.49 0.32 -0.305 -0.325
NL Pinch-Hitting 1.42 1.05 0.75 0.48 0.31 -0.290 -0.310

In the National League we can see that the value of home runs have increased slightly while walks have seen a corresponding decrease. This is because pinch-hitters often come to the plate when there are more outs than average. This sensibly decreases the value of walks and increases the importance of hurrying up and sending everyone around the bases already. This note comes with a caveat, however — the differences in linear weights are pretty small. It seems that managers in the National League are often forced to use the pinch-hitter to replace the pitcher, and therefore pinch-hitters are used in a lot of sub-optimal places.

The American league does not condone making everyone hit, however, and the impact upon pinch-hitting situations is pretty clear. The run value of home runs increases by .04 in pinch-hitting situations in the American League compared to the paltry .01 National League increase. In fact the run values of nearly all events increases — managers in the American League simply have more flexibility on when to use pinch-hitters and so they are able to deploy their pinch-hitters in base/out situations that are strategically favorable.

What does this all mean? Like everything, this simultaneously means quite a bit and not much at all. Home run value increases while walk value decreases during average pinch-hitter situations, but the change isn’t huge. If you’re a general manager looking for a bench bat and there’s a home-run guy available with a 90 wRC+ and a plate-discipline guy with a 95 wRC+, take the plate-discipline guy. What if they both have a 90 wRC+? Then take the home-run guy. The pinch-hitter linear weights here are more of a tie-breaker than a game-changer. Power is more important than walks when it comes to being a pinch-hitter, but being a good hitter is more important than power.

Roster construction is never that simple, though. Ideally a team will have both power and plate-discipline guys available on the bench and then the manager will be able to leverage both of their abilities based upon the base/out state (and also the score/inning situation, which is outside the scope of this article). Managers tend to be kind of strategic dunces, though, so I’m not sure if I see this happening. If I were in charge of anything I would supply my manager with a chart of base/out states that list the team’s best pinch-hitters in each situation. I’m not in charge, though, and even if I were I would probably be ignored.

I am in charge of this article, however, which means that I can bring it to a close. I’ll note that another valid way to do this study would be to create WPA-based weights rather than run-expectancy weights. There’s a lot more noise in WPA, but it could still create some interesting conclusions. I reckon the conclusion would be pretty much the same though — what makes a good pinch-hitter? Well, a good hitter makes for a good pinch-hitter. And a little power doesn’t hurt.


The Untold Story of Roberto Clemente’s Plane Crash Litigation

The Fatal Crash

Roberto Clemente was both a remarkable ballplayer and genuine folk hero. As an outfielder for the Pittsburgh Pirates, Clemente was a perennial All-Star and Gold Glove recipient. He won four batting titles, was the National League’s MVP in 1966 and the World Series MVP in 1971.

Roberto Clemente

On September 30, 1972, Clemente stroked a double off of Mets pitcher Jon Matlack to reach the 3000 hit milestone in his final regular season at bat. After closing out the 1972 season with a playoff series loss to the Cincinnati Reds, Clemente traveled to Nicaragua in November to manage the Puerto Rican All-Stars in the Amateur Baseball World Series.

A 6.2 magnitude earthquake rocked Managua, Nicaragua on December 23, 1972. Some 5,000 people lost their lives, another 20,000 were injured and over 250,000 were displaced from their homes. Swayed by the time he had just spent in Nicaragua, Clemente coordinated a extraordinary effort to provide emergency supplies to the victims. Even after sending three airplane loads to Managua, there were still supplies that needed to be flown to Nicaragua.

Clemente was approached by Arthur Rivera, who offered the services of his DC-7 cargo plane to airlift the remaining relief supplies. Clemente inspected the plane and agreed to pay Rivera $4000 (approximately $22,000 today) upon his return to Puerto Rico.

By law, Rivera was to provide a pilot, co-pilot and flight engineer. Rivera hired a pilot, Jerry Hill, and appointed himself as the co-pilot, despite his lack of certification to co-pilot the DC-7. He was unable to hire a flight engineer for the flight.

Unbeknownst to Clemente, the DC-7 had been involved in an accident on December 2, 1972 when a loss of hydraulic power caused the aircraft to leave the taxiway and crash into a water-filled concrete ditch. After the incident, an airworthiness inspector with the Federal Aviation Administration (F.A.A.) questioned Rivera about intended repairs to the plane. Mr. Rivera confirmed that he intended to repair the plane and the inspector took no further action.

Thereafter, the damaged propellers were replaced and the engines were run for three hours, showing no signs of malfunction. The airplane was returned to service by the repairmen; however, no inspection was conducted by the F.A.A. prior to the ill-fated flight. In fact, the plane had not even been flown since its arrival from Miami in September, 1972.

The loading of Rivera’s DC-7 was completed on December 31, 1972. Clemente decided to personally accompany this flight after having been advised that their prior shipments may not have reached the intended recipients due to governmental interference with the relief efforts.

The flight plan was filed with the F.A.A. on the morning of December 31st. At approximately 9:11 p.m., the flight taxied down Runway 7 and was cleared for takeoff at 9:20 p.m. The weather was good and visibility was at 10 miles.

Upon takeoff, the plane gained very little altitude and at 9:23 p.m. the tower received a message that the plane was turning back around. Unfortunately, the aircraft did not make it, crashing into the Atlantic Ocean about one and a half miles from shore. Everyone aboard the plane, including Roberto Clemente, perished in the crash. He was just 38 years old.

The post-occurrence investigation revealed that there was an engine failure before the crash and that the plane was nearly 4200 pounds over the maximum allowable gross takeoff weight.

Resulting Lawsuit

Vera Zabala Clemente and the next of kin of the other passengers filed a lawsuit against the United States of America alleging that the F.A.A. employees were negligent under the Federal Tort Claims Act and responsible for the resulting crash. (The Federal Tort Claims Act is a limited waiver of sovereign immunity that authorizes parties to sue the United States for tortious conduct.)

Factually, the plaintiffs’ claim was based on the premise that the F.A.A. owed a duty to promote flight safety which was breached by their failure to revoke the airworthiness certificate of the DC-7 after the December 2, 1972 accident; monitor the repair process; and, otherwise discover that the plane was not airworthy, had an improper registration number, was not properly weighted and balanced and did not have a qualified crew. It was the plaintiff’s contention that had the F.A.A. acted in accordance with their own internal procedures (Order SO8430.20C, “Continuous Surveillance of Large and Turbined Powered Aircraft”), the aircraft would have been denied flight clearance, the deceased passengers would have been advised of the deficiencies and that the plane crash would never have happened.

The United States countered that the F.A.A. did not have any legal duty towards the decedents to “discover or anticipate acts which might result in a violation of Federal Regulations.” They also claimed that there was no connection between any duty and the fatal crash.

Who won?

The trial court found for Vera Zabala Clemente and the next of kin of the other deceased passengers on the issue of negligence.

Why?

The trial court was convinced by the F.A.A. investigative report that the cause of the crash was “overboosting” of the No. 2 engine at takeoff and the fact that the plane was overloaded by more than two tons. Because the flight crew was inadequate, the situation was such that “…for all practical purposes the Captain was flying solo in emergency conditions.”

Section 6 of Order SO8430.20C called for “continuous surveillance of large and turbine powered aircraft to determine noncompliance of Federal Aviation Regulations.” Furthermore, a “ramp inspection” was required to determine that the crew and operator were in compliance with the safety requirements regarding the airworthiness of the aircraft as to the weight, balance and pilot qualifications. Any indication of an “illegal” flight crew was to be made known to the crew and persons chartering the service. Finally, discovery of such noncompliance was to be given the highest priority, second only to accident investigation.

The trial court found that these provisions of the Continuous Surveillance of Large and Turbined Powered Aircraft order were applicable to Roberto Clemente’s chartered flight and that the decedents were within the class of people sought to be protected under the order. If the required ramp inspection had been completed, the lack of a proper crew and overloading would have been discovered, Clemente would have been notified and, presumably, he would not have agreed to board the plane and avoided his untimely death.

The order was held to be mandatory in nature and because the F.A.A. violated its own orders, a failure to exercise due care was evident. Accordingly, the F.A.A.’s failure to inspect and ground the plane “contributed to the death of the…decedents.”

The appeal

The United States appealed the decision claiming that the trial court erred in its finding of a duty on the part of the Federal Aviation Administration. The critical question the appellate court was asked to address was whether the F.A.A. staff in Puerto Rico had a duty to inspect the subject DC-7 and warn the decedents of “irregularities.”

The appellate court acknowledged that the Federal Aviation Act was enacted to promote air safety but that this “hardly creates a legal duty to provide a particular class of passengers particular protective measures.” Further, the issuance of the Continuous Surveillance of Large and Turbined Powered Aircraft order was done gratuitously and did not create a duty to the decedents or any other passengers.

The court ultimately held that the order created a duty of the local inspectors to “perform their jobs in a certain way as directed by their superiors.” The failure to comply with this order, however, was grounds for internal discipline but did not create a cause of action based on negligent conduct against the F.A.A.

It is well-founded that the pilot in command has responsibility to determine that an airplane is safe for flight. There was nothing in this F.A.A. directive that shifted this responsibility to the federal government.

Further, the court found that the failure of the F.A.A. to inspect the plane did not add to the risk of injury to the passengers and there was no evidence that any of the deceased had relied on the F.A.A. to inspect the aircraft prior to takeoff or even knew about Order SO8430.20C.

Who won the appeal?

The United States. The finding of negligence on the part of the Federal Aviation Administration was reversed.

In its opinion, the appellate court concluded, “The passengers on this ill fated flight were acting for the highest of humanitarian motives at the time of the tragic crash. It would certainly be appropriate for a society to honor such conduct by taking those measures necessary to see to it that the families of the victims are adequately provided for in the future. However, making those kinds of decisions is beyond the scope of judicial power and authority. We are bound to apply the law and that duty requires the reversal of the district court’s judgment in favor of the plaintiffs.”

The plaintiff’s request that the case be heard by the United States Supreme court was denied.


xHitting (Part 2): Improved Model, Now with 2013 Leaders/Laggards

Happy holidays, all.  It took me a while, but I finally have the second installment of xHitting ready.  First off, thank you to all those who read/commented on the first piece.  For those who didn’t get a chance to read it, the goal here is to devise luck-neutralized versions of popular hitter stats, like OPS or wOBA.  A main extension over existing xBABIP calculators is that this approach offers an empirical basis to recover slugging and ISO, by estimating each individual hit type.

I’ve returned today with an improved version of the model.  Highlights:

  • One more year of data (now 2010-2013)
  • Now includes batted-ball direction (all player-seasons with at least 100 PA)
  • FB distance now recorded for all player-seasons with at least 100 PA

(There’s no theoretical reason for the 100 PA cutoff, only that I was grabbing some of the new data by hand and couldn’t justify the time to fetch literally every single player.)

I have also relaxed the uniformity of peripherals used for each outcome.  At least one reader asked for this, and after thinking about it a while, I decided I agree more than I disagree.  The main advantage of imposing uniformity was that it ensures the predicted rates (when an outs model is also included) sum to 100%.  But it is true that there are certain interactions or non-linearities that are important for some outcomes, but not others.  Including these where they don’t fully belong has a cost to standard errors/precision, and to intuitive interpretation.  To ensure rates still sum to 100%, there’s no longer an explicit ‘outs’ model; outs are simply assumed to be the remainder.

For those curious, below I display regression results for each outcome and its respective peripherals.  You can otherwise skip below if these are not of direct interest.

(The sample includes all player-years with at least 100 plate appearances between the 2010 and 2013 MLB seasons.  Park factors denote outcome-specific park factors available on FanGraphs.  Robust standard errors, clustered by player, are in parentheses; *** p$<$0.01, ** p$<$0.05, * p$<$0.1)

The new variables seem to help, as each outcome is now modeled more accurately than before (by either R2 or RMSE).  For comparison, here are the R2’s of the original specification:

  • 0.367 for singles rate
  • 0.236 for doubles rate
  • 0.511 for triples rate
  • 0.631 for HR rate

Something else I noticed: for balls that stay “inside the fence,” both pull/opp and actual side of the field matter.  Consider singles: the ball needs to be thrown to 1st base (right side of infield) specifically.  Thus an otherwise-equivalent ball hit to the left side is not the same as one hit to the right side, since the defensive play is harder to make from the left side.  Similarly, hitting the ball to left field is less conducive for triples than hitting the ball to right field.

But hitting the ball to the left side as a lefty is not the same as hitting it there as a righty, since one group is “pulling” while the other group is “slapping.”  The direction x handedness interactions help account for this.

How well do the predicted rates do in forecasting?  For singles, doubles, and triples, the predicted rates do unambiguously better than realized rates in forecasting next season’s rates.  Things are a little less clear for home runs, which I will expand on below.

Although predicted HR rate shows a slight edge in Table 1, the pattern often reverses (for HR only) if you use a different sample restriction — say requiring 300 PA in the preceding season.  (For other outcomes, the qualitative pattern from Table 1 still holds even under alternative sample restrictions.)

So home runs appear to be a potential problem area.  What should we do when we need HR to compute xAVG/xSLG/xOPS/xWOBA, etc.?  Should we:

  1. Use predicted HR anyway?
  2. Use actual HR instead?
  3. Use some combo of actual and predicted HR?

Empirically there is a clear answer for which choice is best.  But before getting to that, let’s take a look at whether predicted home-run rate tells us anything at all in terms of regression.  That is, if you’ve been hitting HR’s above/below your “expected” rate, do you tend to regress toward the prediction?

The answer to this seems to be “yes,” evidenced by the negative coefficient on ‘lagged rate residual’ below.

So, although realized HR rate is sometimes a better standalone forecaster of future home runs, predicted HR rate is still highly useful in predicting regression.  Making use of both, it seems intuitively best to use some combo of actual and predicted HR rate for forecasting.

This does, in fact, seem to be the best option empirically.  And this is true whether your end outcome of interest is AVG, OBP, SLG, ISO, OPS, or wOBA.

Observations:

  • (Option 1 = predicted HR only; Option 2 = actual HR only; Option 3 = combo)
  • Whether you use option 1, 2, or 3, xAVG and xOBP make better forecasters than actual past AVG or OBP
  • Option 1 does not do well for SLG, ISO , OPS, or wOBA
  • ^This was not the case in the previous article, but results to that point had sort of a funky sample, having recorded flyball distance only for a partial list of players
  • Option 2 “saves” things for xOPS and xWOBA, but still isn’t best for SLG or ISO
  • Option 3 makes the predicted version better for any of AVG, OBP, SLG, ISO, OPS, or wOBA

End takeaways:

  • The original premise that you can use “expected hitting,” estimated from peripherals, to remove luck effects and better predict future performance seems to be true; but you might need to make a slight HR adjustment.
  • The main reason I estimate each hit type individually is for the flexibility it offers in subsequent computations.  Whether you want xAVG, xOPS, xWOBA, etc., you have the component pieces that you need.  This would not be true if I estimated just a single xWOBA, and other users prefer xOPS or xISO.
  • A major extension over existing xBABIP methods is that this offers an empirical basis to recover xSLG.  The previous piece actually provides more commentary on this.
  • Natural next steps are to test partial-season performance, and also whether projection systems like ZiPS can make use of the estimated luck residuals to become more accurate.

Finally, I promised to list the leading over- and underachievers for the 2013 season.  By xWOBA, they are as follows:

Overachievers (250+ PA) Underachievers (250+ PA)
Name 2013 wOBA 2013 xWOBA Difference Name 2013 wOBA 2013 xWOBA Difference
Jose Iglesias 0.327 0.259 0.068 Kevin Frandsen 0.286 0.335 -0.049
Yasiel Puig 0.398 0.338 0.060 Alcides Escobar 0.247 0.296 -0.049
Colby Rasmus 0.365 0.315 0.050 Todd Helton 0.322 0.369 -0.047
Ryan Braun 0.370 0.321 0.049 Ryan Hanigan 0.252 0.296 -0.044
Ryan Raburn 0.389 0.344 0.045 Darwin Barney 0.252 0.296 -0.044
Mike Trout 0.423 0.379 0.044 Edwin Encarnacion 0.388 0.429 -0.041
Junior Lake 0.335 0.292 0.043 Josh Rutledge 0.281 0.319 -0.038
Matt Adams 0.365 0.323 0.042 Wilson Ramos 0.337 0.374 -0.037
Justin Maxwell 0.336 0.295 0.041 Yuniesky Betancourt 0.257 0.294 -0.037
Chris Johnson 0.354 0.314 0.040 Brian Roberts 0.309 0.345 -0.036

Comments/suggestions?