Author Archive

Do International Players Contribute More than Domestic Players: Part II

Last week I wrote an article on a little bit of research I had done regarding the contributions of domestic vs. international players in 2013, among players who had accumulated at least 300 plate appearances. See the link below in case you are interested to see the first piece:

http://www.fangraphs.com/community/do-international-players-contribute-more-than-domestic-players/

I got several great comments and ideas, which was the idea, so thank you for that, and I moved ahead to further the research with an extra question that was raised in a few of the comments. I investigated whether most of the international players are All-Star caliber. Obviously, “All-Star caliber” is a very vague description, but the idea is essentially to see if front offices aim to sign international players that they believe will contribute a significant amount at the Major League level, rather than just acting as an organizational filler.

In my experience in international baseball, players are not brought States-side from the Dominican academies because the front office believes the player will be a great organizational piece, so let’s bring him over and groom him to be a coach or scout some day when his playing days are over. That’s not the thought process. Those types of players are likely never going to make it off the island as a player.

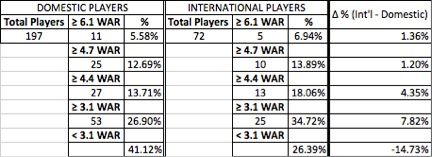
So the first thing I did was to take all the position players from the 2013 All-Star team and average all of their WAR values. That value comes out to 4.7 (WAR values taken from Baseball-Reference.com). I then sorted through each team to find how many players, domestic and international, had at least 4.7 WAR for the 2013 season. As I started to do this, however, I realized quickly that this 4.7 value might not be such a great marker. The All-Star roster is not the best way to find the best players in the game. Instead, I decided to make several markers and find the percentages of players that reached each of those marks. The average (4.7), median (4.4), and first (3.1) and third quartiles (6.1) were used to find percentages over a spectrum.

The results are summarized in the Table 1 below:

 photo war.jpg

The data shows that there was a slightly higher percentage of international players that contributed at least 4.7 and 6.1 WAR when compared to domestic players in 2013 – 1.20% and 1.36%, respectively. This is an insignificant increase to make any great conclusions, especially given the small sample size of looking only at the 2013 season.

At the lower levels of the spectrum, there is a much more sizable difference in the proportion of players that have contributed certain levels of WAR – at least 3.1 and at least 4.4 WAR. 3.1 WAR is not elite, but it still represents a significant role in a team’s lineup. The most interesting piece of information I gathered from the results came from looking at the percentage of players that contributed less than 3.1 WAR in 2013. The percentage is significantly higher (41.12%) for domestic players than international (26.39%). This indicates that the hypothesis was correct in saying that roster filler spots are more likely to be composed of domestic players. Almost 75% of all international players contributed at least 3.1 WAR, whereas only 58.88% of domestic players contributed at least 3.1 WAR. Keep in mind this sample only takes into account players that accumulated at least 300 plate appearances.

This might be due to the fact that there are so many more players that come through each organization’s system from the Rule 4 draft compared to from international talent. It’s easier to find, easier to scout, and overall a cheaper process to go through. As mentioned earlier, teams are probably looking to promote international prospects from their academies that will be more than organizational fillers in the minor leagues.

Thanks so much for reading and, as always, I’d love to hear thoughts, criticism, and possible future directions to continue!

Do International Players Contribute More than Domestic Players?

I have always wondered what the contribution of international players, players signed as amateur free agents, was compared to that of domestic players, players who went through the Rule 4 Draft process. So much money is spent annually on academies in the Dominican Republic and, to a lesser extent, in Venezuela. Of course, each team has a different budget for these international operations. The Yankees’ complex in the Dominican Republic is much more extravagant than the Marlins’, for example. Regardless, a question I have always asked is what the return on investment (ROI) is for these teams, seeing as greater than 90% of the players that come through these academies don’t ever reach the big leagues or develop into true prospects.

A little background on why I am so interested in this topic: I spent a year in the Dominican Republic, initially volunteering at a successful amateur agency in San Pedro de Macoris (an hour east of Santo Domingo), then helping out with the Dominican Prospect League’s showcases and tournaments, eventually landing with the Yankees as a Player Development/Video Operations intern.

Without access to financial statements, it is nearly impossible to determine a ROI for each team. Instead, I decided to do something much more simple. I looked at the WAR contributions for each team from international players and from domestic players.

I used Baseball-reference.com for all my information, sorting position players by plate appearances and used an arbitrary minimum of 400PA in order to include players that had enough opportunity to contribute in 2013, either positively or negatively.

On the extremes, in 2013 the Cardinals, Orioles, Nationals, and Phillies all had zero international players with at least 400PA, whereas the Diamondbacks, Rangers, Tigers, and Brewers each had four international players with the minimum plate appearances. Overall, 48 international players with at least 400PA combined for 141.6 WAR in 2013. On the other side, 151 domestic players combined for 396.5 WAR. Translated into WAR per player, international players contributed a rate of 3.0WAR/player and domestic players at a rate of 2.6WAR/player.

While going through the players of each team, I realized that I am leaving out players who contributed a significant WAR even though they did not accumulate 400PA, so I decided to lower the minimum to 300PA and change the rate statistic to WAR per 600PA, instead of per player. Players such as Hanley Ramirez were previously left out due to injury. Also, players who were traded midseason and did not have sufficient playing time to post 400PA with one team were previously excluded, such as Alfonso Soriano, are now included with the lowered minimum. Here is what the new results show:

Table 1: WAR per 600PA for international and domestic players during 2013 season. Minimum 300PA. WAR values taken from Baseball-reference.com.

PA

WAR

WAR/600PA

Int’l Players

32851

154.1

2.8

Domestic Players

101805

432.8

2.6


The results show that international players contributed a slightly higher rate of WAR per 600PA in 2013. The 0.2 greater WAR/600PA is not significant enough to conclude that international players contribute more talent per PA than did domestic players.

The next question I had was to determine what percentage of players who had 300PA were international and what percentage of WAR they contributed out of the total players with 300PA. What I found was that 24% of players with at least 300PA were international and they contributed 26% of WAR out of a total of 586.9 WAR. The percentage of players that are international seem to have contributed a similar percentage of overall WAR in 2013.

One small issue I came across was that there were a handful of players that went through the draft even though they are international players. A few examples are Jose Bautista (Dominican), Edwin Encarnacion (Dominican), Yan Gomes (Brazilian), Pedro Alvarez (Dominican), and Yonder Alonso (Cuban). I decided to switch this group of players from domestic to international. Table 2 shows WAR per 600PA, while changing this group of players from domestic to international.

Table 2: WAR per 600PA for international and domestic players during 2013 season, taking into account international players who were part of Rule 4 Draft. Minimum 300PA. WAR values taken from Baseball-reference.com.

PA

WAR

WAR/600PA

Int’l Players

36495

171.9

2.8

Domestic Players

98161

415.0

2.5


The data from Table 2 shows that the gap between international and domestic players of WAR/600PA increased to 0.3, but this gap is still not significant. The question about percentage of WAR contributed changes slightly, but also not significantly. International players contribute 29% of total WAR while international players only make up 27% of total players who had at least 300PA in 2013.

In conclusion, from this short study, I cannot say that international players contributed significantly more WAR than do domestic players in 2013, but there was a difference of 0.3 WAR/600PA in favor of international players. Furthermore, 27% of players with at least 300PA were international and they contributed 29% of the total WAR in 2013 of all players with at least 300PA.

I did not look at pitchers yet, but am open to hear thoughts, criticism, and possible future directions to continue this brief study!