Archive for Research

Simulating the WARriors

116.

116 is the Major League Baseball record for most wins in a single season, achieved by the 1906 Chicago Cubs and the 2001 Seattle Mariners.

For 95 years the record was unbreakable. Fifteen years after that, it remains unmatched.

Major-league players are assigned a value called Wins Above Replacement (WAR), a statistic that displays the number of wins a player added to the team above what a replacement player would have added. In recent years, a WAR value of 8 or higher would be associated with an MVP-quality season, a value of 5 for an All-Star, 2 for the average starter, 0-2 for a bench player, and less than 0 for a replacement player.

With my curiosity looming, I decided to do a little research and came up with a list of the highest single-season WAR values for every position throughout history. But I decided to take it a step further. I wanted to create the greatest WAR-based roster of all time, a 25-man winning powerhouse that would be called, fittingly, the WARriors. I found the highest single-season WAR for each of the starting eight non-pitcher positions, followed by the highest single-season WAR for a five-man starting rotation, and then decided to add three infielders, three outfielders, a catcher, four relief pitchers, and a closer, all with the highest single-season WAR in their respective position (for the bench hitters, I chose the players with the NEXT-highest WAR at their position, behind the starting eight).

Here’s what I came up with:

WARriors Roster

C- Mike Piazza 1997 – 8.7 WAR
1B- Lou Gehrig – 1927 – 11.8 WAR
2B- Rogers Hornsby 1924 – 12.1 WAR
3B- Mike Schmidt 1974 – 9.7 WAR
SS- Cal Ripken Jr. 1991 – 11.5 WAR
LF- Carl Yastrzemski 1967 – 12.4 WAR
CF- Barry Bonds 2001 – 11.8 WAR
RF- Babe Ruth 1923 – 14.1 WAR

Total: 92.1 WAR

UT- Honus Wagner 1908 – 11.5 WAR
OF- Ty Cobb 1917 – 11.3 WAR
OF- Mickey Mantle 1957 – 11.3 WAR
OF- Willie Mays 1965 – 11.2 WAR
UT- Joe Morgan 1975 – 11.0 WAR
UT- Jimmie Foxx 1932 – 10.5 WAR
C- Johnny Bench 1972 – 8.6 WAR

Total: 75.4 WAR

SP- Tim Keefe 1883 – 20 WAR
SP- Old Hoss Radbourn 1884 – 19.3 WAR
SP- Jim Devlin 1876 – 18.6 WAR
SP- Pud Galvin 1884 – 18.4 WAR
SP- Guy Hecker 1884 – 17.8 WAR

Total: 94.1 WAR

RP- Jim Kern – 1979 – 6.2 WAR
RP- Mark Eichhorn – 1986 – 7.4 WAR
RP- John Hiller – 1973 – 8.1 WAR
RP- Bruce Sutter – 1977 – 6.5 WAR
CL- Goose Gossage 1975 – 8.2 WAR

Total: 36.4 WAR

Added together, the total team WAR for the WARriors is a ridiculous 298. That’s almost two full seasons of wins. To put it in perspective, the 2001 Mariners had a total team WAR of 67.7, and the 1906 Cubs’ total was 56. This is expected, however, and is a near impossible task to analyze efficiently because of the lack of pre-1900 data, and the mix of players from almost every decade. But it’s still fun to look at, so let’s run with it.

Now, the question on the table is this: Would this team win more than 116 games? I’d put money on it. But an even bolder question, would this team go 162-0? Again, we have to understand what we’re dealing with. The skill level of a ballplayer in 2016 is entirely different than an 1800s hurler pitching 500-600 innings per year. Luckily, we have the technology.

First, we need a starting lineup. As the self-proclaimed WARriors manager, here’s the Opening Day nine that I would play (each player listed had the highest single season WAR value for their position):

Hornsby 2B – .424/507/.696

Bonds CF – .323/.515/.863

Ruth RF – .393/.545/.764

Gehrig 1B – .373/.474/.765

Yastrzemski LF – .326/.418/.622

Schmidt 3B – .282/.395/.546

Piazza C – .362/.431/.638

Ripken SS – .323/.374/.566

Keefe SP – 41-27/2.41/359 K’s

But to go 162-0, we need to play 162 games, and who would those games be against? My idea was to simulate a 162-game season by playing 54 three-game series against the last 54 World Series champions (54 times 3 = 162). That should make it interesting, right? So for example, the WARriors would begin with three games against the 2015 Royals, followed by three against the 2014 Giants, then three versus the 2013 Red Sox, and so on, dating back to 1961. To be fair, every other series would be on the road, and the pitcher’s spot will bat. To support my love of the Reds, I decided to use the 2003 Great American Ball Park as the WARriors’ home stadium.

I used the whatifsports.com Dream Team simulator to assemble the WARriors roster. Because the data on their website only goes back to 1885, I will need to eliminate the years of my entire starting rotation from the original roster. However, I am replacing that data with each pitchers’ next-best year post-1885, or finding the next-best-WAR starting pitcher if one of the originals did not play beyond 1885, or if that next-best had a better WAR. Whatifsports manually subs position players as needed, and I manually rotated the starting pitchers every game, also switching the WARriors to the road team every other series.

Without further ado, here are the results of the simulated games:

2015 Royals @ WARriors

Game 1: WARriors 18 Royals 0

Game 2: WARriors 19 Royals 3

Game 3: WARriors 17 Royals 10

WARriors @ 2014 San Francisco Giants

Game 1: WARriors 11 Giants 0

Game 2: WARriors 2 Giants 1

Game 3: WARriors 11 Giants 8

2013 Red Sox @ WARriors

Game 1: WARriors 5 Red Sox 4

Game 2: WARriors 23 Red Sox 4

Game 3: WARriors 11 Red Sox 7

WARriors @ 2012 Giants

Game 1: WARiors 4 Giants 2

Game 2: WARriors 18 Giants 4

Game 3: WARiors 21 Giants 3

2011 Cardinals @ WARriors

Game 1: WARriors 21 Cardinals 2

Game 2: WARriors 27 Cardinals 0

Game 3: WARriors 23 Cardinals 2

WARriors @ 2010 Giants

Game 1: WARriors 18 Giants 8

Game 2: WARriors 6 Giants 1

Game 3: WARriors 13 Giants 10

2009 Yankees @ WARriors

Game 1: WARriors 7 Yankees 2

Game 2: WARriors 15 Yankees 3

Game 3: WARriors 10 Yankees 6

WARriors @ 2008 Phillies

Game 1: WARriors 5 Phillies 4

Game 2: WARriors 13 Phillies 1

Game 3: WARriors 9 Phillies 5

2007 Red Sox @ WARriors

Game 1: WARriors 8 Red Sox 3

Game 2: WARriors 16 Red Sox 8

Game 3: WARriors 12 Red Sox 5

WARriors @ 2006 Cardinals

Game 1: WARriors 21 Cardinals 7

Game 2: WARriors 18 Cardinals 4

Game 3: WARriors 17 Cardinals 11

2005 White Sox @ WARriors

Game 1: WARriors 8 White Sox 2

Game 2: WARriors 14 White Sox 0

Game 3: WARriors 12 White Sox 4

WARriors @ 2004 Red Sox

Game 1: WARriors 5 Red Sox 3

Game 2: WARriors 7 Red Sox 1

Game 3: WARriors 3 Red Sox 1

2003 Marlins @ WARriors

Game 1: WARriors 15 Marlins 0

Game 2: WARriors 23 Marlins 6

Game 3: WARriors 21 Marlins 5

WARriors @ 2002 Angels

Game 1: WARriors 9 Angels 7

Game 2: WARriors 7 Angels 0

Game 3: WARriors 16 Angels 5

2001 Diamondbacks @ WARriors

Game 1: WARriors 2 Diamondbacks 0

Game 2: WARriors 5 Diamondbacks 1

Game 3: WARriors 5 Diamondbacks 4

WARriors @ 2000 Yankees

Game 1: WARriors 13 Yankees 10

Game 2: WARriors 13 Yankees 12

Game 3: WARriors 19 Yankees 3

1999 Yankees @ WARriors

Game 1: WARriors 19 Yankees 13

Game 2: WARriors 16 Yankees 12

Game 3: WARriors 19 Yankees 9

WARriors @ 1998 Yankees

Game 1: WARriors 11 Yankees 5

Game 2: WARriors 8 Yankees 4

Game 3: WARriors 16 Yankees 1

1997 Marlins @ WARriors

Game 1: WARriors 27 Marlins 0

Game 2: WARriors 24 Marlins 2

Game 3: WARriors 15 Marlins 0

WARriors @ 1996 Yankees

Game 1: WARriors 13 Yankees 3

Game 2: WARriors 16 Yankees 0

Game 3: WARriors 25 Yankees 10

1995 Braves @ WARriors

Game 1: WARriors 9 Braves 5

Game 2: WARriors 10 Braves 2

Game 3: WARriors 6 Braves 4

WARriors @ 1993 Blue Jays

Game 1: WARriors 12 Blue Jays 6

Game 2: WARriors 13 Blue Jays 2

Game 3: WARriors 7 Blue Jays 1

1992 Blue Jays @ WARriors

Game 1: WARriors 10 Blue Jays 4

Game 2: WARriors 17 Blue Jays 13

Game 3: WARriors 15 Blue Jays 10

WARriors @ 1991 Twins

Game 1: WARriors 12 Twins 0

Game 2: WARriors 19 Twins 8

Game 3: WARriors 6 Twins 4

1990 Reds @ WARriors

Game 1: WARriors 10 Reds 9

Game 2: WARriors 5 Reds 1

Game 3: WARriors 12 Reds 2

WARriors @ 1989 A’s

Game 1: WARriors 16 A’s 12

Game 2: WARriors 11 A’s 7

Game 3: WARriors 21 A’s 6

1988 Dodgers @ WARriors

Game 1: WARriors 8 Dodgers 3

Game 2: WARriors 14 Dodgers 11

Game 3: WARriors 9 Dodgers 3

WARriors @ 1987 Twins

Game 1: WARriors 20 Twins 6

Game 2: WARriors 22 Twins 1

Game 3: WARriors 15 Twins 9

1986 Mets @ WARriors

Game 1: WARriors 12 Mets 2

Game 2: WARriors 15 Mets 5

Game 3: WARriors 9 Mets 5

WARriors @ 1985 Royals

Game 1: WARriors 9 Royals 5

Game 2: WARriors 4 Royals 3

Game 3: WARriors 17 Royals 5

1984 Tigers @ WARriors

Game 1: WARriors 8 Tigers 3

Game 2: WARriors 4 Tigers 1

Game 3: WARriors 14 Tigers 0

WARriors @ 1983 Orioles

Game 1: WARriors 19 Orioles 3

Game 2: WARriors 23 Orioles 4

Game 3: WARriors 14 Orioles 2

1982 Cardinals @ WARriors

Game 1: WARriors 21 Cardinals 0

Game 2: WARriors 18 Cardinals 1

Game 3: WARriors 7 Cardinals 5

WARriors @ 1981 Dodgers

Game 1: WARriors 6 Dodgers 0

Game 2: WARriors 16 Dodgers 0

Game 3: WARriors 10 Dodgers 6

1980 Phillies @ WARriors

Game 1: WARriors 9 Phillies 6

Game 2: WARriors 12 Phillies 0

Game 3: WARriors 15 Phillies 12

WARriors @ 1979 Pirates

Game 1: WARriors 8 Pirates 4

Game 2: WARriors 10 Pirates 9

Game 3: WARriors 15 Pirates 5

1978 Yankees @ WARriors

Game 1: WARriors 3 Yankees 0

Game 2: WARriors 6 Yankees 1

Game 3: WARriors 14 Yankees 1

WARriors @ 1977 Yankees

Game 1: WARriors 17 Yankees 14

Game 2: WARriors 11 Yankees 7

Game 3: WARriors 14 Yankees 9

1976 Reds @ WARriors

Game 1: WARriors 18 Reds 5

Game 2: WARriors 2 Reds 0

Game 3: WARriors 5 Reds 3

WARriors @ 1975 Reds

Game 1: WARriors 9 Reds 0

Game 2: WARriors 4 Reds 6

Game 3: WARriors 8 Reds 4

1974 A’s @ WARriors

Game 1: WARriors 16 A’s 13

Game 2: WARriors 10 A’s 2

Game 3: WARriors 9 A’s 7

WARriors @ 1973 A’s

Game 1: WARriors 1 A’s 0

Game 2: WARriors 12 A’s 4

Game 3: WARriors 4 A’s 0

1972 A’s @ WARriors

Game 1: WARriors 8 A’s 5

Game 2: WARriors 5 A’s 3

Game 3: WARriors 9 A’s 5

WARriors @ 1971 Pirates

Game 1: WARriors 16 Pirates 3

Game 2: WARriors 5 Pirates 1

Game 3: WARriors 11 Pirates 9

1970 Orioles @ WARriors

Game 1: WARriors 14 Orioles 12

Game 2: WARriors 9 Orioles 8

Game 3: WARriors 12 Orioles 2

WARriors @ 1969 Mets

Game 1: WARriors 22 Mets 0

Game 2: WARriors 17 Mets 0

Game 3: WARriors 15 Mets 1

1968 Tigers @ WARriors

Game 1: WARriors 12 Tigers 6

Game 2: WARriors 10 Tigers 4

Game 3: WARriors 18 Tigers 16

WARriors @ 1967 Cardinals

Game 1: WARriors 16 Cardinals 5

Game 2: WARriors 13 Cardinals 7

Game 3: WARriors 24 Cardinals 14

1966 Orioles @ WARriors

Game 1: WARriors 15 Orioles 2

Game 2: WARriors 20 Orioles 8

Game 3: WARriors 9 Orioles 3

WARriors @ 1965 Dodgers

Game 1: WARriors 5 Dodgers 3

Game 2: WARriors 6 Dodgers 3

Game 3: WARriors 5 Dodgers 0

1964 Cardinals @ WARriors

Game 1: WARriors 12 Cardinals 1

Game 2: WARriors 19 Cardinals 7

Game 3: WARriors 12 Cardinals 8

WARriors @ 1963 Dodgers

Game 1: WARriors 8 Dodgers 0

Game 2: WARriors 8 Dodgers 1

Game 3: WARriors 6 Dodgers 4

1962 Yankees @ WARriors

Game 1: WARriors 10 Yankees 9

Game 2: WARriors 3 Yankees 1

Game 3: WARriors 5 Yankees 2

WARriors @ 1961 Yankees

Game 1: WARriors 17 Yankees 11

Game 2: WARriors 11 Yankees 0

Game 3: WARriors 13 Yankees 2


WARriors Final Season Record: 161-1


Unbelievable. Well folks, there it is. If you actually sifted through all those results, you would see that the one, tiny blemish on an otherwise perfect season was game two against the notorious 1975 Big Red Machine. According to the simulation, George Foster went 1-4 in the game with a two-run shot, and Pete Rose added an RBI single and a stolen base. Ironically, my Reds were the one to end the streak.

In short, a 25-man roster of the best single-season WAR values in the history of baseball went 161-1 against the last 54 World Series Champions, playing each champ in a three-game series and alternating between road and home venues. The WARriors scored an outrageous 2,002 runs in 154 games during this simulation, equal to 13 runs per game. Their opponents scored 708 runs in 154 games, equal to about 4.5 runs per game. That’s a run differential of 1,294.

I am both astounded that I had the patience to run all of those games, and also that not one other team was able to sneak by this loaded roster.

This makes for a very interesting case, and leads to further questions and different match-ups that would be extremely fun to see. Different ballparks, more accurate values assigned, different lineups, etc. would obviously reveal a separate outcome, but these simulations revealed that winning isn’t everything.

Okay, maybe 161 times out of 162 it is.


Does Payroll Matter? (Pt. II)

[Part I was published here and here]

In the previous post we discussed essentially two questions: First, whether there is a relationship between team payroll and wins. Second, has this relationship changed in time? If so, where are the peaks? Where are we now? Let’s continue digging this topic up.

Question 3: Will money buy you a ring or a post-season ticket? If so, how much should we spend?

Let’s start by saying that nothing will buy you a championship ring. But money can and will improve your odds! I’d say it can get your foot in the door.

The following graph shows the probability of reaching the playoffs, winning the American or National League or winning the World Series at the beginning of each season (BoS). I have split teams into three tiers depending on their payroll total each year. The low tier refers to the bottom 33% payroll total of all teams in a season, medium tier goes from 33% to 66% and top tier is the top 34%. Keep in mind I am analyzing data from 1976 to 2015, excluding 1994 due to the strike. I have also added to the graph below the expected probability for each event e.g. playoff appearance, league win and World Series win. The expected probability is the natural probability each team has at the beginning of the season; for example, each team has 1/30, or ~3.3%, chance of winning the World Series. In the long run, in a very competitive and balanced league, the numbers should be closer to the expected rates, however they are not.

Picture

Did you see that? Let’s state the obvious first: Large-payroll teams had done better than the rest of the teams, i.e. got to the playoffs as well as reached and won the World Series more frequently than low and medium tiers. Let’s digest that again: top-tier teams are almost four times more likely to reach the playoffs than low-tier teams. As we move along in the postseason, as expected, high-budget teams win more often. While the rich teams got to the playoffs at a ~80% better rate than expected, they won the World Series at a ~106% better rate than expected.

Let’s look at the tiny 0.3% of low-tier teams that won the Series. I should say team. I am talking about the Miami Marlins in 2003. They are the only low-tier team that has won the Series, since 1976. Amusingly, they beat the Yankees.

Now, these numbers do not show the full picture because I am compounding the effect of being eliminated in the previous step of the event I am measuring. For example, you can’t win the World Series if you did not win your league. You can’t win the league if you did not make it to the playoffs. Let’s dial back and think of the probability of winning the World Series once you are in the World Series. The same situation happens with the league championship probability. Let’s calculate out of the teams that are already in the playoffs. The graph below shows the probability of winning at the beginning of each event (BoE). Does that make sense? I hope it does.

Picture

Let’s go over each event, from left to right: First, playoff appearance probability remains the same as before. Mid- and low-tier budget teams reached the playoffs with a lower probability than you would expect. The second bucket is related to winning the league (read: reaching the World Series) once you are in the playoffs. For example in 2015 there were 10 teams in the playoffs (five teams per league). The expected probability of those teams to reach the World Series is 20%. With the inclusion of the Wild Card and then the second Wild Card, that number has decreased but historically sits at 31%. While top and mid-tier payroll teams have reached the World Series more frequently than the benchmark would suggest the difference is small and, interestingly, higher for mid-tier teams. It is important to notice that poor teams have a little more than half the expected chances of reaching the World Series, once they get to the playoffs. So even if you assume low-tiers teams at this stage are good (they are in the playoffs after all), they have performed considerably worse than the rest. This is a finding in itself.

If we move to World Series, the situation gets even tougher for low-budget teams. Similarly to the league-win breakdown, rich and mid-tier teams have performed better than the average, but in this case, rich ones have done slightly better than mid-tiers. If we think about this, we would expect this result because two very good teams are facing each other — no matter how much they are playing their players. On the other hand, low-tiers ball clubs have fared badly in this situation, accomplishing only one World Series win (the aforementioned Marlins in 2003) in seven attempts. It looks that their chances are reduced by ~71%. Again, remember we are talking about good/great teams playing the World Series, but again and again they have failed to deliver.

So I would like to highlight the findings so far in this question:

  1. Payroll matters in relation to reaching the playoffs as rich teams get there with approximately twice the frequency of mid-tiers and four times more than low-budget teams. Therefore money seems to be an important element at the beginning of the season.
  2. Once the postseason starts, though, rich and average teams perform similarly both in the path to the World Series and in the Series itself.
  3. Low-tier teams perform worse than expected as the season goes on, even under the assumption that they are good teams. Their probabilities of success go down from half what’s expected during the season (11% vs 23%) and in the first rounds of the playoffs (17% vs 31%) to one-third (14% vs 50%) in the World Series.
  4. Therefore it looks like money matters when the postseason starts because top and mid-tier teams have done ‘equally’ well, but much better than low-tier teams. While further study needs to be undertaken, my hypothesis is that investing more than what would be needed to be in the top 34% of all teams (i.e. be a top-tier team) would not drive better results than mid-tier teams once in the postseason. Therefore any extra dollar spent beyond what it would take to be a top-tier team is not a dollar (arguably) efficiently spent.

Question 4: Are there big spenders? If so, who are they? Have they changed over the years?

If you are still reading, I have reached my objective.

To answer this question I have plotted the average versus the standard deviation of the z-score for each team.  I have also bucketed teams into four types of spenders e.g. high, mid-high, mid-low and low. The table below shows the number of seasons per team with their payroll labelled as high, medium and low tier. Please take a look at those:

Picture

Team No. of seasons as High tier No. of seasons as Medium tier No. of seasons as Low tier Total Number of seasons Type of spender (1976-2015)
ARI 4 5 9 18 Mid-Low
ATL 18 17 5 40 Mid-High
BAL 8 22 10 40 Mid-Low
BOS 33 7 40 High
CHC 13 22 5 40 Mid-High
CHW 9 18 13 40 Mid-Low
CIN 10 14 16 40 Mid-Low
CLE 8 8 24 40 Mid-Low
COL 3 11 9 23 Mid-Low
DET 12 13 15 40 Mid-Low
HOU 8 20 12 40 Mid-Low
KCR 11 9 20 40 Mid-Low
LAA 24 11 5 40 Mid-High
LAD 28 12 40 High
MIA 2 1 20 23 Low
MIL 6 14 20 40 Mid-Low
MON 4 9 16 29 Mid-Low
MIN 1 8 31 40 Low
NYM 24 10 6 40 Mid-High
NYY 39 1 40 High
OAK 7 9 24 40 Mid-Low
PHI 18 13 9 40 Mid-High
PIT 5 7 28 40 Low
SDP 1 22 17 40 Mid-Low
SEA 9 12 18 39 Mid-Low
SFG 14 21 5 40 Mid-High
STL 9 27 4 40 Mid-High
TBR 2 16 18 Low
TEX 10 16 14 40 Mid-Low
TOR 11 15 13 39 Mid-Low
WAS 2 1 8 11 Low

Please remember low tier refers to the bottom 33% payroll total of all teams in a season, medium tier goes from 33% to 66% and top tier is the top 34%. The answer to our first sub-question seems relatively straightforward. As you can see, there are three teams (NYY, BOS and LAD) who have been significantly above the pack, in terms of average payroll. The Yankees have been a high-tier payroll team in 39 out of 40 seasons. The Red Sox and Dodgers have been in the top tier 33 and 28 times out of 40, respectively. These teams have big payrolls consistently and therefore are the truly big-market teams. You may argue that the Mets or Angels are big-market teams and you would not be entirely wrong. They are definitely wealthy but payroll comparison shows they have not been in the league’s top 34% payroll on at least 40% of the last 40 seasons.

I have also, of course, included the teams that I have classified as low spenders. These are the Pirates, Marlins, Twins, Rays and Nationals. The Rays have never been in the top tier, which is the lowest spender in the league followed by the Marlins — what is going on in Florida? You may argue that the Padres and/or the Expos are (were) low spenders and I would not try to persuade you to think otherwise. The line is thin but had to be drawn somewhere.

Another interesting insight is payroll variance. No team has been more consistent than the Cardinals or Rays. On the other side of the spectrum we have the Phillies and the Mariners. This is probably a reflection of how these organizations are run. Below there is a plot of accumulated payroll z-scores and win percentage (for the entire period 1976-2015). If you have been following baseball for a few years most of this resonates with you: The Cubs, Mariners, Rockies and Mets have historically been underperforming while the Cardinals, Braves, Reds and A’s usually find non-payroll-related ways to win.

Picture

With the best fit-line information (Expected W% = 0.0296*Payroll Z-score + 0.4994), I have calculated the expected winning percentage (read: what ‘should’ have happened) and compared it to what actually happened. This will quickly allow us to identify good performers over the 40-years period. In essence, in the table below I am highlighting which teams are furthest away from the dotted line in the graph above.

Team Payroll Z-score Actual W% Expected W% Gap (%)
STL 0.103 0.528 0.502 4.9%
OAK –       0.458 0.510 0.486 4.7%
MON –        0.639 0.496 0.480 3.1%
CIN –        0.093 0.507 0.497 2.0%
ATL 0.429 0.522 0.512 1.9%
MIN –        0.841 0.483 0.475 1.8%
CLE –        0.454 0.494 0.486 1.7%
CHW –        0.129 0.504 0.496 1.6%
HOU –        0.168 0.501 0.494 1.3%
BOS 1.071 0.538 0.531 1.2%
SFG 0.192 0.510 0.505 1.0%
LAD 0.888 0.531 0.526 1.0%
TEX –        0.089 0.499 0.497 0.4%
NYY 2.251 0.567 0.566 0.2%
MIA –        1.052 0.468 0.468 0.0%
LAA 0.432 0.512 0.512 -0.1%
BAL 0.012 0.499 0.500 -0.2%
MIL –        0.396 0.486 0.488 -0.3%
TOR –        0.082 0.495 0.497 -0.4%
PIT –        0.598 0.480 0.482 -0.4%
ARI –        0.158 0.492 0.495 -0.6%
SDP –        0.582 0.477 0.482 -1.0%
PHI 0.495 0.508 0.514 -1.2%
TBR –        1.004 0.464 0.470 -1.3%
WAS –        0.429 0.480 0.487 -1.3%
KCR –        0.261 0.484 0.492 -1.5%
DET –        0.077 0.489 0.497 -1.6%
SEA –        0.498 0.467 0.485 -3.7%
NYM 0.504 0.495 0.514 -3.9%
COL –        0.303 0.467 0.490 -5.1%
CHC 0.218 0.478 0.506 -5.9%


We have one last question to discuss in this post and it is whether deep-pocket teams have changed over time. I think by now you know the short answer to this is ‘yes, they have’ — however, the truth of the story lies in the details. I partly addressed this question with the standard deviation of the z-scores before, however I would like to share a view of how this picture has evolved by decades.

Team 1976-1985 1986-1995 1996-2005 2006-2015 Type of team over time
NYY High High High High Keep
BOS Mid-High High High High Keep
LAD High High High High Keep
NYM Mid-Low High High Mid-High Keep
PHI High Mid-Low Mid-Low High Swinger
LAA High Mid-High Mid-High High Keep
ATL Mid-High Mid-High High Mid-High Keep
CHC Mid-High Mid-High Mid-High Mid-High Keep
SFG Mid-Low Mid-High Mid-High Mid-High Keep
STL Mid-Low Mid-High Mid-High Mid-High Keep
BAL Mid-Low Mid-Low Mid-High Mid-Low Keep
DET Low Mid-High Low High Swinger
TOR Low High Mid-Low Mid-Low Swinger
TEX Mid-Low Low Mid-High Mid-Low Swinger
CIN Mid-High Mid-High Low Mid-Low Downward
CHW Mid-Low Mid-Low Mid-Low Mid-High Upward
ARI Mid-High Low Downward
HOU Mid-High Mid-Low Mid-High Mid-Low Swinger
KCR Mid-Low High Low Low Swinger
COL Mid-Low Mid-High Low Swinger
MIL Mid-High Low Low Mid-Low Downward
WAS Low Mid-High Upwards
CLE Mid-High Low Mid-High Low Swinger
OAK Mid-Low Mid-High Low Low Swinger
SEA Low Low High Mid-High Upwards
SDP Mid-Low Mid-Low Mid-Low Low Keep
PIT Mid-High Low Low Low Downward
MON Mid-High Low Low Downward
MIN Low Mid-High Low Mid-High Swinger
TBR Low Low Keep
MIA Low Low Low Keep


I sliced teams into four categories. First there are the downward spenders. It is interesting how some teams e.g. the Expos, Brewers, Reds and Pirates moved from mid-high payroll spenders to (very) low ones. It looks as if they re-shifted their spending priorities in the mid-80’s and have stuck with that strategy since. The second bucket (Swingers) is teams that have swung between high and low-payroll tiers, depending on how the wind blows. Teams such as the Indians, Phillies, Twins, Rockies and Tigers are here. The third group (Upward) is comprised of those teams who have progressively moved into the upper tier e.g. the Mariners and Nationals. These are big-city, relatively new franchises that have not had on-field success. Finally there is a group (Keepers) that have remained constant on payroll spending. These are the likes of the Yankees, Red Sox, Angels, Dodgers, Padres, Marlins, and Rays.

In summary, it looks like money matters since the relationship between payroll and wins is weak but statistically significant. However, the influence of payroll is not as big as we may originally have thought. Money definitely influences which teams go to the postseason i.e. postseason chances are directly proportional to payroll, but once a team is in the postseason, payroll predictive power goes down i.e. it does not pay off to over-invest in payroll (did you hear that Theo?). Thus there seems to be a diminishing returns curve during the season as the value of $1 extra in payroll changes depending on where you are in the curve. Ideally, a GM wants to spend just enough to get his/her team to the playoffs because, after that point, the field is more leveled, raising the question of whether more of those resources should be allocated to other areas e.g. manager, front office, or player development. I guess that’s part of another post.


Hardball Retrospective – What Might Have Been – The “Original” 1905 Beaneaters

In “Hardball Retrospective: Evaluating Scouting and Development Outcomes for the Modern-Era Franchises”, I placed every ballplayer in the modern era (from 1901-present) on their original team. I calculated revised standings for every season based entirely on the performance of each team’s “original” players. I discuss every team’s “original” players and seasons at length along with organizational performance with respect to the Amateur Draft (or First-Year Player Draft), amateur free agent signings and other methods of player acquisition.  Season standings, WAR and Win Shares totals for the “original” teams are compared against the “actual” team results to assess each franchise’s scouting, development and general management skills.

Expanding on my research for the book, the following series of articles will reveal the teams with the biggest single-season difference in the WAR and Win Shares for the “Original” vs. “Actual” rosters for every Major League organization. “Hardball Retrospective” is available in digital format on Amazon, Barnes and Noble, GooglePlay, iTunes and KoboBooks. The paperback edition is available on Amazon, Barnes and Noble and CreateSpace. Supplemental Statistics, Charts and Graphs along with a discussion forum are offered at TuataraSoftware.com.

Don Daglow (Intellivision World Series Major League Baseball, Earl Weaver Baseball, Tony LaRussa Baseball) contributed the foreword for Hardball Retrospective. The foreword and preview of my book are accessible here.

Terminology

OWAR – Wins Above Replacement for players on “original” teams

OWS – Win Shares for players on “original” teams

OPW% – Pythagorean Won-Loss record for the “original” teams

AWAR – Wins Above Replacement for players on “actual” teams

AWS – Win Shares for players on “actual” teams

APW% – Pythagorean Won-Loss record for the “actual” teams

Assessment

The 1905 Boston Beaneaters 

OWAR: 30.1     OWS: 261     OPW%: .423     (65-89)

AWAR: 11.3       AWS: 152     APW%: .331   (51-103)

WARdiff: 18.8                        WSdiff: 109  

The “Original” 1905 Beaneaters placed seventh in the Senior Circuit, narrowly avoiding a last-place finish by a two-game margin over the Brooklyn Superbas. Yet the “Actual” Beaneaters underachieved when compared to the “Original” squad by 14 victories and an astonishing WSdiff of 109.

Charlie “Piano Legs” Hickman (.277/4/66) outplayed “Actuals” second-sacker Fred Raymer (.211/0/31). Hall of Fame third baseman Jimmy Collins (.276/4/65) posted superior results for the “Originals” compared to “Fighting” Harry Wolverton (.225/2/55). Dan “Cap” McGann (.299/5/75) slashed 14 triples and pilfered 22 bases while fellow first baseman Fred Tenney (.288/0/28) lagged in the power department. Ernie Courtney (.275/2/77) provided additional thump and established career-highs in most of the major offensive categories.

Kid Nichols rates ninth among pitchers according to Bill James in “The New Bill James Historical Baseball Abstract.” “Original” Beaneaters teammates listed in the “NBJHBA” top 100 rankings include Collins (17th-3B), Chick Stahl (51st-CF), Bobby Lowe (56th-2B), Tenney (70th-1B), Hickman (80th-1B), Vic Willis (84th-P) and McGann (92nd-1B).

Original 1905 Beaneaters                               Actual 1905 Beaneaters

STARTING LINEUP POS OWAR OWS STARTING LINEUP POS OWAR OWS
Joe Kelley LF -0.73 9.35 Jim Delahanty LF -1.92 9.48
Chick Stahl CF 1.1 16.77 Rip Cannell CF -0.82 9.3
Cozy P. Dolan RF 0.32 10.94 Cozy P. Dolan RF 0.5 9.95
Dan McGann 1B 3.17 23.57 Fred Tenney 1B 3.24 16.63
Charlie Hickman 2B/OF 3.3 23.1 Fred Raymer 2B -5.28 3.14
Dave Murphy SS -0.11 0.03 Ed Abbaticchio SS -0.47 15.95
Jimmy Collins 3B 3.76 22.84 Harry Wolverton 3B -1.85 8.21
Billy Sullivan C 0.45 6.86 Pat Moran C 0.3 6.43
BENCH POS OWAR OWS BENCH POS AWAR AWS
Ernie Courtney 3B 1.41 18.3 Tom Needham C 0.45 5.06
Fred Tenney 1B 3.24 16.63 Bill Lauterborn 3B -1.71 1.14
Kitty Bransfield 1B 0.2 13.38 Bud Sharpe RF -1.74 0.7
Rip Cannell CF -0.82 9.3 Allie Strobel 3B -0.28 0.18
Pat Moran C 0.3 6.43 George Barclay LF -1.67 0.11
Jack Warner C 0.45 5.71 Dave Murphy SS -0.11 0.03
Tom Needham C 0.45 5.06 Gabby Street C -0.1 0.01
Bobby Lowe 2B/3B -0.82 2.25 Bill McCarthy C -0.05 0
Bill Lauterborn 3B -1.71 1.14
Bud Sharpe RF -1.74 0.7
Allie Strobel 3B -0.28 0.18
Bill McCarthy C -0.05 0

Claimed by the “Original” and “Actual” Beaneaters, Irv Young’s inaugural season encompassed 20 victories against 21 defeats, a 2.90 ERA and League-bests in complete games (41) and innings pitched (378). In a similar fashion Vic Willis was tagged with 29 losses despite a respectable 3.21 ERA. Togie Pittinger furnished a record of 23-14 with a 3.09 ERA for the “Originals” and Kid Nichols contributed 11 wins and a 3.12 ERA. Chick Fraser (14-21, 3.28) hurled 35 complete games in 37 starts for the “Actuals”.

  Original 1905 Beaneaters                          Actual 1905 Beaneaters

ROTATION POS OWAR OWS ROTATION POS AWAR AWS
Irv Young SP 6.54 29.02 Irv Young SP 6.54 29.02
Togie Pittinger SP 1.33 18.56 Chick Fraser SP 1.22 17.77
Vic Willis SP 0.9 17.66 Vic Willis SP 0.9 17.66
Kid Nichols SP 0.9 10.58 Kaiser Wilhelm SP -3.87 1.5
BULLPEN POS OWAR OWS BULLPEN POS AWAR AWS
Dick Harley SP -1.04 0.73 Dick Harley SP -1.04 0.73
Frank Hershey SP -0.18 0 Frank Hershey SP -0.18 0
Jake Volz SP -0.61 0


Notable Transactions

Dan McGann

September 22, 1897: Purchased with Butts Wagner, Bob McHale and Cooney Snyder by the Washington Senators from Toronto (Eastern) for $8,500.

December 10, 1897: Traded by the Washington Senators with Gene DeMontreville and Doc McJames to the Baltimore Orioles for Doc Amole, Jack Doyle and Heinie Reitz.

March 11, 1899: Assigned to the Brooklyn Superbas by the Baltimore Orioles.

July 14, 1899: Traded by the Brooklyn Superbas with Aleck Smith to the Washington Senators for Deacon McGuire.

March 9, 1900: Purchased by the St. Louis Cardinals from the Washington Senators for $5,000.

Before 1902 Season: Jumped from the St. Louis Cardinals to the Baltimore Orioles.

July 17, 1902: Released by the Baltimore Orioles. (Date given is approximate. Exact date is uncertain.)

July 17, 1902: Signed as a Free Agent with the New York Giants. (Date given is approximate. Exact date is uncertain.)

Charlie Hickman

March 22, 1900: Purchased by the New York Giants from the Boston Beaneaters.

December 16, 1901: Jumped from the New York Giants to the Boston Americans.

June 3, 1902: Purchased by the Cleveland Bronchos from the Boston Americans.

August 7, 1904: Traded by the Cleveland Naps to the Detroit Tigers for Charlie Carr.

July 6, 1905: Purchased by the Washington Senators from the Detroit Tigers.

Jimmy Collins

February 11, 1901: Jumped from the Boston Beaneaters to the Boston Americans.

Ernie Courtney

August, 1902: Released by the Boston Beaneaters.

August 13, 1902: Signed as a Free Agent with the Baltimore Orioles. (Date given is approximate. Exact date is uncertain.)

June 10, 1903: Traded by the New York Highlanders with Herman Long to the Detroit Tigers for Kid Elberfeld.

October, 1903: Traded by the Detroit Tigers with Rube Kisinger, Sport McAllister and either Yeager or Lush to Buffalo (Eastern) for Cy Ferry and Matty McIntyre.

Chick Stahl

March 4, 1901: Jumped from the Boston Beaneaters to the Boston Americans.

Honorable Mention

The 1977 Atlanta Braves 

OWAR: 40.5     OWS: 283     OPW%: .470     (76-86)

AWAR: 19.9     AWS: 182     APW%: .377   (61-101)

WARdiff: 20.6                        WSdiff: 101  

The “Original” 1977 Braves featured Mickey Rivers, who supplied a .326 BA and registered career-highs with 12 four-baggers and 69 ribbies. “Mick the Quick” slumped in the stolen base department, succeeding on only 22 of 36 attempts after averaging 48 steals in three preceding campaigns. Dusty Baker crushed 30 round-trippers and plated 86 baserunners. Bill “Weaser” Robinson (.304/26/104) produced personal-bests in the Triple Crown categories. “The Roadrunner”, Ralph Garr, fashioned a .300 BA and socked 29 doubles. Ron Reed delivered 7 wins, 15 saves and a 2.75 ERA, primarily as a late-inning reliever. Phil “Knucksie” Niekro’s 16-20 record, 330.1 innings pitched and League-high 262 strikeouts are tallied for the “Original” and “Actual” Braves. Jeff Burroughs paced the “Actuals” with 41 jacks and 114 ribbies.

On Deck

What Might Have Been – The “Original” 1908 Cardinals

References and Resources

Baseball America – Executive Database

Baseball-Reference

James, Bill. The New Bill James Historical Baseball Abstract. New York, NY.: The Free Press, 2001. Print.

James, Bill, with Jim Henzler. Win Shares. Morton Grove, Ill.: STATS, 2002. Print.

Retrosheet – Transactions Database

The information used here was obtained free of charge from and is copyrighted by Retrosheet. Interested parties may contact Retrosheet at “www.retrosheet.org”.

Seamheads – Baseball Gauge

Sean Lahman Baseball Archive


What Is Wrong With Adam Wainwright?

Adam Wainwright is the star of the St. Louis Cardinals pitching staff and one of the best aces in the majors. The righty has 121 wins, a 3.04 career ERA, 1,335 strikeouts and four top-three Cy Young finishes under his belt. In 2015 he started as expected, cruising. In four starts he managed to post a 1.44 ERA and a 2.05 FIP in 25 innings with 18 strikeouts and just one walk, with eight extra-base hits (35% of the hits allowed). When everything was looking promising for another dominant season, he suffered a ruptured Achilles tendon during a plate appearance against the Milwaukee Brewers on April 25th. This injury sent him to the disabled list until late September where he just got the chance to pitch another three innings.

Before the start of this season his name was part of lots of baseball discussions: Which Adam Wainwright should we expect? The ace? Or will he show declining signs due to the long ride on the DL, his 34 years and 500+ innings in the last two seasons? The numbers speak by themselves: A 7.25 ERA, 4.87 FIP in 22.1 innings with just nine strikeouts and 10 walks, with 13 extra-base hits (45% of the hits allowed). A complete disaster if we compare this start with last April.

Those facts led us to the question: What is wrong with Adam Wainwright? Using the data sample of April 2015 and 2016 we will try to figure out the reasons behind this horrible start of the season and what should be the changes that could help Waino get back on track.

Pitch velocity and movement

The first reason that jumped to my mind was that he may be having trouble with the speed of the fastball or break of his nasty curveball. I went to Brook Baseball to check this values and compare April’15 with April’16.

Picture

​Using the four starts of last year, Waino’s fast pitches were the four-seamer, the sinker and the cutter, averaging 90.3 MPH, 90.4 MPH and 86.4 MPH respectively. Contrary to my first hypothesis, the speed chart on 2016’s April did not show any significant variance averaging 90.8 MPH, 90.3 MPH and 87.1 MPH. If anything, he is throwing faster. What about the breaking stuff? During 2015 the nasty curveball and the changeup average were 75.4 MPH and 83.7 MPH, values that are really similar to what we have seen this year: 75.4 MPH and 83.5 MPH.

We can conclude with this data that the speed is not an issue, but what do the numbers say about the ball’s movement? All his pitches were showing very similar vertical and horizontal movement compared to last year data and the career normal of Adam Wainwright. These means that the first hypothesis has to be dismissed, the power on his fast pitches and the break on the slow ones is still there.

Location and control

Other potential cause of the bad start of the season could be the location of Adam’s pitches and his control of them. A good way to visually understand the location of his pitches is using a heat map over the K-Zone. The darker the color, the biggest the frequency. To generate the great graphs that you can see below I used the PITCHf/x tool from Baseball Savant, posting side-by-side the career, 2015 and 2016 values.

Picture

The heat maps really help to get quick answers. Let’s start with the four-seamer. We can clearly see that during this season the dark cluster is located up in the zone. Compared to his career profile Wainwright is locating the fastball higher than his typical zone, something that is not a good sign for a pitcher that only throws it at 90 MPH and depends so much on control to minimize damage.

Picture

The case of the cutter is similar: low control of the pitch. 2016 graph shows a problem locating this pitch in the strike zone. The career profile indicates that he likes to throw this pitch down and outside for RHB and down and in for LHB, something that have been difficult this season when the cutter is also falling higher that normal.

Picture

Picture

In the case of the sinker I split the heat maps between lefties and righties since this specific pitch is used very differently by Waino depending on the batter handedness. Against lefties the heat maps show that he is following his typical profile, so there should not be a problem.  Meanwhile against righties Wainwright has been having troubles locating this pitch outside in the zone as he is used to. This year, lot of the sinkers against righties has been located in the center of the plate many times, low in the zone, but still in an area that MLB batters can crush easily.

Picture

Exactly the same thing happens when we see the curveball graphs. Career data showed that he has been really successful hitting the low part of the strike zone, especially last year when this pitch was falling in the ideal place, just below the K-zone frame. But this year the story have changed. The curveballs has been located higher than ever, in the hitter power zone.

There is no doubt that Wainwright in this season is having a hard time controlling his pitches, especially falling up in the zone with the fast ones and right in the middle with the breaking ones. He is showing significant differences with his career profile that could be a direct cause of the bad start of 2016.

Pitch mix

The speed and break are still there. The location not so much. So what about the approach to the at-bats? Is it similar or has he changed it due to the lack of control of his pitches? Let’s try to answer this question using data of his pitch mix and the results of balls in play comparing Wainwright’s career profile with the 2016 sample data.

As you can see in the table below, two things needs to be addressed: First, this season he largely ditched his sinker (-9%) in favor of more cutters (+8%) and curves (+4%). Second, the ground balls have dropped dramatically (-10%), leading to an increase in fly balls (+9%) and line drives (+1%). Why such a change in Waino’s approach to the plate?

Picture

There are quick conclusions. The sinker is an excellent groundball pitch, so obviously if you use less sinkers, you get less groundballs. But as we saw in the previous section of the article, Wainwright is having tons of problems with the location of his sinker: the majority of this pitches stay on the hitter-friendly zone, resulting in an increase of the line-drive percentage (+17%) and a .500 batting average on balls in play.

As if it were not enough with the sinker issues, the high location of his four-seamer is causing 18% more fly balls and 24% less ground balls. This critical situation left just one option of the fast-pitch arsenal of Wainwright: the cutter. As his last resource he increased the use of it 8% and some results have been good. It’s the only one that has an increase in ground-ball percentage (+4%) and a drop in fly-ball percentage (-12%). Nevertheless the resulting average of balls in play is .400, so please don’t take this as a silver bullet. Remember that we also pointed out previously that the control on the cutter has not been the best.

The other pitch that has been favored this season is the curveball. Although the rate of whiffs has dropped from a career average of 17% to only 9% and the fly balls (+11%) have increased significantly, the opponents only average .118 against the curve. This is really impressive especially after we analyzed the bad location of this pitch, but he keeps using it since it is the only pitch that is giving good results.

Conclusion

Even with a small sample of 2016 data we can derive some conclusions: The arm power and the movement on Adam Wainwright’s five pitches is still there. The long rest due the injury, the 500+ innings from 2013 to 2015 and his 34 years do not seem to be a problem right now. The problem seems to be in the location of his pitches. The four-seamer high in the zone and the sinker in the middle of the plate have been destroyed by the batters, reducing the ground balls in a dramatic way and increasing the line drives and fly balls.

Wainwright is clearly trying to make adjustments in order to reduce the damage. For now his nasty curve is saving the day being his only effective pitch even when it has been located in a dangerous zone. The cutter is not helping enough so his focus should be in taking back the control of the location of the pitches. In his last outing he showed some positive signs. Let’s see what happens in the next one against Arizona — if we get more of the ace or if he still struggles to get back to track.


Waiting On an Ace: Jimmy Nelson

I love pitching prospects. Not that I can back this statement up, but I believe pitchers make a more immediate impact on a fantasy roster than hitters. So, each year I stack my “Watch List” with young pitchers that might get called up in September, have a good shot of getting called up in June and potential breakout sleepers. Four years ago, one such player was Jimmy Nelson. How could a man that stands 6-6 at 245 lbs. not be on the radar? I watched with eager anticipation at all those strikeouts. That was four years ago and not much has changed. Both the Brewers and I seem to be in the same boat — waiting on Jimmy Nelson.

At one point, Nelson was the number one prospect in the Brewers’ organization. His fastball and slider were scouted as plus pitches and as such, Nelson was touted as a middle-of-the-order pitcher with potential to move up with the development of a third pitch. He was drafted in the 2nd round, 64th overall and is still just 26 years old. His aforementioned size gives him the frame to tax his arm with 200-plus innings each year. Plainly put, Nelson has the pedigree to be a stud and clearly the Brewers thought so too. Why then are we waiting three years into Nelson’s MLB career?

About 16 months ago, Mike Newman wrote about Nelson’s rising stock. That was prior to a year when Nelson had somewhat of a breakout campaign, going 11-13 with a 4.11 ERA and a 19.7 K%. If you recall he seemed to put things together in July to the point of striking out 32 in 33 IP with a sizzling 1.61 ERA. That’s when everyone jumped on board and expected big things in my fantasy league (10-team mix league, five keepers, deep rosters, 12 years running). July ended, however, and Nelson fizzled with the fading temperatures in 2015. His stock was mixed heading into this year (ADP 211, Yahoo!). It’s a new year now and the temps are starting to rise again. Will Nelson resurface as the potential ace he showed last July?

Last year Jimmy Nelson introduced a curveball to his arsenal, and it was good. The story on Nelson is that he always lacked confidence in his third pitch, the changeup. In the early going Nelson rarely threw that pitch. In order to get lefties out and develop into an ace Nelson needed a third pitch he was not only confident in but that could develop into a plus pitch. Maybe the curve was just what the doctor ordered. His pitch distribution looks like this.

In 2015, Nelson offered his newly-found curve 21% of the time while keeping his plus slider around (17%). 2016 seems to be a different story to this point. Nelson is throwing his fastball much more often and his off-speed pitches less, basically ditching the change all together. This has had two results: hitters are swinging less and making more contact. Z-contact% is creeping up to scary levels (93%).

Worse, so far, hitters are being patient with Nelson. It seems when Nelson goes outside the zone, hitters are laying off.

To summarize, hitters are swinging less at pitches, both inside and outside the zone, and making more contact, both inside and outside the zone, than ever before against Nelson. This is not a good sign. Dating back to Nelson’s early days, he has displayed control issues. What happens when hitters become patient against a pitcher with historic control issues? His walk rate increases.

Jimmy Nelson is progressing in the wrong direction. Hitters have adjusted to his curve and slider, they are being more patient, and they are making more contact. While Nelson’s K% has not dropped dramatically, his BB% is trending in the wrong direction. As a result his K-BB% is at an all-time high (in both the major and minor leagues).

I have something to confess. Prior to researching Jimmy Nelson I attempted to trade him in my fantasy league. To multiple teams. Multiple times. Here were my selling points: Pedigree, development of a third pitch and progression. So far this year Nelson has a 3.46 ERA, a 3-1 record, and he is still striking guys out at 17.9%. On the surface it looks like he is pitching to more contact and inducing weaker contact when he does; his 24.7% soft-contact rate is up from 19.2% last year.

One could be optimistic about this. I am not, however. His ERA is being supported by a .225 BABIP and a crazy 90% strand rate. Worse, pitching to contact is not a good strategy when fly-ball percentage is also trending in the wrong direction; up to 35% from 29% last year.

To wrap this lengthy post up I have several concerns with Jimmy Nelson. He’s always been known for having control issues and it seems he has not improved that yet. He’s developed a third pitch but is refusing to throw his plus slider and curveball more often. He’s inducing more contact but that contact is in the air. I am not searching for a way to “fix” Jimmy Nelson. His velocity seems to be consistent, perhaps just a tick down. His mechanics seem fine. There are no injuries to report. Rather, this post is about waiting on the ace that the Brewers thought they had. If that ace is going to emerge, Nelson is going to have trust in his slider and curve as he did in July of 2015. He’s going to have to find a way to induce more swings outside the zone. As it stands now, he is living dangerously inside the zone and will eventually run into major problems when those stranded runners come around to score as his BABIP rises. As deep as our fantasy league is, he still might be able to be moved. More than likely, however, he’ll remain what he has been — a middle- to back-end-of-the-rotation arm both in fantasy and real baseball.


The Case For Jake Arrieta as the Most Dominant Pitcher of All Time

C.R.A.P.  It’s a fairly modern affliction that affects a great deal of people like you and me — and by ‘you and me’ I mean internet users.  It’s clear that the internet, like all of mankind’s greatest achievements, is not without drawbacks.  Never before have we been so connected, and never before have we heard the terms: Athazagoraphobia (Fear of missing out), ‘Paradox of Choice’, and ‘Intellectual Technologies’ (just Google it — because I can’t remember what it means).  The level of connectedness is so intense that on a day-to-day basis, I feel like I meet people whose personalities are plagiarized patchworks of charismatic, yet ill-informed internet voices (myself included).  And then, of course, there’s C.R.A.P., which stands for Combative Responses to Antipodal Posts.  An amusing component of C.R.A.P. is the ferocity with which contrary opinions are met with online; I have experienced 30 years of life and not once have I heard strangers communicate with each other in the manner that they do in the comments section of baseball blog posts on the internet.

To be clear, I’m not completely condemning the common vernacular found in said comments sections, because debate and conversation simply happen differently when we’re responding to a pun that’s a screen name rather than a face with eyes.  On Thursday, the 21st of April, Jeff Sullivan wrote a piece titled, The Case for Noah Syndergaard as Baseball’s Best Pitcher, and the comments section is littered with people who suffer from C.R.A.P.  In my opinion, if you actually read the article, you’d be able to tell that Jeff isn’t declaring Syndergaard the best pitcher, but based on his stuff and recent results, there’s definitely a case for it, hence the title.  Essentially, I think Jeff is saying that it’s possible Syndergaard is taking that step, and he’s open to the idea.  Jeff did a great job (as always, thank you, Jeff) as evidenced by reactions to the article.  He got us thinking and he got us discussing — some of us liked what Jeff had to say and some of us clearly weren’t receptive to the idea.  At all.  To his credit, Jeff did exactly what he’s supposed to do.

Now before we nosedive into the reasoning behind the outlandish title of this article, I want to get a few things out of the way: First and foremost, I’m sorry for throwing gasoline on an already raging fire.  Second, I think Clayton Kershaw is the best pitcher in baseball because of his sustained dominance (1.98 ERA over his last 1066.1 IP).  Certainly that doesn’t mean that pitchers can’t be better than Kershaw for a period of time, however, it’s just that while others rise and fall to his level, Kershaw remains.  And finally, I think Pedro Martinez is the best pitcher of all time.  That’s partly because I was born in 1985, and partly because I read it on the internet.  Mentioning Pedro is a good time to tie back into Jeff’s article.  To quote:

…Right now, in 2016, Syndergaard has a 23 ERA- and a 22 FIP-, through three starts…

Believe it or not, Kershaw has 37 three-start stretches with an ERA- no higher than 23. He has just seven three-start stretches with an FIP- no higher than 22. What Syndergaard is doing, Kershaw has done several times. But it’s not like this is Kershaw’s resting level. And Syndergaard is just as much about the scouting as he is about the stats.

That 23 ERA- just happens to be the number I was looking for.  During his peak (97 – 03), Pedro was preposterously good, posting a K-BB% of 26.1%, a 47 ERA-, and a 52 FIP-.  The acme of his peak came in a 22-game stretch spanning the 1999-2000 seasons when he posted an ERA- of 23 and an FIP- of 33.  His K-BB% was an unruly 34%, and he allowed just 95 hits in 168.1 IP.  Marvel at the overall line: 

August 3, 1999 – June 14, 2000

GS IP TBF H R ER HR BB K ERA WHIP FIP GSv2 K-BB% ERA- FIP-
22 168.1 635 95 25 21 7 31 247 1.12 0.75 1.51 84 34.0% 23 33

Again, that 23 ERA- is what I’m focusing on because it’s the number we saw in Mr. Sullivan’s article.  I could not find a better or equal stretch of dominance, based on ERA-, over 22 games, than Pedro’s going back to 1969…until Jake Arrieta.  Looking at only regular-season games, dating back to July 2nd of 2015, Arrieta has produced that magic 23 ERA- number we’re looking for:

July 2, 2015 – April 21, 2016

GS IP TBF H R ER HR BB K ERA WHIP FIP GSv2 K-BB% ERA- FIP-
22 162 590 84 19 16 4 31 159 0.89 0.71 2.12 75 21.7% 23 55

For those of you who prefer FIP I say leave your C.R.A.P. in the comments section, because as we gain more data, we learn that pitchers have some modicum of control over the quality of contact they allow, and at this point it’s probably safe to say that Jake Arrieta is a proven FIP-beater, even if he’s earned this title in less time than it takes others.  But Arrieta’s streak is now actually at 24 starts in the regular season, and two of those have been no-hitters.  His line:

June 21, 2015 – April 21, 2016

GS IP TBF H R ER HR BB K ERA WHIP FIP GSv2 K-BB% ERA- FIP-
24 178 647 91 20 17 4 33 173 0.86 0.70 2.09 76 21.6% 22 54

Pop the confetti!  Blow your vuvuzelas! Or Tweet!  That 22 ERA- is something we’ve never seen over such a large quantity of starts (at least going back to 1969 — and at least with my hack-job research)!

What this means in the scope of baseball’s long history isn’t nothing.  It’s a marvelous line.  Of course, it is just one number I’m looking at, and ERA-, like the internet, is not without flaws.  It’s arguable and perhaps even likely that Pedro’s line, with that 34.0% K-BB%, is more impressive (that mark was 293% better than league average — lolz).  But Arrieta has two no-hitters.  However, if we look at quality of opponents, well, Pedro’s line becomes more impressive because the teams he squared off against combined for an average wRC+ of 102, whereas Arrieta’s opponents averaged 94 wRC+.

Dave Cameron wrote an article about Arrieta’s ability to control the quality of contact he allows, and as we learn more about this skill, perhaps we’ll revere it a little more — never as much as strikeouts, but definitely more than we do now.  One of Jeff’s points about Syndergaard is that he undoubtedly has the arsenal and command to become the game’s top arm.  Arrieta has legit weaponry as well, but I don’t think anything we’ve ever seen from a starter matches what Syndergaard is throwing.  We know Arrieta’s story up to this point, which makes his sudden-ish ascent to a level where he can put a streak together like the one he’s on more interesting, if not more impressive.  What he does from now until the end of his career will go a long way in determining the weight this current streak holds.  If he flames out, or loses his ability to induce weak contact, it will be seen as a lucky blip; but if he rallies off another few years of 5 – 8 WARs and 50 ERA-es, then we’ll feel better about objectively putting his streak into an historical perspective.  As of right now, even despite his current run, I’m nowhere near putting Arrieta’s name in with the all-time greats (yes, the title was click-bait, spare me the C.R.A.P.), but, like Jeff in regards to how he feels about Syndergaard, but to a lesser extent, I’m open to it.  And that’s about as far as it goes for me — but I’m so contented to sit here and watch the debate unfold, violently, online.


The Tulowitzki Hypothesis

The hypothesis: Troy Tulowitzki has a longer reaction time to pitches than he used to.  Reaction time, in this sense, refers to the overall time it takes Tulo to decide to swing and then execute the swing.  Perhaps he is only getting slower mentally, perhaps only physically, perhaps a mix of both. Regardless the source of his decline, my hypothesis is that Tulo has been slower to react since the beginning of 2015 than he has over the rest of his career. I posit that Tulo’s decline and the league’s increase in velocity have caused him to pass a “tipping point,” which has kneecapped his production.

Now for the evidence.

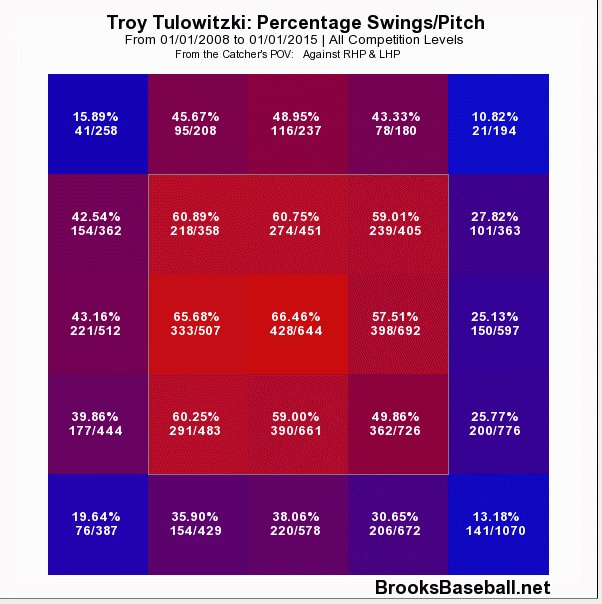
Here is a profile of Tulo’s swing rates from Brooks Baseball.  The data are from 2008-2014, before his decline.

swing per pitch

Figure 1. Swings/pitch 2008 to 2014.

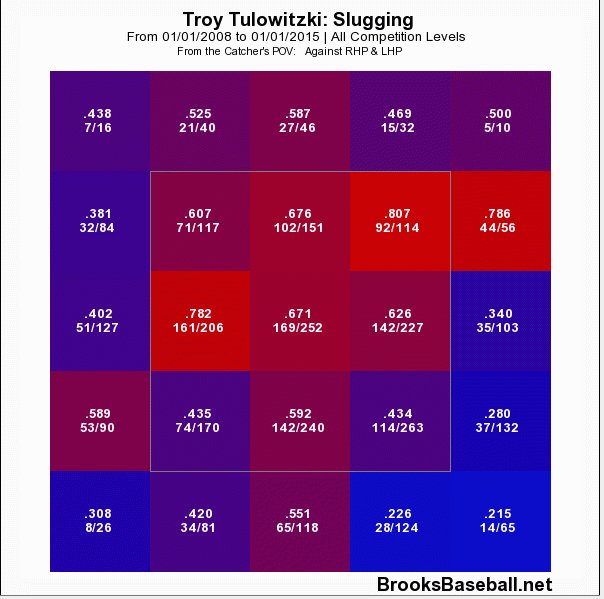
Throughout his career, Tulo has preferred to swing at pitches middle in and up in the zone.  Now consider where he did his damage.

slg pitch
Figure 2. Slugging on contact 2008 to 2014.

Again, Tulo seemed to prefer the ball up.  He was most dangerous in the top two thirds of the zone and he could cover the entire width of the plate.

Location is important because the reaction time required to hit a pitch changes depending on where it is located in the zone.  A pitch gains velocity as it moves up in the zone, or as it moves toward the hitter, while pitches are effectively slower as they move down and away. Historically, Tulo has been most dangerous on pitches in the areas of the zone that require the shortest reaction times to hit.

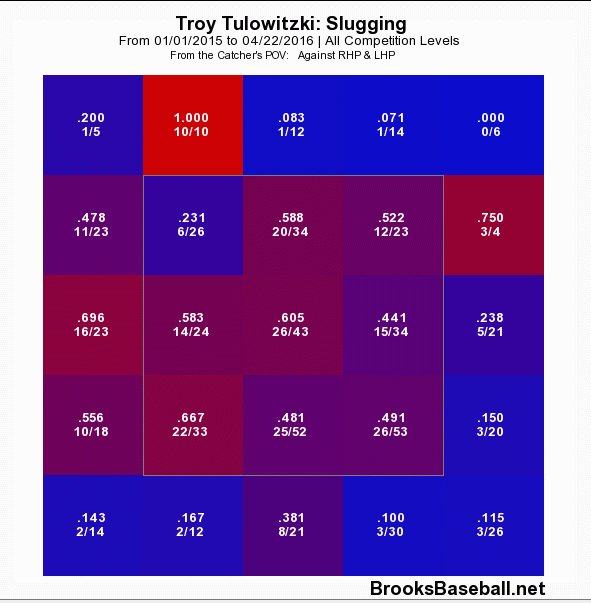
Now consider how productive he’s been since the beginning of 2015.

slg now
Figure 3. Slugging on contact 2015 to present.

Aside from the overall decline in the production in nearly all zones, it is noteworthy that Tulo’s most productive area has shifted from the top to the bottom of the zone.  From 2008 to 2014, Tulo’s production was highest in the top third, second-highest in the middle, and lowest in the bottom third.  That pattern has flipped, as now he’s most productive at the bottom of the zone and least productive at the top.

While these data are consistent with my reaction-time hypothesis, it’s also possible that Tulo has changed his approach to favour pitches down in the zone.

So let’s dig deeper.

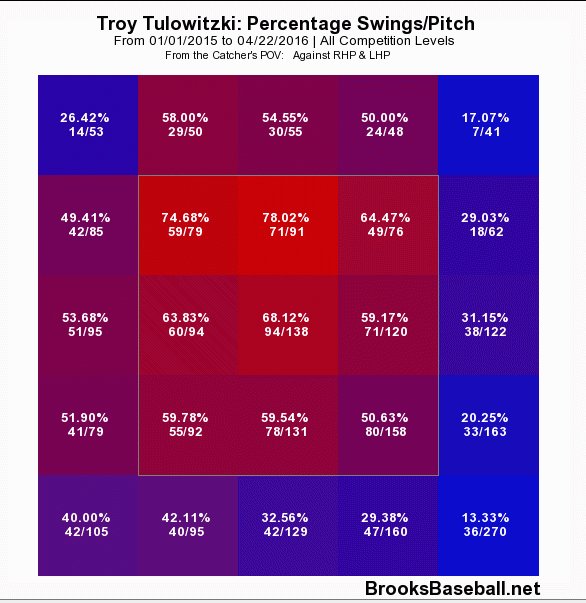
Here is a profile of Tulo’s swing rates in the past year.

swing now
Figure 4. Swing/pitch 2015 to present.

If anything, Tulo has doubled down on his up and in approach, swinging at 75% – 78% of pitches up or up and in.  Tulo is swinging much more often at high pitches, and slightly less often at low pitches.  It doesn’t appear that he switched his approach to attack the bottom of the zone.

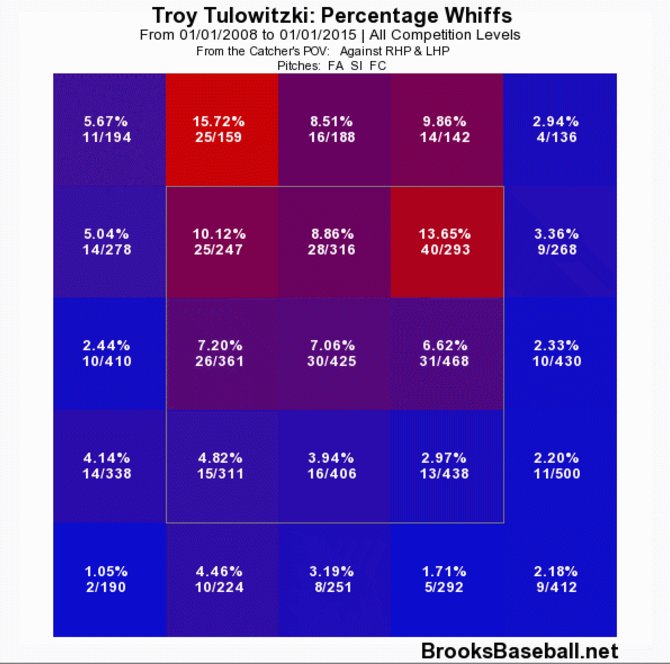
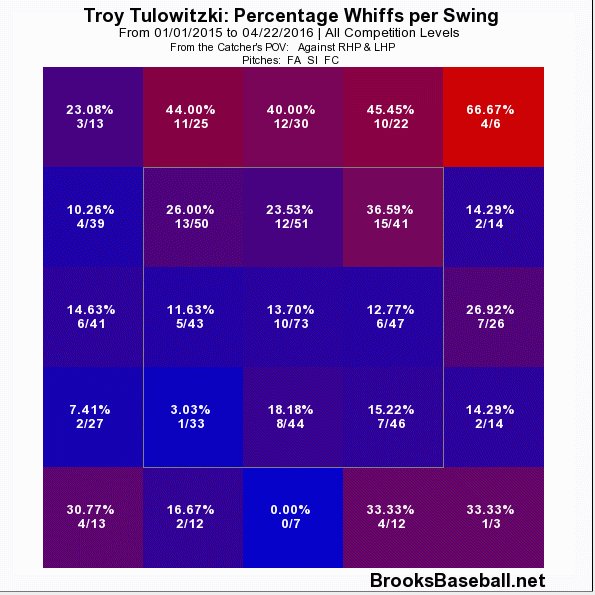
Let’s focus specifically on Tulo’s ability to make contact with the hard stuff. The two figures below show Tulo’s whiff-per-swing rates against all fastballs, the first from 2008 to 2014, the second from 2015 to present.

whiffs then
Figure 5. Whiffs/swing, 2008 to 2014.

whiffs now
Figure 6. Whiffs/swing 2015 to present.

Tulo has basically lost the ability to handle high fastballs. Historically a high-fastball killer, now Tulo can’t seem to catch up.  He swings and misses more than twice as often on fastballs in all three locations at the top of the zone. Let me spell it out: Tulo whiffs 2.57 times more often up and in, 2.77 times more middle-up, and 2.68 times more often up and away. And it gets much worse when you consider up out of the zone: He’s swung and missed 4.6 times more often at pitches on the outer third and just up out of the zone. Yikes.

While consistent with my hypothesis, swinging through high fastballs isn’t the only deficiency I’d expect if a hitter has lost some reaction-time skill.  Pitch recognition and plate discipline are also affected by a hitter’s reaction ability.

Discipline depends on a hitter’s ability to decide quickly whether a pitch is a strike or a ball. Tulo set a career high last year with an O-Swing% of 30.6%, three full points above his previous high in a season of 27.6%.  Tulo is chasing pitches outside the zone more than ever before.

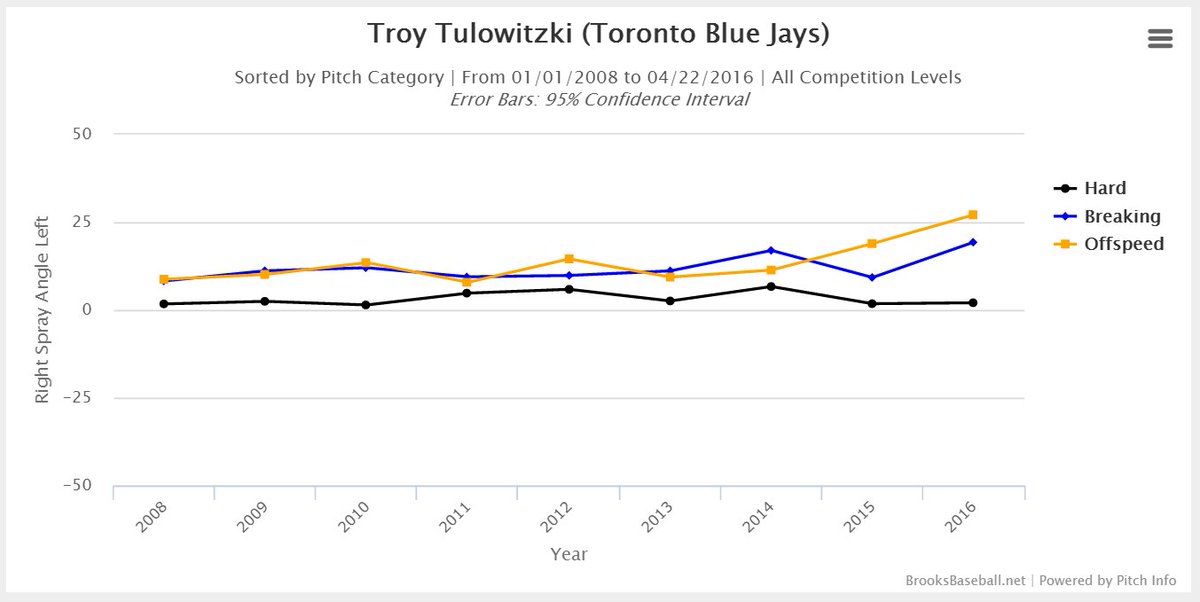
Pitch recognition depends on a hitter’s ability to recognize pitch type in time to adjust his swing. Here is a chart of Tulo’s average spray angle as a function of pitch type.  Spray angle indicates the direction (left field to right field) that balls are hit on average.  Thus, the more positive the average spray angle the greater the tendency to pull that pitch type.  As you can see, Tulo has historically hit breaking balls and off speed pitches with the same spray angle, suggesting that he was able to recognize and wait back equally well for both pitch types.

spray angle
Figure 7. Average spray angle by pitch type, 2008 to present (short seasons in ’12, 14, and ’16).

In 2015 and onward, Tulo has been pulling offspeed pitches much more than breaking balls. The result (which I won’t bother to show you graphically), has been an abundance of roll-over ground balls against offspeed pitches.

Breaking balls are easier to recognize out of a pitcher’s hand than offspeed pitches. So while Tulo is still able to use the earliest information to make an adjustment, he seems unable to make use of later trajectory and spin information that would allow him to recognize and adjust to offspeed pitches.

Maybe this is because his response speed to the later information has slowed, or maybe it’s because Tulo is committing to his swing too early to make the adjustment.  I would guess the latter.

So in summary, the reaction-time hypothesis is supported by evidence suggesting Tulo is most vulnerable when the required reaction time is shortest, he is less able to recognize pitch location in time to lay off, and he is no longer able to adjust to offspeed pitches as well as breaking balls.

A POSSIBLE SOLUTION

I’m a Jays fan and a Tulo fan so I won’t be ending this post with a “Tulo’s washed up” conclusion.  I watch this guy almost every day.  He’s still got the athleticism, the power, the hand-eye, and the swing. That said, the data have me convinced that he needs to make an adjustment.  The first thing I’d try is almost embarrassing to suggest, but I’ll suggest it anyway.  Tulo should swing a lighter bat.

Hear me out. Tulo just turned over the wrong side of the aging curve – especially for a shortstop – and meanwhile the league is throwing faster than ever.  He used to have success with an approach that requires superhuman abilities, and now that he is slightly less superhuman, that approach isn’t working.  Perhaps changing the swing weight of his bat, shaving off an ounce, could allow him to catch up to the pitches he’s not getting to and return him to some semblance of his previous form.

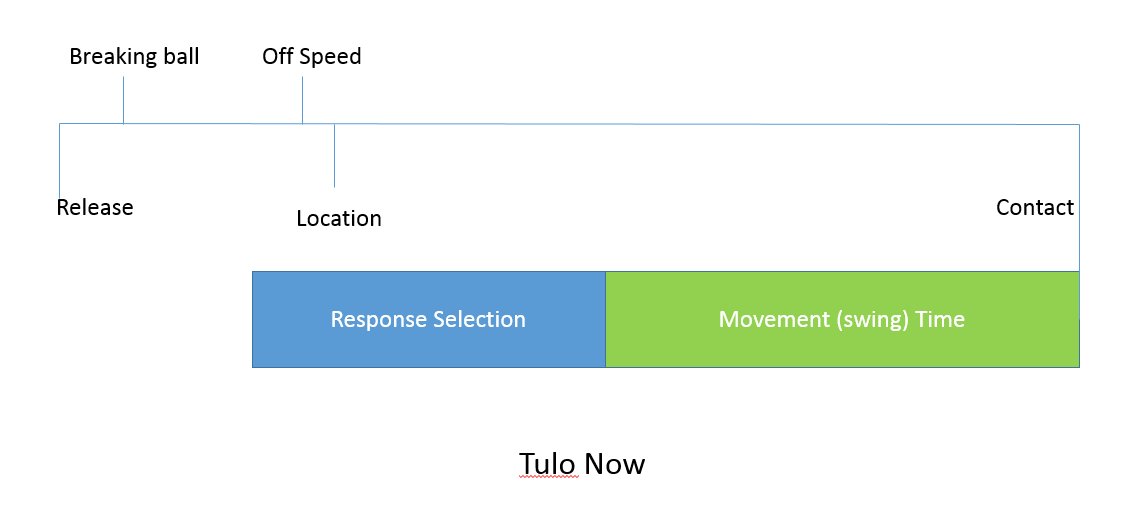
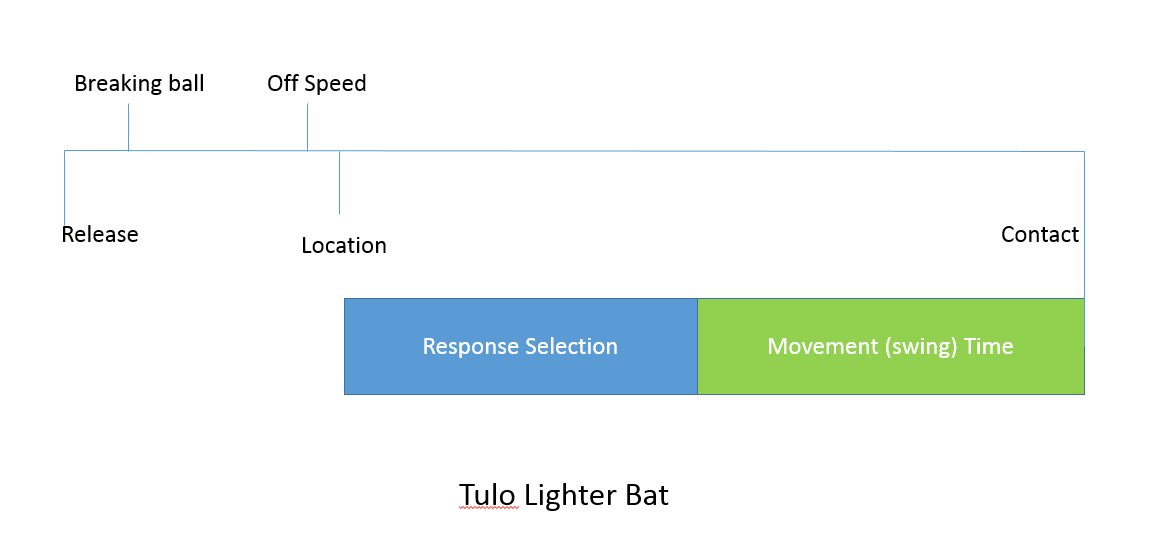
Take a look at the two schematics below (conceptual, not to scale). The full line from Release to Contact represents the timeline of the pitch.  The lines for “Breaking ball,” “Offspeed,” and “Location,” represent the moments when the hitter finally has enough information to process these respective features of the pitch.  Hitters recognize pitch type before location and breaking balls before changeups.  The coloured bars represent the time required to execute the cognitive and physical aspects of the swing.  The decision to swing must be completed by the beginning of the blue bar (response selection), in order for the brain to have enough time to make the necessary commands (response selection) and execute the swing (movement time).

My hypothesis suggests that the length of one or both of the coloured bars has increased for Tulo, while the length of the entire timeline has shortened for him (and everyone else).  I propose that both factors have pushed the blue bar to the wrong side of the deadlines for offspeed and location, causing Tulo to swing at more balls and fail to recognize changeups in time to adjust. The longer reaction time leaves Tulo vulnerable against hard stuff up and in, yet that’s exactly where Tulo made his money throughout the rest of his career. The “Tulo Now” schematic represents things since 2015, while the “Tulo Lighter Bat” figure depicts my proposed solution.

tulo now

tulo light bat

I’m not sure if anything can be done about a longer response selection time, but my hope is that a lighter bat could reduce Tulo’s movement time enough to get him back to the right side of those offspeed and location deadlines.  If Tulo can’t shorten his overall response time, he’s not going to be able to approach the game the same way he has for the rest of his career.  He’ll need to start looking down, looking away, and spitting on high fastballs.  Basically, he’d need to give up on what made him great.

I know trying a new bat might be a hard sell for a guy who won’t give up his 100-year-old beaver tail of a mitt, but I think changing bats might be easier than changing everything else. Including a swing that still looks fantastic.


Hardball Retrospective – What Might Have Been – The “Original” 1919 Athletics

In “Hardball Retrospective: Evaluating Scouting and Development Outcomes for the Modern-Era Franchises”, I placed every ballplayer in the modern era (from 1901-present) on their original team. I calculated revised standings for every season based entirely on the performance of each team’s “original” players. I discuss every team’s “original” players and seasons at length along with organizational performance with respect to the Amateur Draft (or First-Year Player Draft), amateur free agent signings and other methods of player acquisition.  Season standings, WAR and Win Shares totals for the “original” teams are compared against the “actual” team results to assess each franchise’s scouting, development and general management skills.

Expanding on my research for the book, the following series of articles will reveal the teams with the biggest single-season difference in the WAR and Win Shares for the “Original” vs. “Actual” rosters for every Major League organization. “Hardball Retrospective” is available in digital format on Amazon, Barnes and Noble, GooglePlay, iTunes and KoboBooks. The paperback edition is available on Amazon, Barnes and Noble and CreateSpace. Supplemental Statistics, Charts and Graphs along with a discussion forum are offered at TuataraSoftware.com.

Don Daglow (Intellivision World Series Major League Baseball, Earl Weaver Baseball, Tony LaRussa Baseball) contributed the foreword for Hardball Retrospective. The foreword and preview of my book are accessible here.

Terminology

OWAR – Wins Above Replacement for players on “original” teams

OWS – Win Shares for players on “original” teams

OPW% – Pythagorean Won-Loss record for the “original” teams

AWAR – Wins Above Replacement for players on “actual” teams

AWS – Win Shares for players on “actual” teams

APW% – Pythagorean Won-Loss record for the “actual” teams

Assessment

The 1919 Philadelphia Athletics

OWAR: 33.3     OWS: 224     OPW%: .381     (53-87)

AWAR: 9.0       AWS: 107     APW%: .257   (36-104)

WARdiff: 24.3                        WSdiff: 116.4  

The “Original” 1919 Athletics outperformed the “Actual” squad by 17 victories with a staggering WSdiff of 116.4. The “Actuals” were reduced to a shadow of their former dynasty due to a variety of factors, primarily financial. The “Originals” featured second-sacker Eddie Collins (.319/4/80), the League-leader with 33 stolen bases. “Shoeless Joe” Jackson supplied a .351 BA with 31 doubles, 14 triples and 96 ribbies in his penultimate season. Their counterparts, Whitey Witt (.267/0/33) and Merlin Kopp (.226/1/12) were barely adequate. In addition to left field and second base, the “Originals” surpassed the “Actuals” at catcher and third base. Wally Schang furnished a .306 BA and pilfered 15 bags while Steve O’Neill contributed a .289 BA with 35 doubles. Home Run Baker (.293/10/83) bested Fred Thomas (.212/2/23) at the hot corner.

Eddie Collins placed runner-up to Joe Morgan in the All-Time Second Basemen rankings according to Bill James in “The New Bill James Historical Baseball Abstract.” “Original” Athletics teammates listed in the “NBJHBA” top 100 rankings include Baker (5th-3B), Jackson (6th-LF), Wally Schang (20th-C), Jimmie Dykes (52nd-3B), Steve O’Neill (54th-C), Stan Coveleski (58th-P), Stuffy McInnis (68th-1B), Charlie Grimm (85th-1B), Joe Dugan (88th-3B), Jack Barry (90th-SS), Bob Shawkey (95th-P) and Amos Strunk (100th-CF). George H. Burns (79th-1B) and Terry Turner (92nd-SS) round out the roster for the “Actuals”.

  Original 1919 Athletics                                                       Actual 1919 Athletics 

STARTING LINEUP POS OWAR OWS STARTING LINEUP POS OWAR OWS
Joe Jackson LF 3.37 30.69 Merlin Kopp LF 0.59 3.19
Amos Strunk CF -1.59 5.71 Tillie Walker CF 0.87 9.67
Eddie Murphy RF 0.69 3.38 Braggo Roth RF 0.64 7.11
Stuffy McInnis 1B 1.07 12.03 George H. Burns 1B 1.56 11.67
Eddie Collins 2B 4.1 27.48 Whitey Witt 2B -0.35 7.01
Joe Dugan SS -1.51 6.12 Joe Dugan SS -1.51 6.12
Home Run Baker 3B 1.57 19.36 Fred Thomas 3B -3.09 3.74
Wally Schang C 4.41 18.95 Cy Perkins C 0.96 8.98
BENCH POS OWAR OWS BENCH POS AWAR AWS
Morrie Rath 2B 4.18 21.36 Wickey McAvoy C -0.77 2.93
Steve O’Neill C 2.02 16.7 Red Shannon 2B -0.23 2.69
Cy Perkins C 0.96 8.98 Dick Burrus 1B -1.09 1.53
Val Picinich C 0.79 7.27 Ivy Griffin 1B -0.04 1.26
Whitey Witt 2B -0.35 7.01 Al Wingo LF -0.08 1.17
Rube Bressler LF -0.08 5.96 Amos Strunk RF -1.35 1.02
Wickey McAvoy C -0.77 2.93 Terry Turner SS -1.06 0.95
Charlie Grimm 1B 0.27 1.81 Chick Galloway SS -0.93 0.63
Jack Barry 2B 0.03 1.68 Lena Styles C 0.02 0.54
Dick Burrus 1B -1.09 1.53 Jimmie Dykes 2B -0.28 0.36
Fred Lear 1B -0.05 1.48 Frank Welch CF -0.31 0.22
Ivy Griffin 1B -0.04 1.26 Art Ewoldt 3B -0.24 0.19
Al Wingo LF -0.08 1.17 Roy Grover 2B -0.4 0.17
Lew Malone 3B -0.82 1.01 Johnny Walker C -0.11 0.12
Dave Shean 2B -1.25 0.88 Snooks Dowd 2B -0.18 0.06
Chick Galloway SS -0.93 0.63 Charlie High RF -0.46 0.04
Lena Styles C 0.02 0.54 Lew Groh 3B -0.06 0.01
Claude Davidson 3B 0.08 0.41 Bob Allen CF -0.25 0.01
Jimmie Dykes 2B -0.28 0.36
Roy Grover 2B -1.16 0.32
Frank Welch CF -0.31 0.22
Gene Bailey RF 0.02 0.2
Art Ewoldt 3B -0.24 0.19
Johnny Walker C -0.11 0.12
Charlie High RF -0.46 0.04
Lew Groh 3B -0.06 0.01
Bob Allen CF -0.25 0.01
Lee King LF/SS -0.01 0

Stan Coveleski averaged 23 victories per season over a four-year stretch (1918-1921). “Covey” delivered a 24-12 mark with a 2.61 ERA for the “Originals” staff. Bob Shawkey fashioned a 2.72 ERA and a 1.186 WHIP to complement his 20-11 record. Herb Pennock aka “The Squire of Kennett Square” added 16 wins with a 2.71 ERA. The “Actuals” countered with Walt Kinney (9-15, 3.64), Jing Johnson (9-15, 3.61), Rollie Naylor (5-18, 3.34) and Scott Perry (4-17, 3.58).

  Original 1919 Athletics                                                       Actual 1919 Athletics

ROTATION POS OWAR OWS ROTATION POS AWAR AWS
Stan Coveleski SP 6.29 27.45 Walt Kinney SP 1.03 9.04
Bob Shawkey SP 3.87 23.43 Jing Johnson SP 0.79 7.49
Herb Pennock SP 2.91 15.28 Rollie Naylor SP 0.38 7.16
Elmer Myers SP 0.6 7.68 Scott Perry SP 0.96 6.52
BULLPEN POS OWAR OWS BULLPEN POS AWAR AWS
Jing Johnson SP 0.79 7.49 Tom Rogers SP -0.65 3.07
Dana Fillingim SP -0.06 7.35 Bob Geary SW -0.26 0.77
Rollie Naylor SP 0.38 7.16 Jimmy Zinn SP -0.35 0.43
Tom Zachary SP 0.15 2.78 Charlie Eckert SP -0.03 0.4
Bob Geary SW -0.26 0.77 Walter Anderson RP -0.28 0.4
Jimmy Zinn SP -0.35 0.43 William Pierson SP 0.14 0.38
Charlie Eckert SP -0.03 0.4 Socks Seibold SW -0.94 0.28
Walter Anderson RP -0.28 0.4 Dave Keefe SP 0.1 0.28
William Pierson SP 0.14 0.38 Willie Adams RP 0.03 0.18
Socks Seibold SW -0.94 0.28 Win Noyes SP -0.72 0.08
Dave Keefe SP 0.1 0.28 Pat Martin SP -0.18 0.06
Bullet Joe Bush SP -0.03 0.24 Ray Roberts SP -0.53 0.03
Pat Martin SP -0.18 0.06 Bob Hasty SP -0.28 0.02
Ray Roberts SP -0.53 0.03 Dan Boone SP -0.54 0
Bob Hasty SP -0.28 0.02 Bill Grevell SP -1.19 0
Dan Boone SP -0.54 0 Mike Kircher RP -0.36 0
Dave Danforth RP -2.18 0 Harry Thompson RP -0.28 0
Bill Grevell SP -1.19 0 Mule Watson SP -0.33 0
Mike Kircher RP -0.36 0 Lefty York SP -0.86 0
Mule Watson SP -0.33 0
Harry Weaver SP -0.49 0
Lefty York SP -0.86 0

Notable Transactions

Shoeless Joe Jackson

July 30, 1910: the Philadelphia Athletics sent Shoeless Joe Jackson to the Cleveland Naps to complete an earlier deal made on July 23, 1910. July 23, 1910: The Philadelphia Athletics sent a player to be named later and Morrie Rath to the Cleveland Naps for Bris Lord.

August 21, 1915: Traded by the Cleveland Indians to the Chicago White Sox for a player to be named later, Ed Klepfer, Braggo Roth and $31,500. The Chicago White Sox sent Larry Chappell (February 14, 1916) to the Cleveland Indians to complete the trade.

Eddie Collins

December 8, 1914: Purchased by the Chicago White Sox from the Philadelphia Athletics for $50,000.

Home Run Baker

February 15, 1916: Purchased by the New York Yankees from the Philadelphia Athletics for $37,500.

Wally Schang

December 14, 1917: Traded by the Philadelphia Athletics with Bullet Joe Bush and Amos Strunk to the Boston Red Sox for Vean Gregg, Merlin Kopp, Pinch Thomas and $60,000.

Morrie Rath

July 23, 1910: Traded by the Philadelphia Athletics with a player to be named later to the Cleveland Naps for Bris Lord. The Philadelphia Athletics sent Shoeless Joe Jackson (July 30, 1910) to the Cleveland Naps to complete the trade.

September 1, 1911: Drafted by the Chicago White Sox from Baltimore (Eastern) in the 1911 rule 5 draft.

August 23, 1913: Purchased by Kansas City (American Association) from the Chicago White Sox.

September 20, 1917: Drafted by the Cincinnati Reds from Salt Lake City (PCL) in the 1917 rule 5 draft.

Steve O’Neill

August 20, 1911: Purchased by the Cleveland Naps from the Philadelphia Athletics.

Stan Coveleski

December, 1912: Purchased by Spokane (Northwestern) from the Philadelphia Athletics.

November 27, 1915: Sent from Portland (PCL) to the Cleveland Indians in an unknown transaction.

Bob Shawkey

June 28, 1915: Purchased by the New York Yankees from the Philadelphia Athletics for $3,000.

Herb Pennock

June 6, 1915: Selected off waivers by the Boston Red Sox from the Philadelphia Athletics.


Honorable Mention

The 1998 Oakland Athletics 

OWAR: 41.6     OWS: 306     OPW%: .510     (83-79)

AWAR: 28.7     AWS: 222     APW%: .457   (74-88)

WARdiff: 12.9                        WSdiff: 84.8  

Mark McGwire launched 70 four-baggers and drove in 147 runs for the “Original” 1998 Athletics. “Big Mac” placed runner-up in the MVP balloting while his protégé Jason Giambi (.295/27/110) completed his third season for the “Actuals”. Scott Brosius (.300/19/98) socked 34 two-base hits and earned his lone All-Star invitation as he outclassed Mike Blowers, who batted .237 with 11 dingers in his solitary campaign for the green-and-gold crew. Darren Lewis posted career-bests in runs scored (95) and RBI (63), a significant upgrade over “Actuals” center fielder Ryan Christenson (.257/5/40). Rickey Henderson, a member of the “Original” and “Actual” A’s roster in ’98, notched the American League stolen base title for the twelfth time in his career. “The Man of Steal” tallied 101 runs scored and a League-leading 118 bases on balls.

On Deck

What Might Have Been – The “Original” 1905 Beaneaters

References and Resources

Baseball America – Executive Database

Baseball-Reference

James, Bill. The New Bill James Historical Baseball Abstract. New York, NY.: The Free Press, 2001. Print.

James, Bill, with Jim Henzler. Win Shares. Morton Grove, Ill.: STATS, 2002. Print.

Retrosheet – Transactions Database

The information used here was obtained free of charge from and is copyrighted by Retrosheet. Interested parties may contact Retrosheet at “www.retrosheet.org”.

Seamheads – Baseball Gauge

Sean Lahman Baseball Archive


Predicting Pitcher Breakouts from Small Sample Sizes

Most FanGraphs readers know that even the fastest-stabilizing statistics take almost a quarter of a season to mean anything. With the availability of PITCHf/x data, we can look at individual pitch data, which can give us hundreds of data points for an individual pitcher just from one start. Instead of waiting until near the All-Star break to see if Aaron Sanchez has really made a leap forward or if the league has adjusted to Dallas Keuchel, we can use statistics that stabilize quickly (both “approach” stats and “results” stats) to guide these decisions.

The “results” stats that I used are:

  • Zone Contact%
  • Zone Whiff%
  • Zone Take%
  • Out-of-Zone Contact%
  • Out-of-Zone Whiff%
  • Out-of-Zone Take%
  • First Pitch Strike%

First, I used a regression model to create a formula that used only these statistics to produce an expected ERA (or SIERA, actually, as I wanted to filter out any BABIP and HR/FB luck).

The formula ended up as: -3.11 + (12.48 * Z-Con%) + (3.08 * Z-Take%) + (11.96 * O-Con%) – (14.19 * O-Whiff%) + (13.06 * O-Take%) – (3.46 * F-Strike%)

Using 2015 data (and only pitchers who threw more than 1,500 pitches), I get an r-squared of 0.68. I’m going to call this statistic “PD-SIERA” since it uses only plate-discipline data to produce an expected SIERA.

The PD-SIERA leaders for 2015 were:

  1. Clayton Kershaw, 2.47
  2. Chris Sale, 2.75
  3. Max Scherzer, 2.78
  4. Carlos Carrasco, 2.78
  5. Chris Archer, 2.92

The r-squared is good enough, and those names pass the sniff test, so I’m pretty comfortable that this produces a good approximation of pitcher performance.

I will use this to calculate a Results Change% (year2_PD-SIERA – year1_PD_SIERA)/(year1_PD_SIERA). For example, Drew Smyly had a 3.73 PD-SIERA in 2014 (year2) and a 2.33 PD-SIERA in April of 2015 (year1). The calculation would then be: (3.73 – 2.33) / (3.73) = +37.5%

[This number can be positive or negative to indicate a positive or negative change in results]

Now, just looking at the plate discipline statistics isn’t enough. We need to see if there was a reason for a pitcher to have a better or worse PD-SIERA than he had the previous year. PITCHf/x to the rescue again, as we can look at what I will call “approach” stats: a pitcher’s pitch mix and velocity. Since these are things almost completely under the pitcher’s control, they should stabilize quickly.

In order to calculate a pitcher’s “Approach Change%,” I calculate the change in his pitch mix + the percentage of velocity change from the previous year. An example of the calculation is below:

  • Drew Smyly, 2014 (full): 89.9 mph, 51.9% FB, 15.9 % CT, 28.5% CB, 3.8% CH
  • Drew Smyly, 2015 (April):  90.2 mph, 46.4% FB, 30.1% CT, 23.5% CB, 0.0% CH

Velocity change = (year1_velo – year2_velo)/(year2_velo) = (90.2-89.9)/89.9 = 0.3%

[If this value ended up negative, we would use the absolute value, as we are only interested in the amount of change, not positive/negative change]

Pitch Mix change = -5.5% FB, +14.2% CT, -5.0% CB, -3.8% CH = (take the absolute value of all of these changes and then divide by two) = (28.5%) / 2 = 14.3%

[Dividing by two makes sure that each percentage change is only counted once – a +1% increase in FB% combined with a 1% decrease in CH% equals only a 1% chance in pitch mix]

Approach Change% = Velocity change + Pitch mix change = 14.3% + 0.3% = 14.6%

In order to see if this formula would work for 2016, we can look backwards to see how it would have done predicting 2015 breakouts/blow-ups.

Looking at the data from 2014 (full season) to 2015 (April only), we can multiply Approach Change% * Results Change% to see if we can identify early-season breakout/blow-up candidates. The three highest rated “breakout” candidates in April 2015 were:

  1. Drew Smyly: 14.6% Approach Change%, +37.5% Results Change%… Improved SIERA from 3.69 (2014) to 3.25 (2015)
  2. Chris Archer: 13.7% Approach Change%, +36.1% Results Change%… Improved SIERA from 3.80 (2014) to 3.08 (2015)
  3. Dillon Gee: 13.4% Approach Change%, +36.6% Results Change%… SIERA increased slightly from 4.30 to 4.41 (groin injury in May, lost his rotation spot, and ended up in the minors for most of the second half)

Not bad – two of the clear top three breakout candidates actually improved their SIERA by over 10% from 2014. How about the bottom of the list? We have a clear top four:

  1. Homer Bailey: 14.2% Approach Change%, -34.7% Results Change%… SIERA jumped from 3.60 to 5.65 (injured after two starts)
  2. Jake Peavy: 21.9% Approach Change%, -14.9 Results Change%… SIERA increased slightly from 4.11 to 4.33
  3. Tyler Matzek: 23.9% Approach Change%, -13.6% Results Change%… SIERA jumped from 4.08 to 6.45 (injured after five starts)
  4. Wade Miley: 10.2% Approach Change%, -31.5% Results Change%… SIERA jumped from 3.67 to 4.24

Bailey and Matzek were both headed for season-ending injury (maybe this formula is a good predictor of an aching arm?), Miley went from above-average to below-average, and Peavy got a bit worse.

To show why we need both the Approach and Results Change%, consider these two pitchers:

  • James Shields: 5.5% Approach Change%, +26.5% Results Change%… SIERA increased slightly from 3.59 to 3.72
  • Edinson Volquez: 5.2% Approach Change%, +23.5% Results Change%… SIERA increased slightly from 4.20 to 4.35

Both pitchers had significantly better results in April of 2015 than they did in 2014, but their approach barely changed at all. As the change in results was not backed by any change in approach, they both ended up being essentially the same pitcher for the remainder of 2015 as they had been in 2014.

I’ve run the numbers for the first week of 2016, but will wait until we get about a month’s worth of data before releasing the actual numbers. For those that would like a sneak peak (caution: most of these are using ONE game’s worth of data!):

Breakout candidates: Alfredo Simon, Wade Miley, Jose Fernandez, Jacob deGrom, Noah Syndergaard, Aaron Sanchez

Blow-up candidates: Dallas Keuchel, Stephen Strasburg, Jerad Eickhoff, Chris Sale, Taijuan Walker, Masahiro Tanaka, James Shields


How the Positional Adjustments Have Changed Over Time: Part 1

Positional adjustments are a tricky subject to model. It’s obvious that an average shortstop should get more credit for defense than an average first baseman, but there are a wide variety of methods to calculate this credit. Some methods use purely offense to calculate the adjustments, while others have used players changing positions as proxy for how difficult each area is.

We’ll use a simplified version of the defense-based adjustments (which I’ll propose a change for later) for Part 1. This model looks at all players who have played two positions (weighted by the harmonic mean of innings played between the two). Then, it produces a number for how much better an average player performed at a certain position than another. After doing this for all 21 pairs of positions, we combine the comparisons into one scale, weighted by which changes happen the most often.

Example: the table below shows how all outfielders in 1961 performed when changing positions within the outfield (using Total Zone per 1300 innings):

  • LF/CF: 14.5 runs/1300 better at LF, 4028 innings
  • LF/RF: 10.4 runs/1300 better at LF, 9487 innings
  • CF/RF: 7.4 runs/1300 better at RF, 6025 innings

After weighting each transition by the number of innings, we get an estimate that the LF adjustment should be -8.3, RF should be 1.0, and CF should be 7.3. (We’re assuming that players being better at a position means that that position is easier.)

I performed this calculation for all seven field positions (1B, 2B, SS, 3B, LF, CF, RF) for all years between 1961 and 2001. While using only seasons from the same year does away with any aging issues, the big problem with this analysis is that it doesn’t adjust for experience, as very few managers, ever, send full-time first basemen to play the outfield. This experience issue will be addressed in Part 2, but for now we just have to keep it in mind.

Finally, while I could have expanded this to 2015, the difference between UZR/DRS and TZ is so massive that using both would have created a lot of error in the graphs below.

The graphs (using loess regression to smooth the yearly data):
Nothing

With yearly data:

YearlyD

With error bars:

j

Less smooth version:

k

Less smooth version with points:

l

A lot of positions have 4-run error bars, so it would be wise to take some jumps and drops with a grain of salt. However, it is interesting to note that corner outfielders (especially left fielders) appear to get much better at defense since the 1960s, while the right side of the infield has seemed to drop in quality. Also, for whatever reason, center field had a huge dip during the 1970’s.

During Part 2, I’ll analyze these graphs in depth, and propose adjustments to this simple model.