Archive for Player Analysis

Brett Gardner, Good Eye or Non-Swinger?

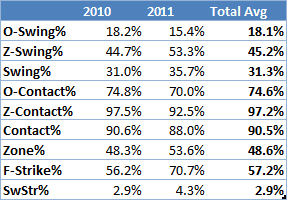
On the surface, Brett Gardner looks like a Bobby Abreu protege (without any power). Since 2010, Brett has shown off his great eye for pitches, posting the 2nd lowest chase rate in baseball at 18.1%.

His ability to make contact with pitches is also astonishing, as he makes contact with 97.2% with pitches in the strike zone, behind only Juan Pierre and Marco Scutaro. Of the 2789 pitches Brett has seen since the start of 2010, he has only swung and missed at 265 pitches.

Where Brett Gardner lacks is in his ability to swing at pitches in the strike zone. Over the last two seasons, Brett has swung at a major league low 45.2% of pitches in the strike zone. He owns this record almost 6% (next lowest is Elvis Andrus at 50.9%) and is almost 20% below the league average. Combined with his low chase rates, its only natural also that Brett has the lowest swing rate in MLB at 31.3%, compared to the league average of 45.6%.

Read the rest of this entry »


Albert Pujols or Albert Einstein?

This article was originally published on WahooBlues.com.

There’s no question that Albert Pujols is one of the greatest players in the history of Major League Baseball. As the active leader in wOBA (.434) and wRC+ (169), it’s not easy to come up with a superlative that sounds like hyperbole for Pujols. But a commenter on his stats page gave it a try last week:

ALBERT Einstein had an IQ of 160. That means he is 60% more intelligent than the average human.

Albert Pujols has a wRC+ of 177 during the past 3 seasons. That means he is 77% better at the plate than the average big leaguer.

Read the rest of this entry »


Blurred Expectations Unavoidable for Adam Lind

After an apparent breakout season in 2009, Adam Lind regressed somewhat drastically trying to follow it up in 2010. The idea of Lind being able to play left field was all but completely abandoned in 2010 and he served as the team’s primary DH for much of the season. That was a move that couldn’t be argued against heading into 2010 because his defense was well below average and he looked to have a good enough bat to bring solid value from a DH role.

That however, is not what happened last season as Lind went from being a 3.5 WAR player in 2009 to a -.3 WAR player in 2010. His health had nothing to with the drop in production either, Lind played in 150 games last year after playing in 151 in 2009. The drop came entirely from his bat as his batting runs above average fell by 40 runs, from 35.9 to -5.9. Moving almost exclusively to DH actually helped his fWAR in 2010. His fielding and positional adjustment cost him 22.4 runs in 2009 but only 17.2 runs last year.

Read the rest of this entry »


Rationalizing the Next Pujols Contract

If you haven’t heard anything about what Albert Pujols’ value will be over the next 7-10 years, I suggest you go here…Or here…Or here…Or take a look at the discussion here. Haven’t had enough? Read on.

Somebody is going to sign Pujols to a massive contract in the next 12 months. That contract will likely be hard to justify in projected on field value alone. If you are a fan of the team that gets him, after you get done saying PUJOLSAWESOMEBASEBALLYAY, you may want to know what his expected value will be and then take some time rationalizing the contract to yourself and justifying it to rival fans.

Read the rest of this entry »


Comparing 2010 Pitcher Forecasts

In two previous articles, I considered the ability of freely available forecasts to predict hitter performance (part 1 and part 2), and how forecasts can be used to predict player randomness (here).  In this article, I look at the performance of the same six forecasts as before (ZIPS, Marcel, CHONE, Fangraphs Fans, ESPN, CBS), but instead look at starting pitchers’ wins, strikeouts, ERA, and WHIP.

Results are quite different than for hitters. ESPN is the clear winner here, with the most accurate forecasts and the ones with the most unique and relevant information. Fangraphs Fan projections are highly biased, as with the hitters, yet they add a large amount of distinct information, and thus are quite useful.  Surprisingly, the mechanical forecasts are, for the most part, failures. While ZIPS has the least bias, it is encompassed by other models in every statistic.*  Marcel and CHONE are also poor performers with no useful and unique information, but with higher bias.

Read the rest of this entry »


Projecting Uncertainty

This article explores the ability to predict the randomness of players’ performance in 5 standard hitting categories: HRs, Runs, RBIs, SBs, and AVG. There have been efforts to do so by forecasters, most notably by Tango’s “reliability score.” (See Matt Klaassen’s article) I also test the idea that variation among forecasts (among ESPN, CHONE, Fangraphs Fans, ZIPS, Marcel, and CBS Sportsline) can predict player randomness as well.

I find that 1) variance among forecasts is a strong predictor of actual forecast error variance for HRs, Runs, RBIs and Steals, but a weak one for batting average, 2) Tango’s reliability score serves as a weak predictor of all 5 stats, and that 3), the forecast variance information dominates Tango’s measures in all categories but AVG.

Now let’s set up the analysis. Say, for example, that three forecasts say that Player A will hit 19, 20, and 21 home runs, respectively, and Player B will hit 10, 20, and 30 home runs. Does the fact that there is agreement in Player A’s forecast and disagreement in Player B’s provide some information about the randomness of Player A’s eventual performance relative to Player B’s?

To answer this, we need to do a few things first. We need a measure of dispersion of the forecasts. To do this, I define the forecast variance as the variance of the six forecasts for each stat, for each player.  If we take the square root of this number, we get the standard deviation of the forecast. So, the standard deviation of the forecasts of Player A’s HRs would be 1, and the standard deviation of the forecasts for Player 2 would be 10.

Next we turn to some regression analysis.* The dependent variable is the absolute error for a particular player’s consensus forecast (defined as the average among the six different forecasts). For both players A and B in the example, this number would be 20. This is my measure for performance randomness. Controlling for the projected counting stats, we can estimate this absolute error as a function of some measure of forecast reliability.

Tango’s reliability score is one such measure, and the forecast standard deviation is another.  What we would predict is that Tango’s score (where 0 means least reliable and 1 means most) would have a negative effect on the error. We would also predict that the forecast standard deviation would have a positive effect on the error. Now let’s see what the data tell us:

Runs:

R absolute error
[1] [2] [3]
R Standard Deviation 0.45 0.44
(0.27) (0.32)
R mean forecast 0.05 0.02 0.03
(0.06) (0.05) (0.06)
Tango’s reliability measure -8.15 -0.59
(9.09) (10.60)
Constant 22.94 14.93 15.36

HRs:

HR absolute error
[1] [2] [3]
HR Standard Deviation 0.82 0.78
(0.30) (0.32)
HR mean forecast 0.20 0.12 0.13
(0.03) (0.04) (0.04)
Tango’s reliability measure -3.26 -0.84
(2.52) (2.69)
Constant 5.32 2.31 2.94

RBIs:

RBI absolute error
[1] [2] [3]
RBI Standard Deviation 0.44 0.34
(0.28) (0.31)
RBI mean forecast 0.09 0.05 0.08
(0.05) (0.05) (0.05)
Tango’s reliability measure -12.52 -7.83
(9.12) (10.08)
Constant 23.78 12.66 18.37

SBs:

SB absolute error
[1] [2] [3]
SB Standard Deviation 0.50 0.41
(0.24) (0.27)
SB mean forecast 0.37 0.30 0.31
(0.03) (0.04) (0.04)
Tango’s reliability measure -3.47 -1.90
(2.19) (2.42)
Constant 3.80 0.75 2.30

AVG:

AVG absolute error
[1] [2] [3]
AVG Standard Deviation 0.567 0.287
(0.689) (0.713)
AVG mean forecast -0.085 -0.107 -0.083
(0.091) (0.090) (0.092)
Tango’s reliability measure -0.023 -0.022
(0.014) (0.015)
Constant 0.069 0.054 0.066

We see that HRs are the statistic for which errors are most easily forecasted, errors for Rs, RBIs, and SBs are moderately forecastable, and errors for AVG are not very forecastable. We see this because of the negative and statistically significant coefficients for Tango’s score and the positive and statistically significant coefficients on the standard deviation measure.  In regressions with both measures, the standard deviation measure encompasses Tango’s measure, except in the AVG equation.

So what does this all mean? If you’re looking at rival forecasts, 80% of the standard deviation between the HR forecasts and about 50% of the standard deviation of the forecasts of the other stats is legitimate randomness. This means that you can tell how random a player’s performance will be by the variation in the forecasts, especially home runs. If you don’t have time to compare different forecasts, then Tango’s reliability score is a rough approximation, but a pretty imprecise measure.

*For those of you unfamiliar with regression analysis, imagine a graph of dots and drawing a line through it. Now imagine the graph is 3 or 4 dimensions and doing the same, and the line is drawn such that the (sum of squares of) the distance between the dots and the line is minimized.


Comparing 2010 Hitter Forecasts Part 2: Creating Better Forecasts

In Part 1 of this article, I looked at the ability of individual projection systems to forecast hitter performance. The six different projection systems considered are Zips, CHONE, Marcel, CBS Sportsline, ESPN, and Fangraphs Fans, and each is freely available online.  It turns out that when we control for bias in the forecasts, each of the forecasting systems is, on average, pretty much the same.  In what follows here, I show that the Fangraphs Fan projections and the Marcel projections contain the most unique, useful information. Also, I show that a weighted average of the six forecasts predicts hitter performance much better than any individual projection.

Forecast encompassing tests can be used to determine which of a set of individual projections contain the most valuable information. Based on the forecast encompassing test results, we can calculate a forecast that is a weighted average of the six forecasts that will outperform any individual forecast.

Read the rest of this entry »


Jeter, Ichiro, And 100 WAR

Recently, David Appelman introduced all of us to the Automated WAR grids. When I clicked into the WAR grids section, the top-25 all-time leaders in recorded MLB history was illustrated as the sample grid. I took some time to let the awe set in, admiring the absolute dominance of the true legends of the game who seem to transcend even the Hall of Fame.

One of the first things I noticed was that every one of them at least matched 100 career WAR. I got to thinking about which players we watch today that we may someday see on this elite 100+ WAR list. There were 19 players active in 2010 that have accumulated 50 career WAR or better. At the top we already see ARod at 120, the only current player who we know for certain fits into that super-elite status. After ARod there is Pujols, who has racked up 81 WAR to date and will likely only need 3 more seasons to join the club. The rest of the players on the list are all guys who are at least in their late 30s and many of them are on the cusp of retirement and/or are in dramatic decline. Realistically, there were only two other players who I thought may have an outside shot at 100 WAR: Jeter and Ichiro.

Read the rest of this entry »


Jason Hammel and the Oddity of ERA

ERA can be a weird thing at times. I love it, but it doesn’t always reveal the full story. Jason Hammel is the perfect subject. After six years in the Rays minor league system, and three bad stints with the Rays Major League club, he found himself looking up at a logjam of starting pitchers in Tampa Bay. The Rays traded him to the Rockies after the 2008 season in exchange for Aneury Rodriguez.

With the trade to Colorado, Hammel was given a great opportunity to start in the Majors for a full season. Since his arrival in Colorado two seasons ago, Hammel has been nothing but consistent. Take a look at his stats:

Read the rest of this entry »


The Next Jose Bautista

This article was originally posted at WahooBlues.com.

Jose Bautista took the baseball world by storm in 2010 when, after six MLB seasons of doing nothing in particular, he emerged as a candidate for AL MVP. Compare his 54 homers, 124 RBI, and .995 OPS in 161 games last year to the 59 homers, 211 RBI, and .729 OPS he posted in nearly 600 games from 2004-09. Using WAR/PA, Bautista was more than 11 times better in 2010 than he’d been for the rest of his career.

Interestingly, Bautista’s breakout came just a year after Ben Zobrist came out of nowhere to become the second-most valuable player in baseball. After hitting .222/.279/.370 with just 15 homers, 57 RBI and -0.5 WAR in roughly a full season’s worth of games from 2006-08, Zobrist went bananas in 2009, hitting .297/.405/.543 with 27 taters, 91 knocked in, and 8.4 WAR.

Besides the fact that no one expected monster breakouts from either of them, 2009 Zobrist and 2010 Bautista had some interesting things in common. Both had extensive experience in the big leagues but neither had done anything particularly impressive. Both entered their seasons with at some questions about what their roles would be. And both had enjoyed out-of-nowhere power surges during their respective previous Septembers.

Read the rest of this entry »