Archive for Player Analysis

Mike Trout and the MVP

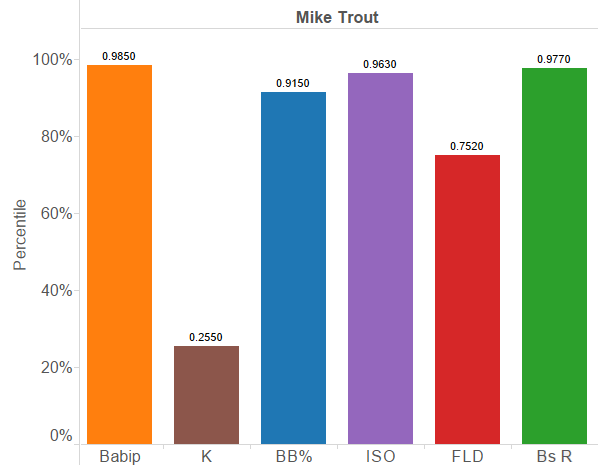
In 2012 and 2013, Mike Trout was considered by most in the sabermetric community to be the most valuable player in the American League.  That Miguel Cabrera ended up winning in both years was the source of much debate and consternation, to say the least.  Analytically-inclined fans and writers were fed up, frustrated, and outright angry with the “old school” writers voting for Cabrera based on a different set of values.  Now, in an amusing twist, it appears that this year Trout has his best chance yet to wind up with the award, in large part by having a season that is less aligned with what the sabermetric community values, and more aligned with what the majority of the voting population values.  I took a look at the changes in various aspects of Trout’s game and analyzed how the regressions/improvements will impact his candidacy, based on what voters traditionally have cared about.

Defense

A large part of Trout’s previous MVP candidacy (particularly in 2012) centered on his defense — an area that traditionally has had fewer metrics to quantify a player’s value (as compared to say, hitting).  In 2012, DRS had Trout as worth 21 runs above average; UZR had him at 13.3.

In 2013, Trout’s defensive value declined to the point where he was worth -9 runs by DRS and +4.4 runs by UZR.  This discrepancy was a major reason why Baseball-Reference’s DRS-based WAR for Trout was 8.9 while FanGraphs’ UZR-based WAR was 10.5.

This year, Trout’s worth -6 by DRS and -7.2 by UZR.

In actuality, it didn’t take a rocket scientist to predict this regression; Trout’s arm has been consistently slightly below average, and his range ended up over-contributing in 2012 thanks to a handful of plays that broke his way.  Interestingly enough, the sabermetric crowd didn’t call any attention to this detail in 2012, choosing instead to use Trout’s defensive numbers to bolster their MVP case; now this year they’re bending over backwards to try to discredit Alex Gordon’s defensive numbers so they can justify giving the MVP to Trout as they’ve hoped to be able to do all season long…but that’s a post for a different day.

Baserunning

Likewise in 2012, Trout’s baserunning was valued at 12 runs above average, which included his other-worldly 49 SB and 5 CS.  In 2013, his baserunning added 8.1 runs, including 33 SB and 7 CS — still a great 82.5% success rate.

This year, Trout’s been worth all of 1.5 runs on the bases, with just 13 SB and 2 CS.

Hitting

Trout’s offense is down slightly, but not nearly to the extent that his defense and baserunning have been.  Like his defense, this regression was fairly predictable, given Trout’s unsustainably high BABIP in 2012 and 2013.  His OPS is down to 0.934 compared to 0.963 and 0.988 in 2012 and 2013, but he still has plenty else to hang his hat on: he leads the league in total bases; he’s already hit 30 homers, a total he hasn’t surpassed before; and, with 94 RBIs, he’ll easily pass that magical/meaningless 100 threshold soon as well.  The voters as a whole still like HRs, RBIs, and round numbers.

Clutch Hitting

In previous years, Trout was criticized (at least by me!) for not getting hits in key situations.  Here are Trout’s offensive splits with Bases Empty versus with Runners on Base:

 Year  Split  BABIP  OPS  tOPS+
 2012  Empty  0.403  0.985
 2012  RoB  0.343  0.917  90
 2013  Empty  0.399  1.023
 2013  RoB  0.339  0.934  90
 2014  Empty  0.343  0.916
 2014  RoB  0.348  0.944  104

In 2012-2013, he performed significantly worse with runners on.  Presumably most folks here would no doubt cling to the notion that this is entirely luck, and that sequencing like this is entirely unpredictable and out of players’ control.  I argue that even if so, if we’re talking about how much value a player added to his team in a given year, he’s adding more value in years when he gets clutch hits than in years when he doesn’t.  And this year, he’s actually reversed the trend.  His 2014 WPA of 5.52 has already exceeded his 2012 and 2013 marks of 5.32 and 4.60.

The Field

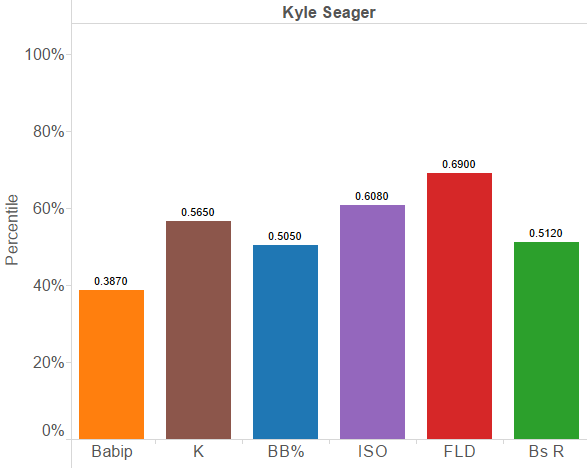
Fortunately for Trout this year, there haven’t been many other position players giving him a run for his money.  Josh Donaldson has cooled off as expected after a hot start.  Alex Gordon’s case is even more heavily dependent on defensive metrics than Trout’s was in 2012, and I don’t see many voters slotting him above Trout.  After that, I just don’t see the award going to Robinson Cano or Kyle Seager (the only other 2 AL players in the top 10 for position player WAR as of this writing), unless Cano truly catches fire in September and leads the Mariners to the playoffs.  In fact Trout’s best competition for the MVP may well end up being a pitcher (another Mariner, no less!), Felix Hernandez.  And we know how hard it is for a pitcher to win the MVP even when his WAR outpaces that of position players (“They only pitch every 5 days!”).

Playoffs?!

Last and perhaps most importantly, I present the Angels’ records and division finishes over the past 3 seasons:

2012: 89-73, 3rd

2013: 78-84, 3rd

2014: 81-53, 1st (through 8/30)

FanGraphs gives the Angels a 99.9% chance of making the playoffs.  In fact, as of this writing, no other team in baseball has more than 78 wins, while the Angels have 81.  This should finally appease the “MVPs should lead their team to the playoffs” voters.

The Vote

So Trout’s hitting is slightly down and his defense and baserunning are way down from when he had his previous “MVP-caliber” seasons.  Fortunately for Trout, the voters by and large don’t value defense and baserunning as much as they probably should (though that’s starting to change, albeit slowly).  And as for hitting being down, 2014 Trout is doing more of what they value: hitting homers and driving in runs.  The only thing that might work against him is if he doesn’t bat .300 (he’s at .290 as of now), and the voters like nice round numbers (and they value BA over newfangled mumbo-jumbo like OBP and OPS).  Overall though, with the Angels in line for their first playoff spot since 2009 and no other traditional MVP-makeup players in the field, Trout seems like a shoo-in.

 Criteria  As Compared to 2012-2013  Do Voters care?
 Defense  Way Down  Not much
 Baserunning  Way Down  Not much
 Overall Hitting  Somewhat down  Somewhat
 HRs, RBIs  Up  Yes
 Playoffs  Angels in much better position  Yes
 Field  Not as many standouts as 2012-2013(Alex Gordon != Miguel Cabrera)  Yes

So there you have it: Trout will win the AL MVP award for all the wrong reasons.


The Search for a Good Approach

Last week I explored the strategic effect of seeing more pitchers per plate appearance. I love the ten-pitch walk as much as the next guy, but what I love even more is seeing a guy be able to change that approach to beat a scouting report. Let’s take a look at June 5, 2014, when the A’s went to see Masahiro Tanaka for the first time. The first batter is Coco Crisp:

Pitcher
M. Tanaka
Batter
C. Crisp
Speed Pitch Result
1 91 Sinker Ball
2 90 Sinker Ball
3 91 Fastball (Four-seam) Ball
4 90 Fastball (Four-seam) Called Strike
5 91 Fastball (Four-seam) Foul
6 92 Fastball (Four-seam) In play, out(s)

So Crisp doesn’t get the best of Tanaka, but he makes Tanaka labor a bit through six pitches. If you’re going to make an out to start the game, it might as well be a long one. For the next batter, John Jaso, Tanaka decides to go right after him:

Pitcher
M. Tanaka
Batter
J. Jaso
Speed Pitch Result
1 90 Sinker In play, run(s)

I may be looking too deeply into the narrative here, but I love to imagine Tanaka getting a bit frustrated here. Perhaps the scouting report said that both Coco is aggressive early, while Jaso’s running 15% walk rates in 2012 and 2013 suggest that he’s more patient.  Tanaka has to throw six pitches in order to get Crisp out, but after deciding to go right after Jaso, he gets taken deep.

So I wondered if there are players who are able to fulfill both ends of this spectrum. Are there any players that are capable of prolonging their time at the plate until they see the pitch they want, but are also aggressive and willing enough to hit the gas on the first pitch? I used FanGraphs for the pitches/plate appearance data, but used baseball-reference’s play index to look up all instances of first-pitch hits this season. Originally I was going to use first-pitch swings, but I decided to just stick to times when the pitcher gets punished for trying to get ahead early. After all, if your decision is to get ahead early in the count, and the guy swings but all he does is foul it off or hit into an out, then that doesn’t change your approach as a pitcher. I wanted to see guys whom the book isn’t written on yet.  Advance Warning: These stats will be about a week old by the time you see them, as I am a slow, slow man.

Best P/PA Rank + FPH Rank (I have no idea how to pitch to them) FPH% P/PA FPHR PPAR FPHR + PPAR wOBA
Scott Van Slyke 5.940594059 4.143564356 26 45 71 0.385
Eric Campbell 4.2424242424 4.248520710 117 18 99 0.326
Jesus Guzman 4.294478528 4.17791411 111 33 144 0.247
Daniel Murphy 4.577464789 4.111842105 87 58 145 0.305
Joey Votto 4.044117647 4.334558824 135 12 147 0.359
Mark Reynolds 5.037783375 4.0375 59 91 150 0.307

(For Reference: FPH% = First Pitch Hit Percentage, or how often a batter gets a hit on the first pitch they see.  P/PA = Pitches per Plate Appearance. FPHR = First Pitch Hit Ranking, or how they rank in this category compared to the rest of the league.  PPAR = Pitches per Plate Appearance Ranking.  FPHR + PPAR = The addition of these two numbers.)

I like this table!  I have wondered at times what has caused Scott Van Slyke‘s resurgence this year. Perhaps this table gives us a bit of a clue.  Van Slyke is the only person in the MLB to rank in the top 50 in both FPHR and PPAR.  That’s pretty neat.  Daniel Murphy is also quite balanced, but he’s been much more consistent over the last few years.  He’s particularly interesting in that he doesn’t have a particularly high walk rate or strikeout rate.  I guess he’s just selective at times.  Jesus Guzman’s presence on this list goes to show that a good approach doesn’t necessarily mean success; it just means that he may not head back to the bench in any predictable fashion.  I stretched out the table one spot to include Mark Reynolds, because his name on this table makes me feel better about drafting him in Fantasy Baseball for past five years.

I also wanted to look at the flip-side.  Who are the guys who don’t tend to take a lot of pitches, but also don’t tend to make any decent contact on first pitches?

Highest P/PA Rank + FPH Rank (Pick your poison) FPH% P/PA FPHR PPAR FPHR+PPAR wOBA
Joaquin Arias 0.6451612903 3.55483871 370 400 770 0.221
Ben Revere 1.629327902 3.563636364 365 368 733 0.307
Endy Chavez 0.9345794393 3.674311927 321 393 714 0.301
Conor Gillaspie 2.168674699 3.587112172 359 329 688 0.353
Jean Segura 2.564102564 3.42462845 396 289 685 0.262

Here we have a much less impressive list.  Joaquin Arias has been one of the worst hitter in the majors this year, and his dominance atop this leaderboard makes a bit of sense.  However, Conor Gillaspie is having an excellent season for the Pale Hose, despite the fact that he doesn’t seem to excel in either of the areas this article is interested in.  One pecuilar note is that this group is pretty poor at hitting for power in general; these 5 guys have 13 home runs between them on the year, and six of those are Gillaspie’s.

So now let’s look at the weird ones.  I would think that it stands that if there are certain players who tend to take a lot of pitches and who also never seem to square up the first pitch, then we know our game plan.  Get ahead early on these batters.  We can try to view that by simply looking at each players FPH Ranking minus their PPA ranking.  This is the same at looking at the absolute value of their PPAR minus their FPAR.  Here are the top five in that respect:

Worst in FPHR, Best in PPAR (Groove it Early) FPH% P/PA FPHR PPAR FPHR-PPAR wOBA
Jason Kubel 1.136363636 4.471590909 387 4 383 0.278
Aaron Hicks 0.641025641 4.224358974 401 21 380 0.286
Mike Trout 1.217391304 4.418965517 385 6 379 0.401
Matt Carpenter 1.376936317 4.357264957 380 8 372 0.343
A.J. Ellis 1.181102362 4.255813953 386 17 369 0.264

Golly; I’ve figured out Mike Trout!  Mike Trout ranks very highly on our list of PPAR but is unfortunately relatively average when it comes to the first-pitch punish.  All of these guys actually fit this mold.  We have three relatively poor hitters accompanied by the best player in baseball and an above average infielder on a winning team.  So we can tell that being patient isn’t necessarily a good or bad thing; it’s just that hitter’s style.  Now let’s take a look at the reverse:

Best in FPHR, Worst in PPAR (Don’t throw it in the zone early) FPH% P/PA FPHR  PPAR PPAR-FPHR wOBA
Jose Altuve 8.159722222 3.175862069 5 407 402 0.355
Wilson Ramos 7.169811321 3.293680297 6 405 399 0.327
Erick Aybar 6.628787879 3.347091932 12 401 389 0.312
Ender Inciarte 8.360128617 3.471518987 3 391 388 0.284
A.J. Pierzynski 6.413994169 3.391930836 16 399 383 0.283

It’s always satisfying when the data shows what you expect it to.  I imagined Jose Altuve as being among the more aggressive hitters, and this shows that at least.  Altuve ranks 5th in the league in FPH% and is rather mediocre in the PPA category.  Interesting to see that this top five is also sorted by wOBA; Altuve is the best hitter on the list, and Pierzynski is the worst.  So there’s nothing necessarily wrong with an aggressive approach, but it does give us a clue as to a possible plan of attack.

So all this is to say, like my last article, that no particular approach is best.  One can look to swing at the first pitch, or one can be patient and wait for their pitch to come.  That said, everybody does have an approach, and that means they’ve got something they’re not looking for.  Stats like FPH and PPAR may just give us more clues as fans as to what teams put together with scouting reports.

So to conclude by going back to our first example, perhaps Tanaka should have read this data before his start against the A’s.  Coco ranks 266th in the league in FPHR, but a respectable 76th in PPAR.  Conversely, Jaso ranks 80th in the league in FPHR, but just 225th in PPAR.  Tanaka might have been better served by going after the aging Crisp and saving his energy for the somewhat aggressive Jaso.


Is Nolan Ryan Overrated by FIP?

Nolan Ryan was a singular pitcher. He’s unique in baseball history, so distinct that it’s hard to know where to start. I’m going to begin with the obvious: strikeouts. Nolan Ryan struck out 5,714 batters, 17% more than second-place Randy Johnson. Only 16 pitchers in history recorded half as many strikeouts as Nolan Ryan. He led his league in strikeouts 11 times, the most since Walter Johnson (12).

Ryan also walked the most batters in history — 2,795. Steve Carlton is second on that list, with 1,833. Ryan averaged 4.67 BB/9 and 12.4 BB%. Both figures are higher than anyone else who pitched even half as many innings. Ryan led his league in walks eight times.

Ryan also threw 277 wild pitches, most since 1900. He allowed 757 stolen bases, almost 40% more than second-place Greg Maddux. Ryan led AL pitchers in errors four times, and retired with a ghastly .895 fielding percentage. Joe Posnanski summed up Ryan’s career, “He’s the most extraordinary pitcher who ever lived, I think. But I also think he’s not especially close to the best.”

Nolan Ryan is unique, and it makes him hard to evaluate. Casual fans and the old-school crowd have always worshiped Nolan Ryan. His uniform number was retired by three different teams, and he was the leading vote-getter, among pitchers, for the MLB All-Century Team. He got more than twice as many votes as Walter Johnson. But when you really look at his stats, Ryan doesn’t come off well.

Take wins. Yes, the pitcher win, because this is surprising. In a career that spanned 26 seasons (not including 1966, when he had only one decision), Ryan only led his team in wins 7 times. Actually, it’s 5 times outright — 7 counts two years he tied for the lead. In 11 of his 27 seasons (41%), Ryan had a lower winning percentage than the team. He lost more games (292) than anyone but Cy Young and Walter Johnson. What about ERA? Ryan led his league in ERA twice, but in one of those years, he went 8-16. The other year, strike-shortened 1981, he didn’t lead the league in strikeouts, but did lead the majors in wild pitches (16). His 1.25 WHIP ranks 278th all-time. Ryan never won a Cy Young Award and never finished among the top 10 in MVP voting.

They say a little knowledge is a dangerous thing. When you look at stats like wins and ERA, Ryan looks more like a good pitcher than a great one. He’s almost a compiler, just a guy who played forever, rather than a true standout. Then you look at FIP. Ryan had a FIP of 2.97 (84 FIP-), and he pitched 5,386 innings, giving him 106.6 WAR. By FIP, Nolan Ryan is the 6th-most valuable pitcher of all time: Roger Clemens, Cy Young, Walter Johnson, Greg Maddux, Randy Johnson, Nolan Ryan.

I suspect the percentage of FanGraphs readers who believe Nolan Ryan was one of the six best pitchers ever is south of 5%, maybe less than 1%. He rates considerably worse by RA9-WAR, 89.5 instead of 106.6, 25th all-time. Even that would seem high to many stat-oriented fans. It’s better than Bob Feller, basically equal to Pedro Martinez. Ryan also ranks 20th in rWAR (83.8), again much lower than when judged by FIP.

I gave this post a stupid title, with an obvious answer. Is Nolan Ryan overrated by FIP? Yes, clearly. His ERA was 20 points higher — in a 28-year, 807-game, 5,400-inning career. I think the numbers stabilize before 5,000 innings. Ryan’s RA9-WAR is 17 points lower than his fWAR, the biggest deficit of any pitcher in history. Ryan is overrated by FIP. That’s not a major revelation. The interesting question is why Nolan Ryan is overrated by FIP — and whether he is underrated by RA and ERA.
Read the rest of this entry »


Is This the True Jake Arrieta?

So far this season Jake Arrieta has looked like an ace, pitching to a 2.53 ERA which is over 2 points better than his career average.  His K/9 is at a career high and his BB/9 are at a career low — 9.19 and 2.32 respectively.  However, the biggest difference in Arrieta’s success comes from his ability to limit home runs this season.  His .36 HR/9 is significantly lower than his career average of 1.01.  People have been questioning whether or not Arrieta can sustain this or not and how he has become a completely different pitcher this season.

The key to this change in Arrieta could conceivably be coming from his change in pitch mix this season.

Season FA% FC% SI% SL% CU% CH%
2010 31.7% 30.2% 13.1% 14.6% 9.9%
2011 43.5% 17.0% 15.9% 15.4% 7.9%
2012 33.8% 1.0% 26.6% 14.9% 15.9% 7.5%
2013 28.2% 1.6% 37.6% 13.8% 15.0% 3.6%
2014 22.1% 1.6% 23.3% 29.3% 18.2% 5.3%

The major thing that stands out from looking at his pitch F/X data is that Arrieta has begun to use his slider more than ever before in his career this season.  Almost twice as much as his previous career high.  Arrieta has actually been using his slider as his most frequently used pitch.  The heavy increase in Arrieta’s usage of his slider has been at the expense of both his sinker and his four seam fastball which are both at or near career lows this season.  What is interesting is that Arrieta decreasing his usage of a sinker has actually lead to a career high in GB%.

This lead to an interesting idea of what other starters this season have been using a breaking pitch as their most-used pitch this season.  That found seven such starters including Arrieta.  Here is their pitch mixes according to pitch F/X.

Name FA% FT% FC% SI% SL% CU% CH%
Tyson Ross 24.2% 31.2% 0.1% 41.2% 3.0%
Madison Bumgarner 24.3% 17.1% 36.7% 13.8% 7.8%
Drew Smyly 28.9% 21.9% 12.6% 31.2% 5.2%
Jason Hammel 30.4% 27.4% 30.9% 7.0% 3.9%
Kevin Correia 14.6% 17.1% 6.0% 30.9% 16.4% 14.9%
Jake Arrieta 22.1% 1.6% 23.3% 29.3% 18.2% 5.3%
Josh Beckett 27.4% 13.5% 12.2% 30.7% 15.9%

What is interesting about this group is that most of these guys other than Arrieta have all featured their breaking stuff as either their number one or two pitch for much of their careers while Arrieta just began featuring it this season.  Although Tyson Ross did use the slider a lot early in his career, his usage of the pitch has significantly increased over the past two years — 25.5% in 2012 and 32.2% last season.  He has had a similar change in success to what Arrieta has seen this season.  Ross’s GB% is at a career high beating his previous career high that he set in 2013 by 3 percentage points.  His K/9 and BB/9 have also risen and dropped respectively over the past two seasons once he began to use the slider more and more.

Using Ross’s pitch usage changes as a blueprint for Arrieta’s potential future successes the trends seem to fit.  The only place Arrieta truly changed that Ross did not see a change is in his HR/9.  Arrieta was homer prone early in his career while Ross never was.  However, Ross’s pre-change groundball rate was higher than Arrieta’s which supports his ability to keep the ball in the yard.  Thus is it not insane to think that Arrieta could keep up the success he has had this season as long as he continues to feature his slider like he has this season.


Baseball’s 10 Most Unusual Hitters

Baseball, more than any other major team sport, has the reputation for having the least athletic athletes. Jose Molina is obligated to, at times, sprint. Jorge de la Rosa must swing a baseball bat. David Ortiz sometimes has to play in the field. Having skills like catcher defense, pitching, and hitting with power will earn you playing time, and many players have such elite strengths that it’s worth it just to deal with those weaknesses. So many of baseball’s skills are unrelated that players have to spend a lot of time doing things they aren’t good at, at least relative to other MLB talent. A good way to make anyone look unathletic is to make them perform a long list of skills that have little to do with one another and compare them to the best in the world at those tasks.

I wanted to assemble a list of players who experienced something like this phenomenon the most frequently. Essentially, I wanted to see what players’ strengths and weaknesses were the farthest apart. To determine those players whose skills varied the most between themselves, I gathered what I consider to be the six stats that best describe what a player’s strengths and weaknesses are. BABIP and K% for contact, BB% for discipline, ISO for power, and Fielding and Baserunning values. I then gathered stats from 2011-2014 to better control for less reliable fielding metrics, assigned each player’s stats a percentile rank, and calculated the standard deviation of those six stats for each player.

For instance, Mike Trout’s attributes look like this:

Mike Trout

His strikeout rate has been higher than MLB average, but he is otherwise an exceptionally well rounded player, as we know.

The most evenly talented player in baseball has been Kyle Seager, who is almost in the middle third at every stat.

Kyle Seager

Many players have much more severe strengths and weaknesses. Here are the 10 players whose stats show the greatest variation from one another.

10. Dexter Fowler

Dexter Fowler

9. Ichiro Suzuki

Ichiro Suzuki

8. Jose Altuve

Jose Altuve

7. Curtis Granderson

Curtis Granderson

6. Mark Reynolds

Mark Reynolds

5. Giancarlo Stanton

Giancarlo Stanton

4. Miguel Cabrera

Miguel Cabrera

3. Darwin Barney

Darwin Barney

2. Adam Dunn

Adam Dunn

1. Ben Revere

Ben Revere

The whole list is fun to look through and play around with, so feel free to click here and look through all the qualifying players.


The Rays, Drew Smyly, and the Changeup

In 2013, Baseball Prospectus chronicled the Rays’ “changeup revolution,” explaining how the Rays’ pitching development has succeeded in part because they teach pretty much everyone to offer a plus changeup in unusual situations. But while successful small market teams have thrived off using analytics to find market dislocations on players, the Rays’ changeup prowess has actually allowed them to create them.

Recently, the Rays were ridiculed for giving up David Price for a package whose most proven player was Tigers’ 5th starter Drew Smyly. At the time of the trade, Smyly had a 3.93 ERA and 4.08 FIP. In other words, he was an average starter. But looking closely, one can see that he pitches to a drastic LHH/RHH split, with opposing wOBA’s of .196/.355, respectively. The reason behind his inability to get righties out could very well be the lack of a good secondary pitch to use on them. For his career, his most effective pitch has been his slider, with hitters putting up a meager .226 wOBA against it. His worst pitch was none other than his changeup, which has been crushed to the tune of a .488 wOBA.

Knowing that his organization specializes in teaching the changeup, I don’t believe for a second that Rays GM Andrew Friedman gave up their ace without thinking that Smyly was essentially a good changeup away from being a potent starter. A free agent in 2019 at the earliest, Smyly should easily provide more long-term value than Price will over the next 1.5 seasons. (Obviously, the Tigers will try to extend Price, but the Rays did not have that option.)

The key takeaway here is that to most teams, Drew Smyly was probably viewed as a league-average pitcher without a secondary pitch that could put righties away. But to a team like the Rays, who have proven to be adept at implementing a changeup, Smyly’s ceiling can appear to be much more feasible. So far with Tampa (small sample size warning), Smyly has thrown 36 innings in 5 starts with an ERA/FIP/WHIP of 1.50/2.82/0.69. He will certainly come back down to earth, but a valuable lesson can be derived from this trade that appeared to be a blatant ripoff. By having an organization’s pitching development specialize so much, the Rays actually manufacture their own list of “buy low” pitchers, many of whom may have plateaued in the minds of other teams.

When they traded Matt Garza, they got current front-end starter Chris Archer in return. From Prospect Instinct’s 2011 scouting report:

The Rays got a haul for Matt Garza from the Cubs and Archer was considered the Cubs top pitching prospect. He has a plus fastball and above average slider, but he still has a lot of work to do before he becomes MLB ready. His changeup is lacking and his command has been erratic. But with enough time he does have #3+ upside.

With a Tampa Bay Rays changeup in his arsenal (.198 wOBA against it in 2014), Archer has done very well for a 3 starter, with a 3.15 ERA and 3.49 FIP over 286 innings since 2013.

Many have noted that Yankees’ starting pitcher Masahiro Tanaka has experienced so much success because he is one of the few pitchers who regularly throws a splitter in the MLB. Perhaps an organization can do what the Rays have done with the changeup and make the splitter a cornerstone of their pitching development. Obviously, such a plan comes with inherent risk. Making the splitter a more commonly offered pitch could take away some of its unfamiliarity-related effectiveness. Also, the splitter is believed to be very taxing on the elbow, a definite red flag given the recent wave of Tommy John surgeries. However, doing what the Rays did with the splitter could make it so that pitchers who are one additional plus pitch away from reaching their ceilings are safer to bet on.


Pitches Seen: Baseball’s Boring Inefficiency

I think I might be the biggest fan of the world of the Ten-Pitch Walk.  I don’t know why, but I get overly excited when I see a player really battle for a long time, against everything the pitcher has, only to win the battle through patience.  Perhaps it’s because it’s so contrary to the spirit of what’s actually exciting about baseball; seeing players run around and field a batted ball.  It’s wholly a battle of attrition.  It’s the baseball equivalent of watching somebody run a marathon; you may not think the act itself is exciting, but it’s certainly an impressive feat in a vacuum.

So this has also lead to a fascination with pitches seen per plate appearance.  I’ve long wondered if certain teams place an emphasis on teaching their players to see more pitches per plate appearance.  It seems fairly self-evident that seeing more pitches is, in a microcosm, better than seeing fewer pitches.  You tire the pitcher out quicker, you see more data for your next at-bat to work with, and you give your team a chance to see what the pitcher has, and how he’ll react in different situations.  I hypothesized, purely based on colloquial wisdom, that the A’s would be good at this and the Blue Jays would be bad at this.  That’s not to say that one approach is better than the other, but just that some teams seem more patient than others.

Fortunately, FanGraphs has data available per hitter as to how many pitches they see.  I pulled that data out and found out each player’s average pitch per at bat since the year 2003 (the earliest we have this data, from what I can tell) and restricted the findings to active players only.  Then I ran some regressions to see if there was any correlation between pitches per at bat and useful batting stats.  Here’s what I found:

We see a slightly positive correlation between P/PA and wOBA.  It’s not really anything to write home about, but it’s more than negative.  It doesn’t seem immediately that seeing more pitches relates heavily to overall performance at the plate.  What about on base percentage?

Slightly better here, but still not great.  Seeing more pitches does have a little more correlation to getting on base, but there are plenty of aggressive swingers that don’t follow that model, so it means the correlation is loose at best.  What if we talk just about taking walks?

Here we have a real correlation.  .59 is a fairly strong correlation, and that makes sense.  The more pitches you see, the more likely you are to take a walk.  If you can successfully foul off anything in the strike zone, you will eventually walk (or the pitcher will die of exhaustion, either way, you win).  This is reasonably useful.  If you’re trying to find a way to make your team walk more, maybe you can invest in some players that see more pitches per plate appearance than normal.  This strong of a correlation makes me think about strikeout percentage too, though, because every pitch you foul off makes you closer (or just one whiff away) from striking out.

There is a positive correlation here, but not nearly as strong as between BB% and P/PA.  It’s stronger than the other useful stats like wOBA, but it’s interesting to know that seeing more pitches relates much more strongly to taking a walk than it is to striking out, at least on a grand scale.  There is some research to be done here to see what the odds are of a plate appearance as the pitch count increases, but I’ll leave that for another day.  My next thought was to see if there are, in fact, any teams that are better at this than other teams.  Here’s what we’ve got on a team level:

1 Red Sox 4.0506764011
2 Twins 4.0396551724
3 Cubs 3.9222196952
4 Yankees 3.9142662735
5 Pirates 3.9037861915
6 Astros 3.9028792437
7 Padres 3.9021177686
8 Mets 3.9009743938
9 Marlins 3.8916836619
10 Indians 3.8914762742
11 Athletics 3.8899398108
12 Phillies 3.8839715662
13 Blue Jays 3.8685393258
14 Cardinals 3.8634547591
15 Rays 3.8511224058
16 Rangers 3.8489497286
17 Dodgers 3.8480325645
18 Tigers 3.8314217702
19 Angels 3.8280856423
20 Diamondbacks 3.8161904762
21 Nationals 3.8146927243
22 White Sox 3.811023622
23 Giants 3.8038379531
24 Reds 3.8015854512
25 Orioles 3.8014611087
26 Braves 3.7944609751
27 Mariners 3.7358235824
28 Royals 3.7310519063
29 Rockies 3.7244254169
30 Brewers 3.6745739291

Well, my original hypotheses were not great ones.  The A’s and the Blue Jays, at 11 and 13, are both decidedly middle of the road teams.  I find it most fun in times like this to look at the extremes; in this case, the Red Sox and the Brewers.  The difference in pitches seen per plate appearance between these two teams is 0.38.  That may seem small, but it adds up.  If we assume the average pitcher faces 4 batters per inning, that’s an additional 1.5 pitches per inning, and 9 pitches by the end of the sixth, just purely by the nature of the hitters.  In a tightly contested contest, that may mean the difference between getting to the bullpen in the 7th rather than the 8th, or even the 7th rather than the 6th.

It should be noted that I limited this data set to 2014 (in contrast to the earlier data which was 2003 onwards) just so we could get a realistic look at roster construction, and to see if any teams are, right now, putting any particular emphasis in this area. The BoSox are carried by the very patient eye of Mike Napoli (4.51 P/PA), but hurt by the rather hacky eye of AJ Pierzynski (3.42 P/PA). Even on one team, that’s more than a pitch per plate appearance, which is pretty startling. The Brewers don’t have nearly the same difference; their best is Mark Reynolds with 4.04 P/PA and their worst is Jean Segura with 3.42 P/PA. As an aside, Chone Figgins is by far the best in this with a whopping 4.99 P/PA, though it was in just 76 PA. Kevin Frandsen brings up the rear with 3.16 P/PA in 189 PA. A lineup of all Mike Napoli’s would see 24.3 more pitches than a lineup of Kevin Frandsens before the leadoff Napoli even comes up a third time. I would feel bad for that pitcher.

The talk about teams possibly emphasizing this data made me wonder if I could make a huge difference if I compiled a team solely to do this; just make sure the pitchers throw a ton of pitches.  With that, I present to you the 2014 All-Stars and Not-So-All-Stars in this area, with a PA minimum thrown in to eliminate Figgins-like outliers:

All-Stars P/PA wOBA
C A.J. Ellis 4.344444444 0.311
1B Mike Napoli 4.353585112 0.371
2B Matt Carpenter 4.20647526 0.362
3B Mark Reynolds 4.179741578 0.341
SS Nick Punto 4.033495408 0.293
LF Brett Gardner 4.305959302 0.332
CF Mike Trout 4.219285365 0.404
RF Jayson Werth 4.399714635 0.364
DH Carlos Santana 4.297962322 0.356


Not-So-All-Stars P/PA wOBA
C A.J. Pierzynski 3.33404535 0.32
1B Yonder Alonso 3.603264727 0.318
2B Jose Altuve 3.266379723 0.321
3B Kevin Frandsen 3.41781874 0.296
SS Erick Aybar 3.415445741 0.308
LF Delmon Young 3.450895017 0.321
CF Carlos Gomez 3.517879162 0.321
RF Ben Revere 3.544046983 0.296
DH Salvador Perez 3.366071429 0.331

Despite the fact that there isn’t a strong correlation between wOBA and P/PA directly, it’s worth noting that the P/PA All-Stars are significantly better than the Not-So-All-Stars. Their difference in wOBA is .328 as compared to .314. The Not-So-All-Stars certainly present a fine lineup though; the All-Stars just have the benefit of having Mike Trout in their lineup. It’s nice to know that this is one other area that Mike Trout simply is amazing at, confirming the obvious. The All-Stars have a collective P/PA of 4.26, while their counterparts sit down at 3.43. That’s .83 pitches per plate appearance, which over the course of two turns through the lineup is 14.94 pitches; that’s definitely something notable.

So, it appears this is a demonstrable skill with some value, though not a ton. We can see that some teams are better at this than others, and we see some positive benefit from this, most notably in walk rate. While we see plenty of players on both sides of the scale who are excellent ballplayers, the data does seem to suggest that seeing more pitches is better than not doing so, though only marginally on a league wide scale. When we isolate leaders in this area vs. those more aggressive, we can see some startling differences though, suggesting that perhaps there is an advantage to be gained here.


Ben Revere and the Emptiest Batting Average Ever

I was listening to the Jonah Keri Podcast on Grantland recently, and he had Phillies beat writer Matt Gelb on the show. Gelb talked about all the sad things that Phillies fans are already tired of discussing, but he did make a statement that I found particularly poignant. He described Ben Revere’s season as something to the effect of “the emptiest batting average ever.” By empty, he means that while Revere is hitting above .300, an impressive feat in this offense-starved MLB landscape, he does so with almost no walks or extra-base hits. His value at the plate is almost entirely in the form of singles. This comment got me thinking: just how empty is his batting average?

As of this writing, Revere is hitting .314 with a .331 on-base percentage and a .371 slugging percentage. For comparison, the average player has a substantially worse batting average (think .240) but with a similar OBP and a substantially better SLG. To illustrate with normal stats, Revere has 27 total doubles, triples, homers, and walks this year. So far in 2014, there are 42 players with at least 27 doubles, 8 players with at least 27 homers, and 144 players with at least 27 walks.

But how rare is it to have this single-happy nature with such a high average? To look for players to compare to Revere historically, I looked for other player seasons since 2000 which had enough plate appearances to qualify for the batting title with a batting average at least as high as Revere’s but a walk rate and isolated slugging (slugging minus batting average) below his.

But there weren’t any, so I extended the search back to 1980.

Still nobody. 1960?

Nothing.

1900?

Zilch.

Now, to be fair, Ben Revere himself hasn’t completed a full season, so let’s use a more relaxed criterion of 400 plate appearances (Revere has 459).

OK, you get it.

In fact, since 1900 (it’s not worth going earlier because seasons were much shorter then), the only player with at least 400 plate appearances that had as high of a batting average with as little other hitting value is … Ben Revere. That’s it.

I’m not really sure that there’s much to be done with this information, but it’s a pretty shocking finding. As a member of a roster that’s overpaid and underperforming across the board, Revere’s limited skillset has been overshadowed by his more compensated counterparts. However, I was fascinated to discover that on a team that has had plenty of notable failings, Revere has had perhaps the most “unique” and “special” stats of any of them, as long as you’re not taking annual salary into account.

If you disregard his sub-par defense (especially compared to what you would expect from a guy with his speed), Revere really isn’t a terrible offensive player. If you took away all of his steals and instead turned that many singles into doubles, he’d have a slugging percentage around the league average. The problem is, a single followed by a steal isn’t as valuable as a double because it doesn’t advance runners on base, so his value would really be something less than that of a player with league-average slugging. Even if he posts a batting average way above the mean in any given season, he never walks or gets extra-base hits, so he has to sustain that mark against all kinds of luck and defensive factors in order to give the Phillies even passable offensive value. It’s a game that the Phillies seem interested in playing, and it’s defensible because of his obviously high average and stolen base totals, but I’m just not sure if they’re going to win that way.


Time for Giants to Part Ways with Hector Sanchez

San Francisco Giants backup catcher Hector Sanchez is a ball magnet.

Every single time he plays — and this is no exaggeration — he takes a savage beating behind home plate. Foul tips rock his hockey-style catcher’s mask at least three or four times a game. He also takes baseballs to the shoulders, fingers, feet and groin like you would not believe.

So to no one’s surprise, Sanchez finds himself on the disabled list with a concussion. And the Giants are taking their time bringing him back, as the team is all too familiar with concussions caused by multiple blows to the head (Mike Matheny’s playing career came to a screeching halt because of multiple concussions sustained when he strapped on the tools of ignorance for San Francisco back in 2006).

While it may seem cruel to add insult to injury, now is the perfect time for the Giants to part ways with Sanchez.

The trouble is that Sanchez’s bat is a ball magnet, too — and not in the good, solid contact kind of way. He simply can’t stop swinging at pitches in or out of the strike zone.

Simply put, Sanchez is not a good baseball player, while his replacement, Andrew Susac, is.

Sanchez has been one of the worst players in MLB this season. Take a look at how he’s fared in some key statistical categories, along with how those stats rank among fellow National Leaguers with a minimum of 170 plate appearances:

OBP K% wOBA wRC+ O-Swing % Swing %
.237 (2nd-worst) 31.1% (6th-worst) .237 (2nd-worst) 52 (4th-worst) 47.1% (2nd-highest) 63.0% (highest)

This chart essentially shows that Giants fans have selected an appropriate nickname for Sanchez. They call him “Hack-tor”.

Susac, on the other hand, is known for his plate discipline. He’s never had a BB% lower than 12.9% in four minor league seasons (Sanchez’s career BB% is 4.0%). Susac’s slash line for AAA-Fresno this season was .268/.379/.451. Hopefully he never goes back.

In 26 plate appearances for the Giants this season, Susac has a .250 average and a .308 OBP. He’s swung at just 22% of pitches outside of the strike zone (compared to 47.1% for Sanchez) and he’s struck out only 19% of the time (31% for Sanchez). Perhaps most importantly, Susac has already been worth 0.1 WAR, meaning he’s added value to the team even though he’s played in only parts of 10 baseball games. Comparatively, Sanchez has been worth -0.2 WAR in 66 games, meaning that even an average minor league replacement player would have been more valuable.

And Susac is an average replacement-level catcher at worst. In fact, it’s hard to argue that he is that bad. So there’s essentially no question that Susac is superior to Sanchez.

In a baseball era where it is increasingly accepted and known that getting on base — not making outs — is the most important baseball skill, Sanchez has proven himself to be a free-swinging out machine.

That’s why the era of Susac ought to be upon us. What’s more, backup catcher is an especially interesting position on this Giants team.

There is increasing sentiment within the organization that Buster Posey needs to be moved out from behind the dish. He’s arguably their most valuable offensive player, but as a catcher, he requires frequent days off, and the physical demands of catching already seem to be wearing Posey down.

Offensive skills deteriorate faster for catchers than for non-catchers, so as Posey ages and navigates the seven remaining years of his 9-year, $163 million contract, the Giants are absolutely right to seriously consider moving Posey to a less demanding and offensively-crippling position.

Third baseman Pablo Sandoval will be a free agent after this season, and if he walks away, it will create a glaring hole at third base — a hole that could be filled by Posey. Posey played all over the diamond in college, including shortstop and pitcher, so it’s at least possible that he could man the hot corner next year and beyond. If Posey moves to third base, Brandon Belt could stay at first and Susac could settle in as the everyday catcher.

But if the Giants re-sign Sandoval, there could be a logjam if the Giants indeed have intentions of getting Posey out of the squat.

Belt has good speed (he has 23 steals in 409 MLB games and he’s only 26 years old), so it’s possible he could play a decent left field, allowing Posey to play first base and Sandoval to stay at third. This is not ideal, and I understand that it’s possible Belt will not be a good defensive outfielder (but hey, he can’t be worse than Michael Morse, can he?).

Even if Posey remains behind the plate, he gets a lot of rest (as most catchers do), so it’s important to have a good backup catcher if at all possible. That’s why it’s time for the offensively skilled Susac to leapfrog the offensively challenged Sanchez on the organizational depth chart.

Sorry Sanchez, but Susac is the catcher of the future. It’s time to let him play.


On Chris Davis and How He Isn’t Hitting Very Well

A fair amount has been written about both Chris Davis of the Baltimore Orioles and his season. Put simply, Davis has been a train wreck combined with a tire fire. He was the third-best hitter in all of baseball last year, which is shocking for me to even write considering how bad he is right now. This is just a snapshot of his numbers between 2013 and 2014.

__ Batting Avg. On-base % ISO BABIP wOBA wRC+
2013 0.286 0.370 0.348 0.336 0.421 168
2014 0.191 0.296 0.202 0.241 0.302 89

So everything is worse, which — not surprisingly — leads to a worse season. While he’s still hitting for great power, it’s nothing close to what he was hitting in 2013. It would be pretty easy to look at his BABIP, which often is an indicator of how lucky a hitter is, and say Davis has just been tremendously unlucky this year, and was super lucky last year.

And you wouldn’t be wrong, necessarily. He has been unlucky this year. But his career BABIP is .323, which isn’t too far off from the .336 he posted last year. So I guess a positive here is that if the season were, I don’t know, 250 games instead of 162, Davis would probably stop being so unlucky and get closer to normal. Unfortunately it’s not 250 games, so he might not turn it around so quickly.

When hitters have a major breakout year like Davis did in 2013, it maybe shouldn’t be too surprising if they drop back a little in the following season. It often is a surprise, but pitchers scout those hitters a little harder, coaching staffs focus on them more, and so on and so on. So naturally, if a pitcher realizes a hitter totally crushes sliders and fastballs, that pitcher — if he’s not a dummy — will likely throw fewer sliders and fastballs, or at least fewer of those that are hittable.

Using pitch values from FanGraphs, we can see that, last season, Davis was that guy who crushed fastballs and sliders (and changeups, too).

Pitch Values Fastballs Sliders Cutters Curveballs Changeups
2013 1.7 3.4 1.98 0.94 5.71
2014 0.98 0.9 2.3 -3.07 -2.27

So Davis was better than most at hitting fastballs in 2013, and he was even better at hitting sliders and changeups. This year, though, he can’t seem to hit any of those three kinds of pitches as well, and he pretty much can’t hit a curveball or changeup at all.

Would you like to guess what non-fastball pitches he’s been getting more? Did you guess curveballs and changeups?  If you did, congratulations! You’re correct! Pitchers have adjusted to Davis hitting fastballs and sliders, and they’ve started to give him more curveballs and changeups, which, again, he can’t seem to hit this year. So part of Davis’ problem could simply be that he’s being pitched to differently.

And it’s not only that different kinds of pitches are coming to Davis. Pitchers are throwing low and away more often, and it’s hurting his numbers. Below is what I’m going to call an animation showing where pitches are coming to Davis. It’s from the catcher’s point of view, and it reads like a heatmap; white is neutral, red means more pitches are coming in that location and blue means fewer pitches are coming in that location.

pitch percent

So it’s pretty clear that 2014 pitchers are focusing on Davis low and away, which is a good idea since Davis is having trouble hitting those pitches, as shown in this second animation, or whatever it is.

avg

So pitchers are coming at him differently, and he’s hitting differently. In 2013, Davis could basically hit anything in the strike zone and even a little bit below the zone. This year, he seemingly can’t hit the ball unless it’s low in the zone, and even then it’s a little shaky.

He’s also changed his approach a little bit. While Davis is chasing fewer pitches out of the zone, he’s also swinging less in general, even at strikes, and that’s a trend that’s been going on since 2012. And not swinging at strikes isn’t always a bad thing; Joey Votto swings less than almost anyone, and he’s a pretty good hitter. What’s a little troubling is that Davis is making less contact when he does swing, and that’s also a trend two years in the making. Of course, when a guy is hitting .286 and blasting 53 home runs, who cares if he’s making less contact? But when those 53 dingers turn into 21 and that .286 average drops below .200, we can start to be concerned.

So it’s all kind of going against Davis right now. He’s trying to be more patient, but pitchers are recognizing that and throwing him more strikes. And when he gets behind in the count, it makes things a little more difficult. Plus those mean old pitchers are throwing him pitches he doesn’t hit so well. It’s been an off year for Davis, and he’s still hitting for really good power. Not as much as 2013, but still a lot. If he can do that, and maybe turn things on for the last 35 or so games and into the playoffs, his team could make some kind of run. Maybe not a great run, but some kind of run.