Archive for Player Analysis

Jason Heyward and Troy Tulowitzki’s Eroding Command of the Strike Zone

(All stats are current as of the end of April 24th.)

During the offseason, Jason Heyward and Troy Tulowitzki were two of the highest-profile players on the trade block. Heyward was ultimately dealt as the Braves gear up for the future and the Cardinals look to fortify RF after the passing of Oscar Taveras. Tulowitzki was not dealt, as the Rockies hope that they can make an improbable run to the playoffs. Both players could be looking for new homes within the next year, as Heyward hits free agency (barring an extension) and Tulowitzki would be a very tempting target at the trade deadline or in free agency.

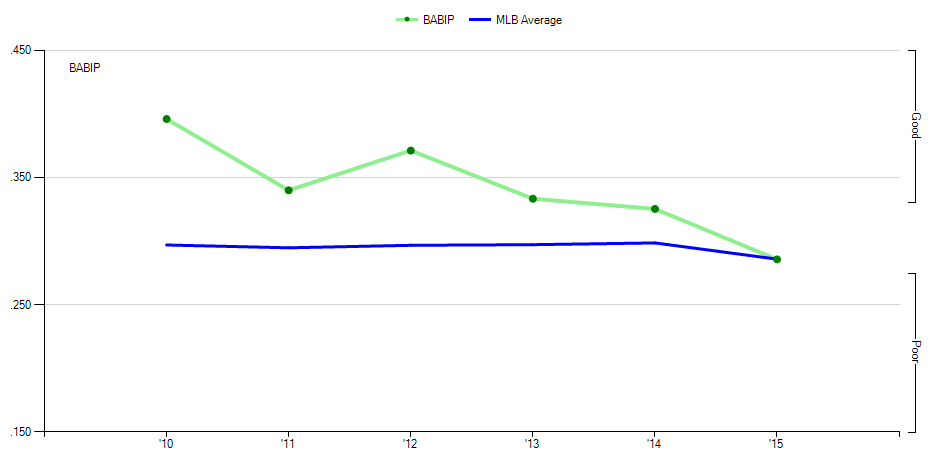
However, both players have started the season slowly. While Tulowitzki has a 103 wRC+ (which is pretty darn good for a SS), that figure is far below his 2014 results (171 wRC+) and his career figure (125 wRC+). Much of the blame can be placed on his .197 ISO, which is far below both his 2014 and career ISO. Tulowitzki has been able to counteract the drop in power somewhat due to a .370 BABIP that is far above any BABIP he has recorded over a full season. Heyward’s drop has been even more severe, as he is the owner of a B.J. Upton-esque 64 wRC+. While much of that should be attributed to a paltry .235 BABIP, some blame also can be ascribed to a poor batted ball distribution. However, it is too early to say that either player won’t see these trends reverse as the season progresses.

On the other hand, both players are suffering a precipitous and concerning decline in their plate discipline. Tulowitzki’s K rate has shot up from between 15 and 16 percent to almost 24 percent. Likewise, his walk rate has fallen to a paltry 1.6 percent as he has drawn one walk over the season. That shift is being driven by an increase in his swings on pitches out of zone, which has grown to 35 percent from 27 percent in 2014 according to Pitch F/X data:

View post on imgur.com

In addition, Tulowitzki is making less contact as he swings, as his contact rate is below 80 percent – a percentage he has never had at the end of the season. He is also swinging and missing more and is over the league average for the first time since his disastrous cup of coffee in 2006. Tulowitzki’s also seen 8 percent more pitches in the zone (a higher figure than ever before), which indicates that pitchers are not as afraid of him as they once were. All of this comes directly after he had hip surgery, which suggests that he may not be fully recovered yet or that the injury may have eroded his skills slightly.

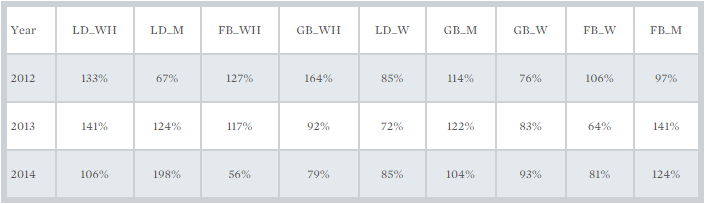
Heyward also has seen his plate discipline deteriorate but not to the same level that Tulowitzki has. First the good news: his strikeout rate, while slightly elevated from his totals in the past few years, is still in line with his career norms. However, the rest of his plate discipline numbers are worse than his career numbers. As noted by Bernie Miklasz, Heyward only has one walk, is swinging at far more pitches out of zone than ever before, and is seeing fewer pitches in the zone than ever before. Miklasz also notes that Heyward is pounding groundballs – he is currently putting 62 percent of his balls in play on the ground. This is far above his career averages (as shown in the chart below) and is a sign that chasing more pitches is not helping him generate power.

In addition to the points that Miklasz made, Heyward is also swinging far less at pitches in the zone. This season, he has swung at 58 percent of pitches in the zone, the lowest percentage since his rookie year. These diverging trends have allowed Heyward to set a personal record: for every pitch that Heyward swings at out of the strike zone, he only swings at 1.04 pitches in the strike zone.* This is far below his career ratio of 1.69.

Now, as loyal FanGraphs members (only the truly committed read the Community board!), I can hear your refrain of “Small Sample Size.” And I certainly agree that it is too early to completely believe in the magnitude of these changes. It is extremely unlikely that both players will walk less than 2 percent of the time this year. However, I believe that the magnitude and consistency of the changes is a clear sign that both players are suffering due to the erosion of their plate-discipline skills. Both players have reached the stabilization point for strikeout rate, are halfway to the stabilization point for walk rate, and Heyward is quickly approaching the stabilization point for groundball rate. In addition, per pitch metrics like O-Swing and Z-Swing stabilize quickly, with swing rate stabilizing at 50 PAs. While those stabilization points only denote the point at which the data is half noise and half signal, the changes are consistent enough across multiple measures of plate discipline that its extremely hard to argue that it could **all** be a fluke. While both of these players are plus defenders and have the power to still be plus hitters with poor plate discipline, their value will suffer unless they can find a way to turn around their plate discipline.

* This statistic can be calculated using the following formula: (Zone%*Z-Swing%)/((1-Zone%)*O-Swing%).


Chris Archer’s Early-Season Improvements

After losing David Price to a trade with the Tigers and Alex Cobb to injury, The Rays needed Chris Archer to step up this season. Chris Archer then proceeded to step up this season. He’s carrying a 36 ERA-, 80 FIP-, and 69 xFIP-. His K-BB% is 23.6, better than his career mark by 10%. Obviously his numbers have improved. But it’s April, and the question everyone asks in April is are the improvements sustainable. Real improvements are the results of real changes, so let’s look for real changes.

One of the reasons for Archer’s success this year has been due to his ability to limit walks, which before had been a bit of a problem for him. Coming into the season he had a Zone% of 43.1 which is a tad below the league average. This year, that figure has increased to 54.4%. If you throw the ball in the zone more, you’re gonna get more strikes… more strikes means fewer times behind in the count… etc. You get the idea; good Zone% is good. But it’s not just that he’s throwing more pitches in the zone; Archer is allowing less contact on the pitches he throws there. Archer’s Z-contact rate has dropped by 4% from last year. So, to sum it up, Archer is throwing more pitches in the strike zone and hitters are making less contact when he does. This explains why Archer is getting more strikeouts and conceding fewer walks. What it doesn’t tell us is how he’s doing it. To figure that out, we have to look at his pitch selection.

According to the PITCH F/X data on FanGraphs, Archer was a two-seam-first pitcher last year – throwing the pitch nearly 47% of the time and his four-seamer only about 20%. The year, Archer’s increased the usage of his four-seamer by over 23%, dropping his two-seam rate to only 12%. This change is important because, thanks to work done by Jeff Zimmerman, we know that four-seam fastballs tend get strikeouts more often than their two-seamer cousins do. The four-seam isn’t the only pitch he’s increased usage for either: Archer’s slider rate has gone up to about 39% after sitting a little below 29% last year. Once again, this is good for strikeouts. Because, not only do sliders have the highest SwgStr% among pitch types after splitters, but the increase indicates Archer is more confident in his slider, which could imply that the slider has improved. You can say the same thing about the four-seam.

If you were looking for indicators that Chris Archer’s improved numbers have a level of sustainability, there they are. Those are real changes, from a real pitcher, playing real baseball. The Rays are gonna need an ace-level performance in their rotation this year to help alleviate the loss of David Price and the temporary one of Alex Cobb. It’s beginning to look like Chris Archer is the man for the job.


Austin Jackson’s Bothersome Batted-Ball Bind

On July 30, 2014, the Seattle Mariners found themselves in the interesting position of being in playoff contention. The Mariners sported a 32-23 record, only 2.5 games back of the AL West-leading Los Angeles Angels, and owned the third-best Pythagorean record in the American League. Seattle’s newfound position as postseason hopefuls meant that they were suddenly buyers at the trade deadline – not drastically so, but in the sense that the Mariners were only a couple of upgrades away from assembling themselves a nicely well-rounded playoffs roster. Chief among these desired upgrades was a serviceable everyday center fielder, one who could replace a revolving door of below-average outfielders that included Abraham Almonte, James Jones, Stefen Romero, and Endy Chavez.

Jack Zduriencik sought to remedy the Mariners’ outfield issues with a pair of trade deadline deals. The first involved packaging Almonte and minor-league pitcher Stephen Kohlscheen to the Padres in return for Chris Denorfia, a rather unsexy deal to be sure, but one that was a success at the time in that the acquired player was not Almonte. The second deal, a three-way transaction between the Rays, Tigers, and Mariners, was collectively more sexy, but a large share of the sexy went to the Tigers, who landed Rays ace David Price. The other major components of the deal were the Rays’ acquisition of young Mariners middle infielder Nick Franklin and Tigers pitcher Drew Smyly, as well as Seattle’s prospective answer to its outfield problem: Detroit center fielder Austin Jackson.

Since his move to the Mariners, Jackson has racked up 277 plate appearances for Seattle, and the results have been fantastically underwhelming. Of the center fielders who amassed more than 100 plate appearances for the Mariners in 2014 – an uninspiring triumvirate of Jackson, Abraham Almonte, and James Jones – Jackson produced the worst offensive performance by wRC+. Jackson’s 2014 performance also disappointed even by more conventional measures:

  • Jackson totaled 34 extra-base hits in 416 plate appearances for the Tigers in 2014. For the rest of the year, in 240 plate appearances for the Mariners, Jackson managed 6.
  • Jackson’s ISO dropped from .127 to a paltry .031 with the move from Detroit to Seattle.
  • Jackson’s 2014 OBP/SLG/wOBA with Detroit: .330/.397/.321. With Seattle: .271/.264/.243.

Not great for a player only two seasons removed from a 5-win campaign.

Ostensibly, something was fundamentally different with Jackson in 2014, something that can hopefully be determined by closely examining his recent performance. Looking first to Jackson’s approach, it seems that there hasn’t been too much change over the course of his career. His K/BB ratio has generally hovered around league average and his contact rates haven’t fluctuated all that much from year-to-year. If anything, Jackson’s approach metrics look like they’re trending positively – he actually posted career bests in Z-contact% and SwStr% in 2014. If we examine Jackson’s batted ball data, however, we begin to get a little closer to the root of Jackson’s troubles of late. The most easily identifiable aspect of Jackson’s game can be somewhat distilled in the following graphic:

Over the course of his career, Jackson’s BABIP has been way above league average. He managed an absolutely ridiculous .396 BABIP in his 2010 rookie season over 675 PA, and his career-best 2012 season, in which he posted a 134 wRC+, was bolstered by a BABIP of .371. That figure would predictably fall after 2012, but between 2013 & 2014, Jackson’s BABIP only declined by .008, whereas in the same period, his wOBA fell from a very good .332 to a mediocre .292. This might suggest that in 2014 specifically, it may not have been the frequency with which Jackson was able to put balls in play so much as the quality of those batted balls that limited Jackson’s production.

Unfortunately, batted ball data is out of the scope of my access. The closest I can get to Jackson’s batted-ball profile is  by pulling data from this pre-season piece on Jackson by Jake Mailhot over at Lookout Landing, and indirectly from Jeff Zimmerman’s work on hitter analytics at RotoGraphs (the relevant batted-ball spreadsheet now seems to be unavailable for some reason).

To quickly explain – this table charts batted-ball rates expressed as a percentage of league average. Batted balls are separated into three categories (line drive, groundball, fly ball) which are then further divided into subcategories of contact quality (Well-Hit, Medium, and Weakly-hit). These categories are ordered left-to-right from highest to lowest based on xBABIP.

Mailhot astutely notes an alarming drop in well-hit groundball rate – from 64% above league average in 2012 to 11% below league average in 2014. This is accompanied by a commensurate rise in weakly-hit groundballs. Jackson’s well-hit line-drive rate also drops by a sizable amount, hovering around league average in 2014, while his rate of medium-hit line drives balloons to 198% of league average in 2014. Mailhot also points out possibly the most substantial shift: an immense drop-off in well-hit fly-ball rate in 2014 to 56% of league average, a trend corroborated by data pulled from Baseball Heat Maps on Jackson’s average fly ball distance over his career:

Jackson’s high rate of well-hit line drives and ground balls prior to 2014 puts into perspective the aspects of his game that brought him success earlier on in his career, and his sharp decline in those metrics in 2014 even more so. To put it in exceedingly simple terms, Austin Jackson just didn’t really hit balls hard in 2014, something he was quite good at doing before that season. Judging by the splits, most of the not-hitting-balls-hard occurred after the move to Seattle.

Jackson’s 2013 was much better than his 2014, but it is the beginning of a short trend of BABIP decline. From examining batted-ball data, we can infer that quality of contact has a significant bearing on BABIP, and this makes sense using conventional logic as well. Hard-hit line ground balls are more likely to find gaps between defenders, hard-hit line drives are more likely to drop in for hits, and hard-hit fly balls are more likely to turn into extra-base hits (although BABIP ignores home runs). The easy explanation is that Jackson lost some power in 2014. I don’t have enough film on Jackson to know for sure if there’s a visually concrete reason for this (if, for example, there’s something off in his swing mechanics), but data from 2014 indicates that Jackson just hasn’t been making good contact.

Jackson’s issues are probably best explained by his batted-ball troubles, but park factors likely play some part as well, with Comerica Park being relatively more hitter-friendly than Safeco Field. Safeco’s pitcher-friendly park factor and the ‘dead ball effect’ of Seattle’s marine air probably have something to do with Jackson’s decline in fly-ball distance, although Jackson is himself contributing to that same decline in some measure.

At the time of his acquisition, a merely average performance from Jackson would have been a significant upgrade over the convoluted mishmash that had previously taken the field for the Mariners. Unfortunately, he was unable to even provide replacement-value production after coming to Seattle, totaling -0.4 wins above replacement in 2014. The Mariners traded for an above-average player and received the production level of a player who theoretically wouldn’t cut it in the big leagues altogether.

The prospect of 2015 being a bounceback year for Jackson has not gone over too well in these first few weeks. ZiPS (R) and Steamer (R) still think Jackson could manage 1.7-2.1 WAR on the season, which is a bit below his peak, but I think the Mariners would take that statline in a heartbeat. I’ve gone this far without mentioning Jackson’s other tools, but as a 28-year-old without a concerning injury history, there’s not as much reason to worry about his defense and baserunning as there is to worry about his offensive output. Jackson was a below-average defender by UZR in 2013/2014 and has been worth approximately 4 baserunning runs above replacement in each of the past couple of years, neither of which have dictated his value nearly as much as his offense, or lack thereof. Using those numbers as a serious predictive measure from year-to-year is simply not very useful at this point.

Lloyd McClendon was Jackson’s hitting coach back in Detroit, and suffice it to say he probably has a better grasp on Jackson’s habits as a batter than most. If anyone’s able to get Jackson back on track this season, it’s probably McClendon. At time of writing (the 18th of April), Jackson managed a slightly encouraging 2-hit, 1-walk performance against the Rangers. It’s early yet in the season, and there’s time for Jackson to hopefully figure things out. Alternatively, if Jackson can’t find some of his pre-2014 form this season, the Mariners might once again find themselves in the same trade deadline predicament from last year – only this time, there’s not an obvious trade chip à la Nick Franklin. Then again, 2015 is Jackson’s last year under team control, so the Mariners may simply choose to let him walk after the year is over if they’re not satisfied with his performance. If that’s the case, it’s hard to imagine looking back on the 2014 Jackson trade with anything but the same tinge of regret and frustration that has colored so many other Mariners transactions of the last decade.


Gausmanian Distribution

At the end of spring training, Buck Showalter banished Kevin Gausman from the rotation in favor of Ubaldo Jimenez, a pitcher with a much higher salary and much less talent.  Many assumed that Jimenez’ salary largely dictated the move. Yes, he outpitched Gausman in spring training (4.44 ERA to 7.04), but it’s hard to believe that Showalter invests very much in spring training stats, and in any case if you put “4.44” into Google Translator, “success” is unlikely to be one of the resulting character strings.

One Orioles fan of my acquaintance heard that Showalter’s decision had more forethought: Buck’s intent may be to use Gausman much as the fireman reliever of old, and bring him in to critical situations in ballgames regardless of today’s ossified reliever usage patterns. Bill James long ago established that this is the most effective way to use a top-flight reliever, but it is less clear that this is the best way to use a potential #1 starter. Gausman is the only pitcher on the Orioles 25-man roster who has even  a prayer of turning into an ace, and it seems unlikely he’ll do it from the pen.

Gausman’s had a somewhat unusual start to his career. In his first two years as a major leaguer, he started 25 games and made 15 relief appearances. There are a total of 15 active pitchers who had at least 25 starts and 15 relief appearances in their first two years:


(Table courtesy of the invaluable Baseball Reference Play Index)

It’s certainly an eclectic mix. Only Buehrle established himself as an ace, though Arroyo has had a good career as a mid-rotation workhorse, and Masterson and (to a lesser extent) I-Can’t-Believe-It’s-Not-Fausto-Carmona have made useful contributions. For other starters on this list (Wood, Kelly) it’s too soon to tell. Affeldt and Stammen wisely gave up starting and have become bullpen mainstays. More sobering, many of the names on this list have had their careers derailed by injuries. It’s hard to know whether the mixed usage contributed to injury problems for guys like Ogando, Billingsley, and Holland; it is equally possible that conserving these young arms early may have averted even more serious or earlier arm trouble.

Gausman sits uneasily here; he is by far the highest drafted pitcher on this list (fourth overall in 2012). It is unsurprising to see a club experiment with a 38th-round pick who struggles to break a pane of glass, like Buehrle. Such tinkering is less common with a player drafted to be a rotation anchor. Indeed, there are only two other first-rounders on this list, Billingsley and Lynn.

In his first season (2006), Billingsley started 16 games and came in from the bullpen twice. He put up a respectable 3.80 ERA, but with atrocious peripherals (5.8 BB/9, 5,9 K/9). The Dodgers understandably exiled him to the bullpen to start the 2007 season, but Dresden-like pyrotechnics from Proven Veterans Mark Hendrickson, Brett Tomko, and Jason Schmidt forced the Dodgers to put Billingsley back in the rotation in June, and he acquitted himself reasonably the well the rest of the way. He would go on to have uneven success over the next four seasons until diagnosed with a torn UCL in September 2012. He has pitched in two major league games since.

Lance Lynn offers a happier comp for Gausman. He appeared largely in relief (2 starts in 18 games) in 2011. Despite Kyle McClellan’s runtastic performance as the Cardinals’ fifth starter, LaRussa elected not to insert Lynn into the rotation; the Cardinals instead traded for Edwin Jackson, who stabilized the fifth spot.  This seems similar to Showalter’s choice: go with the established if not necessarily dominant veteran in lieu of the risky young flamethrower. Lynn had put good numbers in 2011 at AAA, but not in 2010. The Cards’ reluctance to turn over a rotation spot to him in the midst of a playoff run was understandable. Lynn has been in the rotation since 2012, and has consistently produced very close to his career marks of 3.32 FIP and 2.71 K/BB, despite some jumpiness in his ERA.

Both these examples tend to suggest Showalter is making a mistake. The Dodgers finally ran out of Jason Schmidts, while the Cards went with the good-enough E-Jax (and, to  be fair, won the World Series). But in each case the young replacement would quickly prove himself superior to the older and supposedly safer option when finally given the chance. There are very few who would predict that, over the course of 30 starts, Jimenez will outperform Gausman in any significant statistical category.

But Showalter has other things on his mind. Specifically, this:

#27 Orioles


Name IP ERA FIP WAR
Chris Tillman 184.0 4.10 4.40 1.4
Wei-Yin Chen 169.0 4.04 4.17 1.5
Miguel Gonzalez 157.0 4.42 4.84 0.5
Bud Norris 154.0 4.15 4.30 1.1
Ubaldo Jimenez 146.0 4.28 4.38 0.9
Kevin Gausman 91.0 3.97 4.00 0.9
Dylan Bundy 18.0 4.40 4.56 0.1
Total 919.0 4.17 4.38 6.4


Yep, this is the FanGraphs Depth Chart projection for the Orioles starting rotation, with the O’s ranked 27th out of 30. Not a single starter checks in with a FIP under 4.00. This is a shaky rotation, and the Orioles have no quick way of making it better. Eventually, perhaps as early as next year Gausman, Bundy, and Hunter Harvey will form an enviable top 3, but there’s another problem on Buck’s plate. Next year, much of the current roster may be lost to free agency, including Chris Davis, Matt Wieters, Chen, and Norris. The Orioles are under enormous pressure to win now.

And Gausman can help! Because at this stage of his career, he is a much better reliever than starter. The big difference is in strikeouts:

AL average starter K/9: 7.1

AL average reliever K/9: 8.3

Gausman as starter K/9: 7.0

Gausman as reliever K/9: 11.7

That there is some major whiffage for a staff in dire need of it. Put Gausman together with Zach Britton, Darren O’Day, and Tommy “Big Game” Hunter, and the Orioles have a fully weaponized bullpen.  Buck’s plan is to hold on for the first five or six innings, and them shut down the opponent’s offense while the Orioles bats bludgeon their way to victory. And with Gausman acting as a mobile reserve, Showalter can shrink the innings for which the starters are responsible, but do so on a game-to-game basis. On those days when the starters happen to be effective they can go longer, and on those days (more often than not, one suspects) that they get into trouble, Showalter will be able to address some of that trouble with the best arm on the roster.

This isn’t the way I would ordinarily do it, but then again, this isn’t the roster I would have assembled. Showalter has repeatedly shown an ability to work with the tools he has rather than impose some prefabricated tactical rule set that disregards the strengths and weaknesses of his players. Baltimore’s road to the playoffs is neither straight nor sure, but at least it’s Showalter behind the wheel.


Are Two Opening-Day Homers Merely Dust-in the Wind?

As a Red Sox fan, I got very excited opening day when Dustin Pedroia hit two home runs. One of the big questions of this offseason is whether he has upper-single-digit homer power, or upper-teens homer power. Of course, as a thinking baseball fan, my head tells me to avoid getting overly excited about a small sample size. But does the two-HR outbreak actually tell us nothing? I think the expectations going into the season combined with Pedroia’s performance in his first game is a perfect situation to use Bayes’ Theorem.

To elaborate, I think Pedroia’s expectations going into this season have a bimodal distribution. If you look at his 2008-2012 seasons, he averaged 16 HR per year. His last two seasons averaged 8 HR per year. Was this due to a real decline, or due to injuries that sapped his power? While someone like Mike Trout might have a nice normally-distributed expectation around 35 HR, I expected Pedroia to have an either/or season: he’d either get back to 2008-2012 production, or continue as a 8-HR guy.

Now for a review of Bayes’ Theorem: it tells you how to update your prior beliefs given an observation. The formula for this is P(A|B) = P(B|A)*P(A)/P(B), where A and B are events, P(A) and P(B) are the probabilities of those events, and P(A|B) or P(B|A) should be read as “Probability of A given B,” or “Probability of B given A,” respectively. Specifically, in this case, A is “Dustin Pedroia is a 16-HR guy”, and B is “Dustin Pedroia hit 2 HR in his first game of the season”. I had a preseason belief about P(A), but I want to update it given that event B has occurred.

As implied above, I’m going to simplify Pedroia’s season outcomes into two possible outcomes: He is an 8-HR guy, or a 16-HR guy. Before the season, I’m going to guess that I had about a 50-50 belief that he was either one. Another assumption I’m going to make, to make the math easier, is that a season will see 640 plate appearances. You can make your own assumptions, but this is a demonstration of how much Bayes’ Theorem helps us update beliefs based on just one observation.

We need to determine three quantities to do our calculation now:
1. P(A)—probability that Pedroia is a 16-HR guy
2. P(B|A)—probability that we would see Pedroia hit 2 HR in his first 5 plate appearances, given that he is a 16-HR guy
3. P(B)—probability that we would see Pedroia hit 2 HR in his first 5 plate appearances (taking our 50-50 chance that he’s a 16 or 8-HR guy as a given)

1. Probability that Pedroia is a 16-HR guy

Easy. By assumption, P(A) is 50%.

2. Probability that we would see Pedroia hit 2 HR in his first 5 plate appearances, given that he’s a 16-HR guy

Tougher, but we can use a binomial probability model. That is 5C2*P(HR)^2*(1-P(HR))^3. When we have 16 HR in 640 plate appearances, P(HR) is 1/40, and 1-P(HR) is 39/40. This turns out to be .00579. P(B|A)= 0.579%.

3. Probability that we would see Pedroia hit 2 HR in his first 5 plate appearances, with preseason assumptions

This is the weighted average of all his possible season outcomes—so probability of 2HR in 5PA, given that he is a 16-HR guy, times the chance that he’s a 16-HR guy, PLUS, probability of 2HR in 5PA, times the chance that he’s an 8-HR guy. The same calculation as in number 2 can be done for if he’s an 8-HR guy, yielding an answer that the chance that he’d hit 2HR in 5PA is 0.151%. Given our calculation in the above paragraph, and our preseason assumption that it’s 50-50 that he’s an 8 or 16-HR guy, that gives us a weighted average P(B) = 0.365%.

So now we can mash all of those numbers into Bayes’ equation, and we find that .50*.00579/.00365 = .794, or 79.4%! Turns out that my Red Sox-loving lizard brain was not wrong! If you believed preseason that there was a 50%-50% chance that Pedroia would return to his 2008-2012 form, you should rationally update your beliefs to 80%-20% on the minuscule sample size of just two home runs in five plate appearances! Another note is that we should be forward-looking: since he has nearly a full season of plate appearances remaining, it might be rational to think that he’s likely to be an 18-HR guy, now that he has 2 in the bag.

This method could be adapted to a continuous expectation of outcomes, allowing a chance that Pedroia might be something besides an 8HR guy or a 16HR guy (although you and I know that that is clearly absurd).


Z-Scores in Sports (a Supporting Argument for zDefense)

This is part 3 of the Player Evaluator and Calculated Expectancy (PEACE) model, which is an alternative to Wins Above Replacement.  This article will introduce evidence that z-scores can be converted into runs (or points in other sports) with accuracy and reliability, as well as analyze the results that zDefense has produced.

Recall that zDefense is broken down into 4 components: zFielding, zRange, zOuts, and zDoublePlays.  The fielding and range components depend on the accuracy of Calculated Runs Expectancy, which I introduced in Part 1.  Outs and double plays, though, use a different technique: they take z-scores for the relevant rate statistics, then multiply by factors of playing time.  Here were the equations:

  • zOuts = [(Player O/BIZ – Positional O/BIZ) / Positional O/BIZ Standard Deviation] * (Player Innings / Team Innings) * (√ Player BIZ / 2)
  • zDoublePlays = [(Player DP/BIZ – Positional DP/BIZ) / Positional DP/BIZ Standard Deviation] * (Player Innings / Team Innings) * (√ Player BIZ / 2) * Positional DP/BIZ


We can set up models in other sports that estimate point differentials using very similar techniques.  I’ve developed one for college football and another for the NBA.

For the first model, I’ve used the data for every Division I FBS football team from 2000-2014 (1,802 teams), and I defined the relevant statistics and their “weights” as such:

  • zPassing = [[Completion Percentage z-score * Completions per Game] + [Passing Yards per Attempt z-score * Passing Attempts per Game]] / 10
  • zRushing = [Rushing Yards per Attempt z-score * Rushing Attempts per Game] / 10
  • zTurnovers = [Turnovers per Game z-score]
  • zPlays = [Number of Offensive Plays per Game z-score] 


These 4 components summed make up zOffense, while taking each team’s opponents’ calculations results in zDefense.

What I found after summing the different components was that the resulting number, when divided by the number of games played, was a very accurate estimator for a team’s average point differential.

Among the nearly 2,000 college football teams, the average difference between zPoints (calculated margin of victory) and actual MOV was just 3.21 points, with a median of 2.77, and a max difference of 13.97 points.  About 20% of teams’ MOV were calculated to within 1 point or less, 53% were accurate to 3 points or less, 79% to 5 points or less, and 99% to 10 points or less.  The regression model for this dataset can be seen below:

http://imgur.com/kUDwbA7


The NBA model has similar results using 6 parts:

  • z3P (3-point shots) = [[3P FG% z-score * 3-point attempts * 3] / 10
  • z2P (2-point shots) = [2P FG% z-score * 2-point attempts * 2] / 10
  • zFreeThrows = [FT% z-score * free throw attempts] / 10
  • zTurnovers = [Turnovers per Minute z-score * League Average Points per Possession] * 2
  • zORB (offensive rebounds) = [Offensive Rebounds per Minute z-score * League Average Points per Possession]
  • zDRB (defensive rebounds) = [Defensive Rebounds per Minute z-score * League Average Points per Possession] 


Similar to the football model, these 6 components make up zOffense, while each team’s opponents’ calculations make zDefense.  I particularly like z3P, z2P, and zFT because they multiply the z-score by the “weight”: 1, 2, or 3 points.  Recall that zRange is multiplied by the IF/OF Constant, which is just the difference, on average, in runs between balls hit to the outfield vs. balls that remain in the infield.

I’ve only done the calculations for the 2013-2014 season, where teams averaged 1.033 points per possession.  To convert to zPoints in this model, add zOffense and zDefense, then divide by 5.

In most seasons, elite teams will have an average point differential of +10, while terrible ones will hover around -10.  On average, the NBA model had an average difference between the calculated and actual differential of just 1.331 points, with a median of 0.800.  17 out of 30 teams were calculated within 1 point, 25 within 2, and 29 out of 30 were accurate to within 5 points per game.

The fact that these models can be created using the same general principle (rate statistic z-scores multiplied by a factor of playing time equates relative points) provides some evidence that similar results are calculable in baseball.  This is the basis for zDefense in PEACE.  Let’s look at the results.

Most sabermetricians would turn to the Fielding Bible Awards for a list of the best fielders by position in any given year, so we’ll use those results to compare.  If we assume that the Fielding Bible is accurate, then we would expect zDefense to produce similar conclusions.  Comparing the 2014 winners to the players ranked as the best at their position by zDefense, we can see some overlap.  The number in parentheses is the positional ranking of the Fielding Bible Award winner by zDefense.

  • Position: Fielding Bible Winner (#)…zDefense Winner
  • C: Jonathan Lucroy (12)…Yadier Molina
  • 1B: Adrian Gonzalez (1)…Adrian Gonzalez
  • 2B: Dustin Pedroia (2)…Ian Kinsler
  • 3B: Josh Donaldson (2)…Kyle Seager
  • SS: Andrelton Simmons (8)…Zack Cozart
  • LF:Alex Gordon (1)…Alex Gordon
  • CF: Juan Lagares (3)…Jacoby Ellsbury
  • RF: Jason Heyward (1)…Jason Heyward
  • P: Dallas Keuchel (5)…Hisashi Iwakuma

The multi-position winner, Lorenzo Cain, was also rated very favorably by zDefense.  While most positions don’t have a perfect match, every single Fielding Bible winner was near the very top of their position for zDefense.  This is the case for almost every instance, which isn’t surprising: if there were drastic disagreements about who is truly elite, then we would suspect one of the metrics to be egregiously inaccurate.  Instead, we see many similarities at the top, which provides some solid evidence that zDefense is a valid measure.

As always, feel free to comment with any questions, thoughts, or concerns.


Who Won the Kimbrel Trade?

Wow. Craig Kimbrel traded right before the start of the season. I have to admit to being rather shocked. I know the Braves are rebuilding this off-season and it made sense to trade him. He is very highly valued for a player who only pitches 60 innings a season, perhaps over-valued. If the Braves are going to be hopeless this year then who needs a dominant single-inning pitcher?

The trouble is I love watching Kimbrel pitch, no matter the situation. I live in London, in the UK, so a lot of Braves games happen from 1-4am and I don’t get to watch them live. Every morning I use my MLB.com subscription to check the last night’s action. If I don’t have the time to watch the whole game, which is common, I skip to the innings where the Braves scored plus any inning Kimbrel pitches. Pace, a banana curveball and strikeouts, Kimbrel is one of those rare players who is worth watching every minute he plays. Even when he is (rarely) hit you feel a strikeout is coming next. So emotionally, I hate to see him traded (just like I hated seeing Heyward traded). Lots of reporters are saying the trade is a good deal for both sides or an outright win for the Braves, so in emotional despair, I thought I’d have a proper look into it.

The facts of the trade

To the San Diego Padres:

  • Craig Kimbrel – 3 years at $34.75m (includes option buyout) or 4 years at $46.75m
  • Melvin Upton Jr – 3 years at $48.15m

To the Atlanta Braves:

  • Carlos Quentin – 1 year at $11m (includes option buyout) or 2 years at $18m
  • Cameron Maybin – 2 years at $16.2m (includes option buyout) or 3 years at $24.2m
  • 2 prospects and 41st pick 2015 draft

N.B. Bold text highlights the likely choices.

I’ll not be analysing the prospects in much detail, instead ignoring the less relevant trade pieces and looking at the end outcomes. My method is below, but if you like, skip to the summary, that’s the important bit.

Methods

From the Padres POV

  • Upton not wanted/needed. Treat him as a league-minimum replacement-level 5th outfielder for 3 years (cost $1.5m). Add the rest of his salary to the Kimbrel contract.
  • Dumped 2 unneeded players and $27.2m in contracts off the books. Remove these values as savings for the Kimbrel contract
  • Gained Craig Kimbrel. Assume option taken (it is great value – see later*). Contract for 4 years at $46.75m – $27.2m (from Quentin and Maybin savings) + $46.65m (Upton cost)
  • Given up 3 prospects (effectively); 1 good (Wisler), 1 risk (Paroubeck) and 1 draft pick

I feel these are all reasonable assumption/treatments. The Padres want Kimbrel, don’t care much about what they get from Upton (assuming he continues as in 2013-14) and used the Quentin and Maybin savings to pay for it all.

From the Braves POV

  • Quentin not wanted/needed (not sure why – seems a better bench bat than most and nobody will trade for him as they know they can get him for minimum once the Braves cut him). Add his contract to the 2015 payroll – $11m
  • Maybin – Assume continues poor health/form and option buyout is taken. Treat as decent defensive replacement OF (23 career DRS in 8 years). Possibly gets 75 games a season but produces nothing more than T.Cunningham in AAA so set effective salary to league minimum – $1m for 2 years. Add rest of his contract to 2015-16 payroll ($15.2m over 2 years)
  • Payroll changes:
    • Savings – Kimbrel ($46.75m – 4 years), Upton ($48.15m – 3 years)
    • Wastings – Quentin ($11m – 1 year), Maybin ($15.2m – 2 years) – both include buyouts
  • Receive 3 prospects (effectively); 1 good (Wisler), 1 risky (Paroubeck) and 1 draft pick

Again, I feel these assumptions/treatments are reasonable. Maybin may produce better than this, but his batting numbers were as bad as M. Upton the last few years (70-80 wRC+) so I don’t think we can expect much more of him than Melvin (apart from his defence being better).

Summary

Padres POV

  • Get Craig Kimbrel – effectively 4 years for $66.2m ($16.55m/year)
  • Get spare replacement-level 5th OF at minimum salary for 3 years
  • Lose 3 prospects; 1 good, 1 risky, 1 draft pick

Braves POV

  • Lose Kimbrel (and M.Upton)
  • Get spare replacement-level 4th OF at minimum salary for 2 years
  • Payroll savings $67.7m over 4 years ($16.9m/year average)
  • Get 3 prospects; 1 good, 1 risky, 1 draft pick

Analysis

Lots of contract money going back and forth, but the end result is that the Braves get payroll savings of around $17m a year for 4 years and 3 prospects and the Padres give up 3 prospects to get Kimbrel at a reasonable free agent price* of around $17m a year for 4 years.

If you consider that the Padres would have lost that 3rd prospect (the draft pick) if they signed Kimbrel as a free agent, the deal starts to look pretty good for San Diego and AJ Preller. The Padres almost certainly wouldn’t have been able to sign Kimbrel as a free agent with other teams competing (everyone needs a Kimbrel and the Dodgers/Yankees/Tigers/Red Sox etc all have the money for him). The contract would certainly have been longer as well (see footnote on Kimbrel’s historic value*). The Padres are paying Kimbrel a lot, but the amount is fair and they didn’t give up much.

The Braves had signed Kimbrel to a much friendlier contract than he would have got as a free agent (he’s homegrown and a Braves fan so gave a large discount – again see footnote*). Kimbrel gets $13m /year for his free-agent years, when he could have had much more. John Hart effectively used Kimbrel’s generosity to swap the spare value for 3 prospects, one of whom is extremely risky (Paroubeck) and one who is completely unknown (the draft pick). The Braves have rid themselves of Upton, but in taking back other contracts they have effectively only saved the money they should have been paying Kimbrel (had he not given a home discount).

In conclusion, John Hart basically declared he didn’t want a well-paid but high-value closer and swapped it for one good (but not great) prospect and two unknown prospects. So how do I feel now? I would have preferred to watch Kimbrel play for my team every week… Enjoy it San Diego.


*A footnote on Kimbrel’s free agent value

Craig Kimbrel is currently 26 years old and 10 months. Below is a summary list of contracts for comparable relievers and their ages when signing.

Reliever Contract Age at signing Average salary/year
David Robertson $46m – 4 years 29 $11.5m
Andrew Miller $36m – 4 years 29 $8.0m
Jonathan Papelbon $50m – 4 years 32 $12.5m
Koji Uehara $18m – 2 years 40 $9.0m
Joe Nathan $20m – 2 years 40 $10.0m
Mariano Rivera 38 $15.0m
Aroldis Chapman (arb2) $8m – 1 year 27
Greg Holland (arb2) $8.25m  – 1 year 29
Kenley Jansen (arb2) $7.425m – 1 year 27


You’ll notice that Kimbrel is younger than them all and although the average yearly value is not as high as Kimbrel’s $13.0m 2016 salary, the elite arbitration-eligible relievers are likely to beat them all (apart from maybe Rivera). If he were a free agent this last winter, you can assume that he would have been offered 5-year (and possibly longer) contracts.

Kimbrel’s career numbers are also historically unprecedented at his age. This has been said many times before, but my favourite Kimbrel stat is the WAR leaders for relievers over the last 10 years. Kimbrel has the 5th highest WAR from 2005-2014. He entered the league at the end of 2010. Since entering the league in 2010 he leads reliever WAR by 1.5 over Holland and Chapman (who have comparable service time). Before signing his (very team friendly) extension Matt Swartz estimated his first year of arbitration salary should be $10.2m. For a detailed analysis of how much Kimbrel is worth I recommend you read his article (http://bit.ly/1GEjKyT). The point being, he is probably worth at least a $17m/year, 4 year contract.


References

http://www.spotrac.com/mlb/san-diego-padres/melvin-upton/

http://www.spotrac.com/mlb/atlanta-braves/cameron-maybin/

http://www.spotrac.com/mlb/san-diego-padres/craig-kimbrel/

http://www.spotrac.com/mlb/atlanta-braves/carlos-quentin/

http://www.fangraphs.com/statss.aspx?playerid=5015&position=OF

http://www.fangraphs.com/statss.aspx?playerid=5223&position=OF

http://www.fangraphs.com/blogs/evaluating-the-prospects-san-diego-padres/

http://www.baseball-reference.com/players/r/riverma01.shtml

http://www.fangraphs.com/leaders.aspx?pos=all&stats=rel&lg=all&qual=y&type=8&season=2014&month=0&season1=2005&ind=0&team=0&rost=0&age=0&filter=&players=0

http://www.mlbtraderumors.com/2013/10/arbitration-breakdown-craig-kimbrel.html


Six Feet Under: Evaluating Short Pitchers

It’s September 10th, 1999, and the small flame-throwing right-hander from the Dominican Republic just struck out Scott Brosius and Darryl Strawberry. He’s about to get Chuck Knoblauch swinging (and missing) on 1-2 count for his 17th strikeout of the night to finish the game. He does, and the fans at the old Yankee Stadium go nuts, for they’ve just seen Pedro Martinez’ finest start in the greatest pitching season of all time. The final score is 3-1, with the only Yankee run, and hit, coming off a Chili Davis home run. Pedro is 5’11’’ and 170 lb, one of the smallest pitchers in baseball. While most players tower over him off the mound, Pedro writes a different story when he’s pitching. The Yankee hitters fail to notice his height when he kicks his leg up, down, and serves a 95-mph fastball from a three-quarters delivery at their eyes.

The average male height in the U.S. is 5’10’’. You’d never know this from watching a baseball game, where the average height is about 6’2’’, with pitchers just a little taller at about 6’3’’. We all remember the success Randy Johnson had at 6’10’’, and his height was always considered an advantage. When we watched Pedro Martinez, however, commentators and baseball men viewed him as an exception to some obscure and unwritten rule: that shorter athletes can’t become successful pitchers.

Six feet, like 30 home runs or a .300 batting average, has become a number associated with a distinct meaning. If you hit 30 home runs, you’re a power hitter. Hit 29 homers, and you have some pop. If you hit .300, you’re a great hitter. Hit .299, and you just missed hitting .300. Similarly, if you’re six feet, you can pitch. If not, you’re short, but at least you might get an interesting nickname like Tim Lincecum’s (5’11”) “The Freak.”

Most Major League pitchers fall between 6’1’’ and 6’4’’. We can look at the height distribution for pitching seasons of the last 5 years and see that it’s approximately normal:

By this approximation, the chance of randomly selecting a pitcher of the last 5 years who is shorter than 5’11’’ is about 5%.

Are short pitchers really destined to fail? We’ve all been told that it’s better to be taller if you pitch. But is this true? Let’s consider short pitchers to be 5’11’’ or under and examine their effectiveness and distribution in comparison to taller pitchers, who we’ll consider to be 6 feet or taller.

The top ten best pitching seasons for shorter pitchers of the last 5 years are:

We notice that Tim Lincecum appears on this list twice and Johnny Cueto appears on it three times. All of these pitchers are 5’11’’ with the exception of Kris Medlen, who is 5’10’’. So, we see that successful pitching seasons by short pitchers don’t come completely out of the blue. Short pitchers can be successful and can dominate batters, most of whom are much taller, as Cueto did last year and in 2012.

In fact, short pitchers aren’t all that rare to come by, although they’re considerably rarer than taller pitchers. In the last 5 years, there have been 23 instances of short starting pitchers throwing at least 150 innings. In comparison, there have been 402 instances of this type for taller starting pitchers.

Shorter pitchers are generally relegated to the bullpen; there have been 95 instances in the last 5 years of full-time short relief pitchers and 968 instances of full-time taller relief pitchers.

We can see the average WAR breakdowns for all of these pools of players in the following table, along with P-Values for a two-sided t-test comparing the short relievers against the tall relievers and the short starters against the tall starters:

What the 0.0005 is telling us, here, is that we would observe these results by chance alone with probability 0.0005. Thus, there is actually a significant difference in the mean WAR for short relievers and the mean WAR for tall relievers (obviously favoring short relievers). On the other hand, the difference between the starters is not significant. Either way, we have no evidence to suggest that shorter pitchers are any less effective than taller pitchers.

Are shorter pitchers undervalued in the baseball market? If so, to what extent? We can approach this by examining the WAR value of a pitcher relative to his salary in free agency. We can do this by comparing the height groups within relievers and starters (since relievers are generally valued differently than starters).

However, we find that in the last five years, there are only 4 instances of a starter 5’11’’ or shorter pitching for a team that acquired him via free agency; and all of them are Bartolo Colon seasons from 2011-2014.

Fortunately, there are more instances of this in relievers, which is what we’ll examine. We notice the distribution of WAR and relievers’ salaries in free agency:

We see that short and tall relievers are clustered between -1 and 1 WAR and $1 million and $5 million dollars. However, we see several taller relievers past the $7.5 million mark with unremarkable WARs, which we don’t see for shorter relievers. From this, we would suspect that taller relievers are being overvalued while shorter relievers are being undervalued.

This is, in fact, the case: short relief pitchers are producing 2.33 WAR for every $10 million they earn in free agency while taller relievers are producing 1.36 WAR for every $10 million they earn. In comparing these values with a one-sided t-test, we acquire a P-Value of 0.0018, meaning these are results we would acquire by chance only .18% (a significant value) of the time. And so it goes, relievers under 6 feet are actually about 1.7 times as valuable as their taller counterparts.

Is there something inherently different about shorter pitchers that makes them less capable of pitching successfully in the big leagues? The evidence says no. In fact, it might be more worthwhile for General Managers to draft pitchers under 6 feet tall and reap the rewards.

Just because an athlete doesn’t tower over his opponents off the mound, doesn’t mean he can’t bring 55,000 dumbfounded Yankee fans to their feet on an unassuming September evening.


Robinson Cano’s Replacement-Level Floor

Robinson Cano’s power vanished in 2014 without a clear explanation.  Most believe that he will be valuable even if the power does not return.  I think Cano’s risk going forward is greater than meets the eye.

After sporting an ISO of at least .199 every year from 2009 to 2013, Cano posted a mark of .139 in 2014.  There is reason to believe that this power outage is permanent.  Robinson Cano was a different kind of hitter in 2014.  His ground ball percentage was 53% (up from 44% in 2013), and his average HR/FB distance plummeted from 292 to 278.  Cano was mostly incapable of hitting fly balls to his pull side, which is where his home-run power used to be, despite swinging at more pitches middle-in.  Cano’s aging bat may be unable to turn on major-league pitching the way it used to.  As noted elsewhere, Cano’s 2014 power numbers had little to do with the move from Yankee Stadium to Safeco.  His problem was that he hit the ball in the air less frequently, with less authority, and to the wrong side of the ballpark.

Aging may have played a role, but it is unusual for an elite slugger’s power to disappear at age 31 without something else going on.  Perhaps Cano was dealing with an injury.  Perhaps his amazing run from 2009-2013 was fueled by PEDs.  We don’t know.  But consider the similarities between Cano’s pre-elite 2008 line and his line from last year:

Year NI BB% K% ISO BABIP WAR
2008 3.6% 10.3% .139 .283 0.1
2014 6.1% 10.2% .139 .335 5.2

It’s easy to forget that Cano was a replacement level second baseman in 2008.  BABIP (along with the changing run environment) is mostly what separates his 2008 replacement level performance from the five-win version of Cano we saw in 2014.  The stability of last year’s BABIP may be the key to Cano’s value going forward—a terrifying thought for the Mariners, who presumably did not intend to invest $240 million in the vagaries of BABIP.

There is conflicting data on what to expect from Cano’s balls in play in 2015.  For example, ZIPS predicts .323—not so bad.  Jeff Zimmerman’s xBABIP formula predicts .299—much closer to the 2008 disaster scenario.  Neither of these predictions fully accounts for shifts, and Cano’s performance against them in 2014 is concerning.  His BABIP was .388 against the shift and .303 without it.  This is disconcerting because Cano displayed no such shift-beating prowess before last year, and his 2014 spray chart suggests no change in his approach that would justify any BABIP spike.  To the contrary, last year Cano hit an alarming number of grounders to the right side of the infield, which should have favored the shifted infield defenses.  It appears that Cano got lucky—perhaps very lucky—with his 2014 balls in play.  My money is on something closer to the xBABIP prediction for 2015.

Cano went from an elite slugger to a BABIP-fueled slap hitter in a short period of time.  His 2014 output was akin to an early-career Ichiro, except unlike Ichiro, we lack assurances that Cano will maintain the high BABIP.  If the power is truly gone and the BABIP craters, he’s toast—or at least something closer to league average.  The risk of collapse is higher than most want to believe, if for no other reason than this same risk was once realized by the same player.


Analyzing David Wright With Just One Swing

2014 was a disappointment for David Wright, posting his lowest career numbers in almost every offensive category: OBP, SLG, OPS, ISO, wRC+, wOBA, and WAR. Cries of Wright being washed up began springing up immediately – he’s a 31-year-old who saw significant drops in almost every offensive category possible. However, everything might not be as it seems.

Wright injured his left shoulder early in the season and tried to play through it before finally getting shut down in September. Here’s Wright’s home run chart for 2014.

Now here’s his home run chart for 2012-13.

Do you notice a difference? Wright did not hit a single home run to right or center field the entire season last year, and that’s always been something of a trademark for him. The injury to his front shoulder had a clear effect on his opposite field power, and that effect (or lack thereof) was apparent in yesterday’s Mets-Nats spring training game, where Wright did this.

Now that right there is something that Mets fans haven’t seen since Wright’s 2013 season, where he did it rather regularly, such as this home run against Craig Kimbrel.

Look at those two swings: the exact same swing, both demolishing the ball to the same spot of the field. By all accounts, David Wright is healthy. His shoulder is 100% and he’s in The Best Shape of His Life. In baseball, you never want to use a sample size of one to draw a conclusion, but when Captain America comes into the season showing off the trademark power he didn’t show in the Mets’ previous 162 games, there’s plenty of reason to get excited.

Just look at this swing. That’s the swing of a man ready to put America (and the Mets) on his back.