Archive for Player Analysis

Is Cameron Maybin Here to Stay?


The scouting report on Cameron Maybin hasn’t changed much since the Detroit Tigers selected him 10th overall in the 2005 amateur draft. “A prototypical five-tool player trying to learn how to turn his potential into performance.” Well here we are ten years later, and the once glorified minor-league prospect appears to finally be tapping into the potential that scouts used to rave about. At age 28, Maybin is blossoming into one of the biggest surprises of the 2015 season and is showing no indications of slowing down. Do we have another Jose Bautista case on our hands? Perhaps to a much lesser extent, but let’s not get carried away just yet.

Will there ever be a way to validate the Tiger’s decision to take him over Andrew McCutchen back in 2005? Of course not, but nine other teams passed on McCutchen as well so that’s not the point. The point is that in 2015, Maybin is proving that he can be a useful, everyday player in the big leagues with the ability to perform slightly better than your league-average center fielder. Through 81 games, Maybin ranks 7th in OBP and 10th in wRC+ among center fielders with at least 200 plate appearances. He is sporting career highs across the board and has given the Braves an unexpected and extremely valuable bargaining chip as the trade deadline approaches.

So what exactly has changed? Maybin has been asked this same question on multiple occasions throughout the season and each time he responds, praise is thrown in the direction of new Braves hitting coach, Kevin Seitzer, who’s hitting philosophy revolves around driving the ball up the middle. Now, I am sure that many other hitting coaches have this same philosophy, but for whatever reason, Seitzer has been able to get through to Maybin and successfully revamp his entire thought process when it comes to hitting. Let’s take a closer look at how.

Seitzer immediately recognized that at 6-foot-3, Maybin had a naturally long swing that was slow through the strike zone. To correct this, he recommended that Maybin start with his hands closer to his body, which would provide a shorter and more compact swing.  This slight mechanical adjustment is allowing him to hit the ball with more authority than ever before. Check out Maybin’s line-drive percentage on a yearly basis since 2010 in the table below.

Year LD%
2010 14.2
2011 15.9
2012 16.1
2013 19.0
2014 17.0
2015 23.6

Maybin’s whole approach to hitting has changed under Seitzer as well. He has never owned a strikeout percentage to write home about and his 2015 mark of 17.4% is no different. However, it’s worth noting that this is down 3.2% from last year, so signs of improvement are not exactly absent in that regard. What’s even more worth noting is that Maybin is walking more than he ever has which is a direct product of his astronomical improvement in situational hitting. Check out Maybin’s walk to strikeout ratio on a yearly basis since 2010 in the table below.

Year BB/K
2010 0.26
2011 0.35
2012 0.40
2013 0.44
2014 0.34
2015 0.55

Maybin is thriving with a .400/.452/.898 slash line with runners in scoring position this year (all career highs), showing that he really is taking Seitzer’s philosophy to heart. For the first time in his career, he seems to have a plan every time he steps into the batters box. He is putting the ball in play to the right side 30.9% of the time in 2015 which is 7.1% better than his previous career high in 2012. Nothing illustrates the change in Maybin’s approach better than the spray charts below. In 2011 with San Diego, which is his best completed statistical season to date, you can see that he was almost exclusively pull happy. The shift in the distribution of hits in 2015 shows that Maybin is succeeding in his effort to shorten his swing and drive the ball the other way.


Can he keep this up? That remains to be seen, however, this does not have the makings of a complete fluke. Surely his BABIP is due to come down eventually, but it’s hard to think that he will revert completely back to his old habits. Maybin said earlier this season that he had always felt like he was missing something when it came to hitting. With the help of Kevin Seitzer, the former North Carolina high school standout has finally found it, and it’s a joy to watch.


Victimized by Infield Hits

We see it every night. A weak groundball to a defensively incapable player, a broken-bat roller behind the mound into no-man’s-land, a slap hit into the vacated area caused by the shift, a tomahawk chop resulting in a dirt-bounce that goes 20 feet upward. Not good enough to be a true hit, not bad enough to be an error. Infield hits are awkward.

“It’ll look like a line drive in the box score,” the broadcasters chirp happily. And while that’s very true, I would argue that infield hits are ESPECIALLY demoralizing for pitchers. Usually, the pitcher made a quality pitch, got the groundball he was looking for, and had little control over the infield defensive positioning or assignments. But because the official scorer ruled the play too difficult for a fielder to make, any runs driven in by the infield hit or resulting later in the inning will be earned.

Infield hits are the result of bad defensive skill, poor defensive positioning, poor use of the shift, sloppy weather conditions, speedy runners, jittery infielders, and/or good old fashioned bad luck. So which pitchers have been victimized the most by infield hits? Let’s look at the numbers for each league.

American League pitchers have allowed 9,650 hits, including 1,166 infield hits (as of June 29). The infield hits/hits rate in the American League, therefore, is 12.1%.

The Athletics’ defense ranks worst in the American League with a -23.9 UZR, and the team’s two best starters suffer a plethora of infield hits allowed. Take out Gray’s 17 infield hits allowed, and his already pristine 0.99 WHIP falls to 0.84 WHIP. Without the infield hits, Chris Sale of Chicago would also see his WHIP drop to a crazy 0.82 WHIP. (The ChiSox need to figure out how to shift.) Keuchel is the king of groundballs (64.5% GB), so infield hits are only natural to him. Same goes for Madson and his 56.4% GB rate. The Yankees’ middle infield has been miserable this year, and the team doesn’t know how to shift properly. Warren, Rogers, and Betances have been the poor-luck “beneficiaries.”

Nate Karns (45.4% GB) and Brad Boxberger (36.6% GB) are the real enigmas here, as the Rays have the second-best defense in the AL. Bad luck? Infielders hate them? Poor use of the shift by Tampa Bay coaches? According to Inside Edge, Rays defenders make only 4% of very difficult plays, labelled “remote.” Since these plays are too difficult to be ruled an error if the defender miffs, these balls in-play are often ruled infield hits (if, of course, they occur on the infield). For the curious, the Yankees are dead last (1.2%), and the Blue Jays are first (19%).

Zach Britton’s rate really jumps out, but it is most likely a result of very few hits allowed overall and, as with all the relievers, a small sample size. Britton has only allowed 28 hits on the season, and only 17 have left the infield. Dominant.

National League pitchers have allowed 9,892 hits, including 1,174 infield hits (as of June 29). The infield hits/hits rate in the National League, therefore, is 11.8%.

Noah Syndergaard (16.6% infield hits/hits) just missed this list, so that’s three Mets starters who have allowed way more infield hits than the average NL starter. The Mets have already taken Wilmer Flores off shortstop, but Eric Campbell (-1.1 UZR) and Daniel Murphy (-2 UZR) aren’t helping either. Brett Anderson (68.7% GB rate) is the most predictable pitcher on this chart, but Alex Wood and Shelby Miller are not, especially since 2B Jace Peterson and SS Andrelton Simmons flash the leather on a nightly basis. (Do the Braves  suffer from the Dee Gordon effect or just from poor use of the shift?)

The Cardinals infield has been below average defensively (Matt Carpenter -1.6 UZR; Mark Reynolds -1.6 UZR; Jhonny Peralta -1.1 UZR), which partially explains Lynn and Rosenthal. Starlin Castro (-3.4 UZR) and Arismendy Alcantara (-2.0 UZR) have not helped out Hendricks or Strop defensively either. Benoit is on the wrong team defensively to have a career-high ground ball rate (43.6%).

Finally, who has been stingy with infield hits? For the American League:

And for the National League:

Just something else Max Scherzer has been amazing at in 2015.


Mike Moustakas Is Reverting Back to Mike Moustakasness

Coming into this season, the major league career of Mike Moustakas had been underwhelming. Underwhelming is probably kind, really. After being the second overall pick in the 2007 draft (behind David Price), Moustakas progressed through the minor leagues with consistently above average seasons. Before reaching the major leagues in the middle of the 2011 season, Moustakas had a minor league batting line of .282/.327/.503. From 2008 to 2011, Moustakas was ranked 18th, 13th, 80th, and 9th on the Baseball America Top 100 Prospects list.

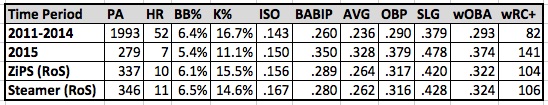
Then he reached the Major Leagues. In his first three-and-a-half seasons with the Royals, Moustakas proved to be a below-average major league hitter, starting with an 84 wRC+ in 89 games during his rookie year, followed by 90, 77, and 76 wRC+ seasons from 2012 to 2014. Over this stretch, Moustakas hit .236/.290/.379, good for a .293 wOBA and 82 wRC+. His wRC+ placed him 177th out of 186 hitters with 1500 or more plate appearances. From 2011 to 2014, Moustakas had been a worse hitter than Ruben Tejada, Jeff Francouer, and Kurt Suzuki, among others.

This season has been a whole new world for Moustakas. He is currently hitting .328/.379/.478 and has a 141 wRC+. After being below average for the first four years of his career, he is now hitting at a well above average rate.

So what has changed?

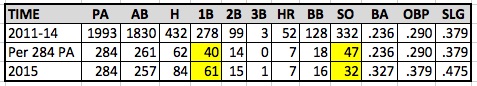
The first glaring thing to notice is Moustakas’ .350 BABIP. In his first four seasons, Moustakas had a BABIP of .260. This sky-high BABIP for Moustakas explains much of his success this season. He isn’t hitting for any more power than he did before. His rate of doubles, triples, and home runs in 2015 are right in line with his rate of extra base hits previously. He’s also walking less often than he had in the past (and striking out less often). The difference in Mike Moustakas from 2011-2014 and Mike Moustakas in 2015 is a big increase in the number of singles and a decrease in strikeouts. The chart below shows Moustakas’ 2011-2014 numbers pro-rated to his current 284 plate appearances (as of June 25). As you can see by the columns highlighted in yellow, the “new” Mike Moustakas has 21 more singles and 15 fewer strikeouts than the “old” Mike Moustakas would have.

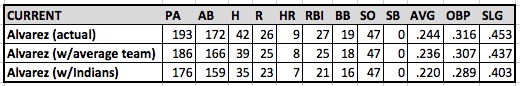
I took his current stats and adjusted his .350 BABIP down to his pre-2015 career mark of .260, with all of his “eliminated” hits being singles, and his batting line drops to .251/.306/.401. This shows just how much BABIP is influencing Mike Moustakas’ breakout season. That .251/.306/.401 line is better than his pre-2015 career mark of .236/.290/.379, but it’s not that much better. It would only be a slight improvement and nothing like what he is actually doing this year.

So, Moustakas’ BABIP is the main reason for his success this season. Looking at his walk and strikeout rates, we find that he’s walking slightly less often than he had previously (5.4% this year compared to 6.4% from 2011-14). His strikeout rate is also down, from 16.7% coming into this season to 11.1% so far this year. Perhaps he is focusing more on making contact than he had in the past. This would fit in with what looks to be a philosophy of the franchise. The Royals have struck out less often this year than any team in baseball. Since 2010, the Royals have been the hardest team to strike out in four seasons (including 2015) and near the top of the list in strikeout avoidance in the other two seasons. For his part, Moustakas has steadily dropped his strikeout rate from 20.2% in 2012 down to this year’s 11.1%.

Early in the year, Jeff Sullivan wrote about Moustakas’ first opposite field home run . . . ever. He pointed out that Moustakas was hitting the ball to the opposite field during spring training much more often than he ever had. The Kansas City Star had an article in February about Moustakas working on hitting to the opposite field to combat the infield shift, which he had seen more of in 2014 than in previous seasons. In May, an article at Grantland continued with this theme, pointing out that Moustakas was leading the league in opposite field hits at the time and had dropped down a couple bunts against the shift in April. With this in mind, perhaps Moustakas’ .350 BABIP in 2015 is due to his newfound ability to hit to the opposite field?

With almost three months of the season in the books, we can look at some batted ball data. When it comes to hitting the ball to the opposite field, Moustakas is going the other way much more often than he had in the past.

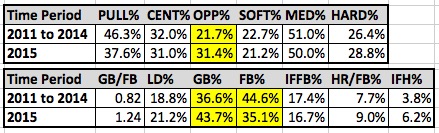
Moustakas has hit the ball the other way 31.4% of the time in 2015, compared to 21.7% of the time in the four previous seasons. He’s hit the ball to center just about as often as ever, so all of that opposite field contact has meant fewer balls hit to his pull field. As for soft, medium, and hard hit percentage, his profile hasn’t changed much; just a slight increase in hard hit percentage.

Along with more balls being hit the other way, Moustakas has hit more balls on the ground. You’d expect a big guy like Moustakas to hit the ball in the air with power, which he did better than he ever had during the post-season last year when he hit five home runs in 55 plate appearances. Instead, this season Moustakas is hitting the ball on the ground more often. So far, it’s working.

Considering that Moustakas is hitting better than he ever has, perhaps he’s figured something out and this is the new Mike Moustakas, a guy who hits the ball on the ground and to the opposite field more often than he ever did and the result is a shiny .350 BABIP.

Except it doesn’t look like this is the case when you take a closer look. Moustakas may have been a new man during spring training and in the first part of the year but he’s looking more like his old self recently.

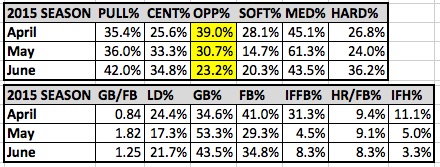
Using monthly splits means slicing up data into arbitrary points, I know, but it’s not hard to see a reverting to old form when looking at Moustakas’ monthly opposite field percentage numbers. He hit the ball the other way 39% of the time in April, around 31% of the time in May and 23% of the time in June so far. His directional hitting numbers in June are all fairly close to his pre-2015 numbers. It looks like Moustakas was doing something different early in the year but that is no longer the case.

The interesting thing is that he’s continued to be productive and continued to post a high BABIP (.377 in April, .301 in May, .373 in June). He’s also hit the ball hard more frequently in June (36.2%) than he had in April (26.8%) and May (24.0%) and he’s continued to hit more ground balls than he had in previous seasons.

I don’t know how to find data on how often teams are shifting against Moustakas and if that information is broken down by month. The Grantland article referenced above pointed out that he had been shifted against 70.7% of the time in 2014 and just under 60% of the time in 2015 (the article was posted on May 5) and suggested that his ability to hit to the opposite field in April may have resulted in teams shifting less often. If this is true, then his reversion back to pulling the ball in June could be Moustakas adjusting to the adjustments of the opposing defense. It could be that Moustakas began the year facing a shifted defense a high percentage of the time and responded by hitting to the opposite field (39% of the time in April). Then teams may have gone away from the shift against Moustakas sometime in May and Moustakas has responded by pulling the ball more often (going opposite field just 23% of the time in June). This is speculation, of course, since I don’t know the shifting patterns of defenses facing Moustakas.

On the other hand, it could be that the BABIP-Gods are smiling down upon him so far this year and all of this batted ball talk is meaningless. Personally, I’m tempted to lean this direction. Moustakas is currently 18th out of 161 qualified hitters in BABIP. Of this group of hitters, Moustakas is 81st in line drive percentage, 88th in infield hit percentage, and 100th in hard-hit percentage. He’s also hit infield flies at a very high rate (16.5% IFFB%), with just 10 hitters popping out more often than Moustakas. There are just too many indicators suggesting he won’t continue to have a .350 BABIP, especially if he’s no longer taking advantage of shifted defenses by hitting the ball to the opposite field like he did early in the season.

For their part, ZiPS and Steamer see improvement but not earth-shattering improvement. For the rest of the season, they project a .289 and .280 BABIP, respectively, with wOBAs of .322 and .324, making him a slightly above-average hitter going forward (104 wRC+ and 106 wRC+). That’s not as bad as the old Mike Moustakas but it’s not all that new-and-improved either.


Hit More Fly Balls, Wilson Ramos!

Wilson Ramos is currently third on the Nationals with 7 home runs. He has done that on 41 fly balls, for a HR/FB rate of 17.1%. But Ramos has also hit the ball on the ground in play 103 times. Throw in his 37 line drives and that’s a ground ball rate of 56.9%. For a guy as slow as Ramos, how can that be good?

Ramos has always hit the ball on the ground, however. His career ground ball rate is 54.3%. He has a career average of .206 on those grounders. That is below average, as you’d expect.

Meanwhile, he hits fly balls 27.5% of the time for his career, and homers on 16.6% of his flies. That’s better than the career rates of Jose Bautista (16.5%), Todd Frazier (15.8%), Adam Jones (15.2%), Adam LaRoche (15.0%). It’s better than a lot of players who are known for their power.

The difference, of course, is the in the fly-ball rates. Bautista has a career 45.5% FB% mark. Frazier’s is 40.8% for his career. Jones, 33.4%. LaRoche, 41.2%. And there’s Ramos with a paltry 27.5%.

But here’s possibly the most startling statistic: of 703 qualifiers since 2002, Wilson Ramos ranks 57th in HR/FB and 648th in FB%.

Ramos clearly has power just from watching him, and when he gets the ball in the air, he can hit it out. When he hits it on the ground, his speed makes him less likely than most to reach base.

So why is he hitting the ball on the ground more than half the time?

There might be a good answer to that question, but if he starts to hit more fly balls, there might be a rather less good answer to this question:

Why didn’t he start doing this sooner?

(Cross-posted at federalbaseball.com)


What Has Happened to the Second Basemen?

 2nd Base hasn’t been a particularly stacked position in the major leagues in the past five years. Entering the 2015 season, the 2nd base position was headlined by Jose Altuve and Robinson Cano. The second tier arguably consisted of Ben Zobrist, Neil Walker, Dustin Pedroia, and Ian Kinsler, and maybe Brian Dozier. Then the next level housed names like Jason Kipnis, Daniel Murphy, and maybe DJ LeMahieu. I’m here to analyze what has possibly happened to this group of baseball players in the past few months.

According to the Depth Charts pre-season projections, the top eight second basemen ranked by wOBA were Robinson Cano, Neil Walker, Ben Zobrist, Jose Altuve, Dustin Pedroia, Ian Kinsler, Howie Kendrick, and Chase Utley. The projections are usually somewhat accurate, but if you’ve been following baseball at all this season, just by looking at those names, you know that we’ve found an exception to that.

These are the top 10 second baseman thus far in the 2015 season ranked by wOBA:

Name Team G PA HR BB% K% ISO BABIP wOBA wRC+
Jason Kipnis Indians 69 322 5 10% 13% 0.17 0.396 0.409 169
Brian Dozier Twins 70 310 14 9% 19% 0.257 0.276 0.363 133
Logan Forsythe Rays 72 284 8 9% 15% 0.161 0.325 0.363 139
Joe Panik Giants 69 296 6 9% 12% 0.156 0.326 0.362 137
Dustin Pedroia Red Sox 68 311 9 9% 12% 0.147 0.325 0.358 127
Dee Gordon Marlins 68 311 0 3% 15% 0.071 0.418 0.347 120
Danny Espinosa Nationals 62 229 8 9% 22% 0.187 0.317 0.345 118
DJ LeMahieu Rockies 68 274 4 7% 16% 0.103 0.373 0.344 102
Kolten Wong Cardinals 69 284 8 7% 14% 0.163 0.3 0.336 114
Jace Peterson Braves 66 270 2 11% 17% 0.103 0.337 0.327 107


If I told you in April that Logan Forsythe would be the 3rd best second baseman in the league, you would think I’m ridiculous. He came absolutely out of nowhere to raise his BABIP nearly 60 points and raise his ISO 55 points! Joe Panik’s beautiful swing has moved him up to be the 4th best-hitting 2nd baseman. Jason Kipnis has shut up all the critics. He took his .310 2014 OBP as confidence going into this year, and now has a wOBA over .400. Danny Espinosa, who has been previously known as a ‘defensive’ second baseman, has skyrocketed his offensive production into a player who Matt Williams is comfortable having run onto the field every day. Cardinals 2B Kolten Wong is pulling the ball more and more every season. He’s also upped his LD% from 19% to 25%. Braves utility-infielder Jace Peterson is doing a bit of hitting in his rookie year, after being traded from San Diego (who, it turns out, could really use him) to the Braves in December. Think back to when I mentioned the tiers up top. Where is Robby Cano on the list above? Where’s Altuve? I don’t see Zobrist, Walker, or Kinsler on this list either. It is not an error.

So we talked about the breakouts at 2nd; now lets talk about the guys who haven’t or haven’t yet lived up to expectations.

Lets start with the guy who all of his fantasy owners hate this year. Robinson Cano. Yeah, the six-time All-Star Robinson Cano. The 32-year-old — the guy who has a wRC+ of 76. This is easily, by far, his worst season of his 11-year career. Why? Lets talk about it.

Cano has raised his Hard% and his Pull% over 4% each! What does jump out at you is that he’s making a ton less contact than he did last year. Actually, the least of his whole career. His Contact% has plummeted down almost 5%. Along with a raised K%, his BABIP has jumped down nearly 50 points.

The next guy is Altuve. Altuve hasn’t been that bad this year, but compared to his 2014 campaign, he’s not playing like Jose Altuve. He’s even fighting with a mild hamstring injury, but in his 287 PA’s, every single one of his numbers are down. His wOBA has decreased .363 to .304. BB% is down, strikeouts are up, OBP and SLG are both way down. He’s swinging more, and making less contact which isn’t a combination that pulls you in a positive direction.

Same can be said for Neil Walker. Almost all his numbers are down. One of the positives that I found, though, is that he’s hitting the ball harder. My prediction is that the .303 wOBA will start to show positive regression. Ian Kinsler isn’t having a horrible season. He’s raised his OBP a bit, but he’s becoming more of a singles hitter, dropping his SLG from .420 to .338.

Almost every starting second baseman in the big leagues has totally changed their style of hitting this year. Guys like Forsythe and Panik, who were projected to be replacement level or below, have made their names rise to the top of many leaderboards. Cano and Altuve’s value have fallen. Here’s your homework: Think of all the 2nd baseman in the major leagues. How many of them have close to similar stats from their projections? Comment down below.


The Allure of Potential and the Black Hole In the Indians Rotation

The Cleveland Indians can be a frustrating team to follow.  As a small to mid-market ball club, the Indians do not have the luxury to spend big in free agency, and when they do, they usually have to spend extra to bring in overrated players (see Kerry Wood, Nick Swisher, and Michael Bourn).  As a result, the Indians hedge their success on taking risks.  This process started in the early ’90s when they signed their young players with big potential to long-term contracts.  As a result, the Indians turned into an offensive juggernaut with stars such as Jim Thome, Sandy Alomar Jr., Kenny Lofton, Omar Vizquel, Carlos Baerga, and many others.  However, many people do not realize that the Indians also lost on some of the risks that they took in that era with cases such as Eric Plunk, Herb Perry, and so on.

This strategy has continued to this day, and has resulted in a very promising, yet frustrating team.  Carlos Santana has been productive with his high OBP, but never the player the team envisioned.  Jason Kipnis has had up and down years.  Lonnie Chisenhall has shown moments of brilliance, but has been unable to sustain those moments, resulting in his demotion to Triple-A Columbus last week.

While the offense has been widely inconsistent, the rotation has, for the most part, been brilliant.  Corey Kluber is second in the league in strikeouts with 111.  Danny Salazar, Carlos Carrasco, and Trevor Bauer have been inducing a lot of long walks back to the dugout as well, ranking tied for sixth, seventh, and ninth, respectively.  These four have a combined 3.65 ERA, which is quite remarkable considering that the most respected starting rotation in the Majors (the Nationals) has logged a 3.60 ERA.

However, this is not where the story ends.  As everyone (hopefully) knows, major-league rotations consist of five starting pitchers (unless you’re the Mets for a few weeks).  With the fifth starter added in, the Cleveland Indians rotation has an ERA of 4.37, almost three-quarters of a run higher.  This is absolutely startling.  By themselves, the fifth starters in the rotation have gone 3-8 with an 8.33 ERA.  I’ll repeat that, an 8.33 ERA.  The only fifth starter to win at all has been Shaun Marcum, the man who had not pitched in the major leagues since halfway through 2013.  In the games that a fifth starter has pitched in, the Indians have been outscored 88-48.  Opponents have nearly doubled the Indians run output when a fifth starter has taken the hill.

Are there games that the Indians should have won when a fifth starter has pitched? Absolutely.  But in order to have any shot of making the playoffs, someone has to step up in the back of the rotation and close up the black hole.  A .375 winning percentage does not a contender make.


SOSA Projections: Byron Buxton and Francisco Lindor

Byron Buxton and Francisco Lindor were called up for the Minnesota Twins and Cleveland Indians respectively. Both players are 21 years old, Buxton in the outfield and Lindor at shortstop. SOSA doesn’t officially project players that didn’t play last season in the MLB — I have to manually input data for projections.

One major difference between Buxton and Lindor is that Buxton was called up straight from AA. SOSA calculates its MLE’s (Minor League Equivalencies) by comparing the minor-league level the player is coming from to the MLB. Systems like Oliver directly link them, other systems chain their projections.

Despite both hitting around .280 in the minors, Buxton takes the bigger hit. Because he’s coming from AA his numbers are brought down further. SOSA has Buxton slashing .204/.283/.372 at the Majors, with Lindor slashing .217/.295/.306 with Cleveland. The discrepancy? While Buxton has a worse batting average and on-base percentage, he’s projected for a better slugging percentage than Lindor.

While Lindor is projected for eight more doubles and four more home runs than Buxton, Lindor is projected for 280 more at-bats. With the young outfielder coming up earlier than expected, he can likely outperform his projected four doubles, seven triples, and four home runs. Buxton already had twelve triples and twenty stolen bases; with speed transferring well to the majors, Buxton could find a solid role with the team that his batting average doesn’t accurately represent.

The talented Cleveland shortstop’s projection is considered more accurate. He’s projected for a solid 469 at bats, producing a wOBA (Weighted On-Base Average) of .266, near the bottom of the pack in what I called top-tier prospects this off-season. With projections for twelve doubles, three triples, and eight home runs, Lindor’s offensive value does exist, but he has much to prove at the big-league level

So while Buxton and Lindor’s offensive value doesn’t match that of some prospects called up earlier, they’re both above-average defenders, and they will find ways to contribute to their teams. If you have questions about Minor League Equivalencies, SOSA, or stats feel free to hit me up on twitter @AthleteInvictus.


Bogaerts Shoo-in for All-Star Snub

When Xander Bogaerts was a 16-year-old kid playing baseball down in Aruba, looking up to his idol Derek Jeter, I’m sure he too had dreamed of one day playing in an All-Star game. Well, that dream may soon become real for the 22-year-old shortstop.

In 2009, when Bogaerts was just 16-years-old he was offered a professional contract by the Boston Red Sox, a contract that featured a $410,000 signing bonus.

Cruising through the minor leagues, Bogaerts soon became the talk of the town in Boston when he was ranked the 6th overall prospect in baseball by MLB.com. Entering the 2013 season, it wasn’t expected that Bogaerts would see any time at shortstop that season due to the acquisition of Stephen Drew.

He was brought up though, and good thing he was. Bogaerts exceeded most expectations in the 2013 postseason batting .296 in 12 games eventually helping the Red Sox to their third World Series title in 10 years. He returned to his homeland of Aruba and was treated to a red carpet as well as a parade with the natives lining the streets.

In 2014, he was shuffled back and forth from shortstop to third base, messing up his development and also taking a toll on him offensively. He did, however, manage to hit 12 home runs in 144 games. His average though dropped considerably from what many thought it would be. Bogaerts also showed how you can have awesome plate discipline in Triple-A, but it doesn’t always translate right away into your big-league career.


This year, Bogaerts is excelling in all aspects of his position. On offense and defense, the youngster has the temperament like that of a seasoned veteran. And it’s great. He doesn’t take his at-bats into the field and he certainly doesn’t take his fielding miscues (or lack thereof) into the batters box.

In 56 games this season, Xander is batting .297/.343/.401. Not to mention he has been one of the hottest hitters in the game in the last 30 days batting .352/.383/.466 while posting a 137 wRC+ in that span as well. And, Bogaerts also is getting base hits on pitches all over the strike zone. That shows a huge improvement in his plate discipline and pitch-selection skills over the past season.


On the defensive side, Bogaerts has shown a strong improvement from last year when he posted a Defensive Runs Saved of -9. This year, thanks to his offseason work in Arizona with Dustin Pedroia, and also adjusting his footwork with infield coach Brian Butterfield, Bogaerts has a Defensive Runs Saved of -1.

So why isn’t Bogaerts being talked about as if he’s an All-Star? His numbers show that he is certainly All-Star-Game worthy. The top five vote collectors for the All-Star Game at shortstop are Alcides Escobar, Jose Iglesias, Marcus Semien, Jed Lowrie and Jose Reyes. How does this make sense? I’ll tell you — because for some reason, this year in particular, the All-Star Game is a popularity contest, and it’s not based on skill. What do the numbers say to you? They don’t lie.

If it was based on skill, there wouldn’t be seven Kansas City Royals in the lead to start the All-Star Game this year. Pablo Sandoval wouldn’t be third in the AL third baseman voting. David Ortiz wouldn’t be fourth in the DH voting. And Dustin Pedroia most definitely would not be trailing Omar Infante in the second baseman voting. We will wait and see if Bogaerts has a shot at the All-Star Game this year, but if not, we can then tell that this system is flawed and is not based on skill and skill alone.


A Nightmare Scenario for Pedro Alvarez: Playing for Cleveland

With apologies to Clevelanders everywhere, I can think of a number of reasons why Pedro Alvarez would rather be in Pittsburgh than in Cleveland, or C-Town, or The Mistake on the Lake, whichever you prefer. Pittsburgh is located where the first Europeans reached the “Golden Triangle” at the confluence of the Ohio, the Monongahela, and Allegheny rivers. “Golden Triangle” not only sounds very appealing, in a slightly sexual way, but to my knowledge none of the three rivers confluence-ing in Pittsburgh have been on fire like the Cuyahoga River that runs through Cleveland.

Pittsburgh has regularly finished near the top of lists of “Most Livable City in the U.S.”, including last year when the ‘Burgh narrowly beat out Honolulu for the top spot. It was the third time in seven years that The Economist had Pittsburgh at or near the top of the list of the most livable cities in the continental United States. Cleveland, on the other hand, was named the most miserable city in the United States, according to a 2010 poll by Forbes.com.

So it’s clear the Pedro Alvarez is quite fortunate to be with the Pittsburgh Pirates as opposed to the Cleveland Native Americans, just for the pure livability factor of the city.

When it comes to baseball, this pattern continues. The Pirates are 31-25 (.554) and in second place in the NL Central. Cleveland is 27-29 and in fourth place in the AL Central (all data is through June 7th). According to the playoff odds at FanGraphs, the Pirates currently have a 67.6% chance of winning their division or being a wild card team. The Indians are at 51.5%. If not for the parity of the American League, this gap would be even greater.

More importantly, and the point of this article, there’s something very specific to Pedro Alvarez that makes it fortunate that he’s with Pittsburgh this year and not Cleveland. Pedro Alvarez does not hit well against left-handed pitching. This is not a major revelation. I think most people reading FanGraphs know that Pedro struggles against lefties. In his career, Pedro has hit .193/.263/.315 against lefties, with a walk rate of 8.3% and strikeout rate of 36.7%. Yikes! His wRC+ against lefties in his career is 61. Against right-handed pitchers, Alvarez has hit .248/.321/.474, with an improved walk rate of 9.5%, a much improved strikeout rate of 26.9%, and a 118 wRC+. For reference, based on his career wRC+, Alvarez hits like the 2015 version of Starling Marte (.256/.317/.473 this year) against right-handed pitchers and like the 2015 version of Lonnie Chisenhall (.209/.241/.345 this year) against lefties. Chisenhall was just sent to the minor leagues. Pedro Alvarez, like former Pirate Andy Van Slyke before him, is fortunate that he lives in a predominantly right-handed world.

Adding to the good fortune for Alvarez this season is the limited number of left-handed pitchers the Pirates have faced. The average team in the Major Leagues has had 24.8% of their plate appearances against southpaws. The Pirates have had the lowest percentage of plate appearances against lefties, just 17.5%. That’s more than one standard deviation below the average. The Cleveland Indians are on the opposite side of the coin, having had 38.0% of their plate appearances against lefties, which is more than two standard deviations above the average. Consider the handedness of the starting rotations of the non-Pittsburgh and non-Cleveland teams in the AL Central and NL Central:

The non-Cleveland teams in the AL Central have 12 right-handed starters and eight left-handers (40% lefties) currently in their starting rotations. The non-Pittsburgh teams in the NL Central have 17 righties and just three lefties currently in their starting rotations (15% lefties).

I was curious how big a difference this would make for Pedro Alvarez, so I decided to look at it in two different ways.

For the first scenario, I took Pedro’s batting line against lefties (20 PA) and righties (173 PA) this year. I figured out what percentage of the team’s plate appearances against each type of pitcher Alvarez has had. I then applied those percentages to Alvarez if he were to play on a team that has seen the league average number of lefties and on the Indians, who have seen the most lefties this year. Here are the results:

Alvarez goes from a .244/.316/.453 hitter with the Pirates to a .220/.289/.403 hitter with the Indians. Not only would he be moving from one of the most livable cities in the U.S. to one of the most miserable, his production would take a big hit. He also loses some playing time because the Pirates have limited him against lefties and the Indians and the league-average team have faced fewer righties.

This leads me to the second scenario. The Pirates have rightly limited the number of plate appearances against lefties for Alvarez this year. Just 20 of his 193 plate appearances have been against southpaws. If Alvarez was transplanted to Cleveland, or to a league-average team, perhaps they would also keep Alvarez riding the pine when a lefty is on the mound. In this second scenario, I moved Alvarez to the Indians and to a league-average team and limited his plate appearances against left-handers to his actual number of 20.

If he were limited to 20 plate appearances against lefties, Alvarez would hit similarly well but would lose playing time. In the case of a hypothetical move to Cleveland, Alvarez would have 41 fewer plate appearances, the equivalent of around 11 games based on his current 3.6 plate appearances per game played.

Pedro Alvarez, you are a fortunate man. Not only do you live in a world with many more right-handed pitchers than lefties, but you also play for a team that has seen more right-handers than any other team in baseball. Now go enjoy the spectacular view of Pittsburgh while riding on the Duquesne Incline, then get a Primanti Brothers sandwich and head over to Point State Park near the “Golden Triangle” and enjoy one of the country’s largest fountains on a beautiful Pittsburgh day.

(I feel like I should maybe apologize to any Clevelanders who might be reading this, but I don’t know if they have Internet in Cleveland yet, so it’s probably not necessary.)


Delino DeShields and the Baseline BABIP for Speedy Players

Delino DeShields currently has a .395 BABIP en route to a .291 average. A .395 BABIP is probably unsustainable, but I was shocked when I saw the Steamer projection of .287 BABIP for DeShields, going forward. A .287 BABIP for a guy like DeShields is just unreasonable. He’s one of the fastest guys in the league, and his baseline BABIP should be well above .300 as he can turn groundouts into infield singles.

So I decided to crunch some numbers, which ultimately confirmed my suspicions. A BABIP of .286 is too low.  Looking at batted ball data, .315 is what I calculated his expected BABIP to be going forward. I’ll explain below:

DeShields has 13.6% infield hit%.

League average is 6.7%.

DeShields is more than twice as likely to get an infield hit, which is 6.9% more likely than average to get a hit in general. As a side note, he’s also 50% on bunting for hits, which is astounding (also more than twice league average).

Baseline BABIP for groundballs is .232

Add a DeShields speed .069 infield groundball advantage, and therefore you’re looking at a DeShields baseline groundball BABIP of .301.

Line drives are the best — .690 baseline BABIP according the source above. Fly balls have .218 baseline BABIP. Speed shouldn’t have much of an effect on these so I’m not adjusting them, other than accounting for infield fly balls which are guaranteed outs.

I’m going to calculate the expected BABIP for DeShields based on the above data. The expected BABIP will equal the summation of the following:

Flyballs — .218 x .261 (26.1% FB, minus the difference between DeShields IFFB and league average, which is .111 minus .095 = .016; .261-.016=.245) = .05341

Groundballs — .301 x .638 (63.8% GB) = .192038

Line Drives — .690 x .101 (10.1% FB) = .06969

= .315 BASELINE BABIP

We can take that average and take away his strikeouts/walks to determine his expected batting average/OBP going forward.

22.1% Ks. So we’ll take the baseline BABIP multiplied by .779. = .245 expected batting average.

13.1% BBs. So we’ll take the baseline BABIP multiplied by .648 (Ks and BBs out) = .204. Add back the BBs. = .335 expected OBP.

I haven’t even gotten into directional placement of grounders, so it could be true that DeShields is even better than these projections I just calculated.

Regardless, league averages are .252 average and .314 OBP. DeShields is proving to be roughly a league-average hitter by expected batting average, and clearly above-average hitter if you’re looking at expected OBP.

In other words, DeShields is here to stay.