Archive for Player Analysis

Edwin’s New Home

Edwin Encarnacion’s eight-year stint with the Jays is over, as he has decided to move his talents to Cleveland. This leaves a gaping hole in the Jays lineup. During his six and a half seasons in Toronto, he accumulated 239 homers and 679 RBI while hitting for an average of .268. He reinvented his career when he made the switch to first base five seasons ago, as he began to play with more confidence. He has had a higher fielding average than the rest of the league at his position since he started playing 1B in 2011 — however, his defense is nothing to write home about.

Edwin will likely be replaced with Justin Smoak and Kendrys Morales. Smoak was able to swat 14 homers with 34 RBI in just 299 at-bats, and with more plate appearances, he will be capable of cutting into the missing 42 homers and 127 RBI Edwin produced last season. Furthermore, Morales hit 30 homers with 93 RBI, which are closer to Edwin’s numbers, and with the move to a more hitter-friendly field, Morales may actually be able to replicate similar numbers. It is also important to note that right-handed hitters fare better at Rogers Centre, and Morales seems to hit the ball better from the left side, as his wRC+ is 115 hitting from the left and 109 from the right. As far as WAR goes, however, Edwin’s total through 11 seasons is 27.6, while Kendrys only has 8.4 in 10 years, and Smoak has a WAR of  0.2 through six years. In this sense, Edwin has left his old home with a gaping hole.

The Tribe, however, will be happy landing this heavy-hitting righty. Mike Napoli is yet to sign this offseason, so at this point Edwin will likely share time between first base and DH with Carlos Santana. The Indians ranked 10th in the AL with 185 homers last season, thus, Edwin’s bat will help with the lack of power in their lineup. Moreover, Encarnacion’s 3.9 WAR will make him the third-most valuable hitter (tied with Jose Ramirez) in the lineup.

A three-year contract locks Edwin in Cleveland until age 36, but the 33-year-old has shown no signs of slowing down, as his WAR has hovered around 4 since turning 29. His cumulative WAR was only 7.4 in his first six seasons, compared to a WAR of 20.2 in his past five. The three-year contract still seems most favorable to Cleveland, as, if he sees a drop in numbers next season, he will have a year to recover, and if he is unable to they can drop him in 2020. For Edwin, if the Tribe is not able to replicate the success they had last season, he is stuck watching his prime go down the drain. However, with the addition of Andrew Miller, and the experience the pitching rotation gained from their run in the postseason this past October, there is no reason the Indians should not produce the same success.

So, Edwin’s new home may be a breath of fresh air for the slugger, as his power will not be outshone by a lineup of heavy hitters. And he is still with a team that gets on base a lot, and a pitching staff that has the capability of being one of the best in the majors. Additionally, playing half of his games at Progressive Field will not hurt, as he should be able to hit a few moonshots over the shallow eight-foot wall in right field.

At any rate, Edwin’s acquisition has pushed the Indians into being arguably the projected best team for the 2017 season, and it should be a cake walk to finish first in the AL Central, especially compared to the AL East Edwin is used to. He might have found a home more suitable than the one across the border.


Imagining Shohei Otani as a True Free Agent

We all know about Shohei Otani, but in case you are the one baseball fan who doesn’t, he is possibly the best baseball player in the world.  Otani turned 22 years old in 2016.  Although he did not have enough plate appearances to qualify, if he did, Otani’s 1.004 OPS would have led the country (of Japan).  In 382 plate appearances, he posted a slash line of .322/.416/.588, in addition to hitting 22 home runs.  That sounds like a very good player who would draw serious interest from MLB teams if posted.  However, that’s not all.  Otani also posted a 1.86 ERA in 140 IP with an 11.2 K/9.  He owns the NPB record for fastest pitch, at 165 km/h (102.53 mph).  The pitching stats alone would have every team in the MLB drooling.  Combine this with his hitting, and Otani might just be the best baseball player in the world.  And the best baseball player in the world is not going to paid like his title suggests.

The problem is that Otani will not yet be 25 after next season.  The new CBA keeps all international players under 25 from being exempt of the bonus pool system.  A tweet from Jim Allen reported that Otani still wishes to be posted after the 2017 season, when he will be 23 years old.  According to an excellent Dave Cameron article also on FanGraphs, the most money Otani could receive is $9.2 million.  This figure would be equivalent in 2016 to a player worth approximately 1.15 WAR.  Otani would surely be worth more wins than 1.15.

At first I wondered if this would make Otani the most underpaid player in the MLB.  Before that question could be answered, however, I had to answer a more important one: how much would Shohei Otani be worth in wins and, by extension, in dollars?  To make this more interesting, let’s make it a one-year deal, in which Otani would be paid the 2017 projected average price of $8.4 million per win above replacement.

The NPB has no available WAR figure, and no OPS+ or ERA+ was offered either.  Unfortunately, I could not find NPB league totals, so no calculating OPS+ or ERA+ on my own, at least not accurately.  I’ll use MLB league totals to find these numbers, but it is an obvious flaw in my research.  If anyone can find NPB totals for me, post the link in the comments, and I’ll gladly redo the study with those figures.

So, using the MLB totals, here are Otani’s numbers in 2016.  OPS+ 170.  ERA+ 225.

Those numbers look really good.  If these were for an MLB player, he would be by far the best player in the league.  How good were the numbers of other Japanese players before and after they were posted though? Let’s see, using three pitchers’ ERA+ and three hitters’ OPS+.  First the pitchers, including what Otani would hypothetically produce in 2017 by what the others produced.

Masahiro Tanaka:  2013 (NPB) 305; 2014 (MLB) 138

Yu Darvish:  2011 (NPB) 274; 2012 (MLB) 112

Hisashi Iwakuma:  2011 (NPB) 163; 2012 (MLB) 121

Shohei Otani:  2016 (NPB) 225; 2017 (MLB) 113

Now for innings pitched, another component required for the crude WAR I’ll project.

Tanaka:  212.0; 136.1

Darvish:  232.0; 191.1

Iwakuma:  119.0; 125.1

Otani:  140.0; 112.2

The raw numbers of IP and ERA+ can be converted into a metric (PV) that I can change into WAR.

Tanaka:  85.227 PV; 3.3 WAR

Darvish:  103.932; 3.9

Iwakuma:  73.552; 2.0

Otani:  63.911; 1.7

Pitching, Otani would be projected for a 1.7 WAR.  That is worth $14.28 million in real value.  Now for batting, which will be OPS+.

Ichiro Suzuki:  2000 (NPB) 157; 2001 (MLB) 126

Hideki Matsui:  2002 (NPB) 205; 2003 (MLB) 109

Kosuke Fukudome: 2007 (NPB) 155; 2008 (MLB) 89

Otani:  2016 (NPB) 170; 2017 (MLB) 107

That is the quality component of WAR.  Plate appearances now for quantity.  As a side note, because I’m not factoring in defense, oWAR is going to be used instead of WAR.

Ichiro:  459; 738

Matsui:  623; 695

Fukudome:  348; 590

Otani:  382; 540

Now for my metric to convert to oWAR.  I’ll call it OV.

Ichiro:  115.305 OV; 6.1 oWAR

Matsui:  93.179; 3.1

Fukudome:  63.012; 0.6

Otani:  68.180; 0.9

On offense Otani would have a 0.9 WAR.  This translates into $7.56 million.  For a one-year deal using real value, Otani should receive $21.84 million, while producing a 2.6 WAR.  But what about a long-term deal with market value instead of real value?  Using Bill James’ stat of projected years remaining to determine the length of the deal, it would be 10 years.  The first year would not have a salary of $21.84M, but $13.72M.  This year was easy.  Now for the next nine years.  First, we’ll examine his pitching value.  I won’t bore you with all the calculations.  This article is tedious enough without it.  Just the pitching WAR for each year.

2018 2.1; 2019 2.9; 2020 3.9; 2021 4.8; 2022 5.9; 2023 5.7; 2024 3.8; 2025 2.1; 2026 0.7

Now the oWAR for each of the seasons:

2018 1.6; 2019 2.3; 2020 3.0; 2021 3.8; 2022 4.5; 2023 5.3; 2024 4.7; 2025 3.1; 2026 1.7

The total WAR for the years are as follows:

2018 3.7; 2019 5.2; 2020 6.9; 2021 8.6; 2022 10.4; 2023 11.0; 2024 8.5; 2025 5.2; 2026 2.4

Over the course of the 10-year deal, Otani would have a total WAR of 64.5.  This is not what he would likely produce.  My projections are — ahem — optimistic.  These are the numbers he could produce if played as both a pitcher and a semi-regular hitter.  Using real value and these WAR figures, Otani would have a real value of $689.14M.  You can read that number again.  I had to do a double-take.  Go ahead and do one too; it’s still $689.14M.  That is real value — however, not market value.  The market value is the much more important, and interesting, number.  What the market value turns out to be, $249.01M, is still massive, but at least the $24.901M AAV is more reasonable in the market.  In fact, this is likely what he will receive when posted, if he is eligible for this kind of deal.  It will be a shorter deal than 10 years, but the AAV should be in line with what I projected.

However, Otani is a mind-boggling player, so no contract, no matter how mind-boggling it may seem, is out of the question for him.  Even $689.14M.


Exploring the Top 155 Pitchers

Happy Holidays. A new year is almost upon us. Just around the corner, pitchers and catchers will be gearing up to report. Spring-training facilities are prepping for an early start in anticipation of the World Baseball Classic, added excitement for any baseball fan ready to brush the cold off. Every new year brings change. Some more than others. This year, the new CBA was agreed upon. As the real game changes, so too does the fantasy world. Our league is entering its twelfth year, which is mind-blowing to me, considering we now represent six different states in four different time zones. Part of our longevity is attributed to adapting to the ever-changing landscape of baseball. Sabermetrics are slowing creeping into our stat categories — power is relied on less, and relievers more so. All that to say, we have changed again.

Our constant struggle has always been how to reflect the real game as best as possible without drastically changing the landscape of the league during one offseason. Recently there has been a trend toward an arms race. Pitchers were going ridiculously early in drafts and trades were featuring first- and second-round draft picks for non-keeper-eligible starting pitchers. Our solution to reduce the value of starting pitching in our league was to move from strikeouts to K/9 so as to reflect our six stat categories: Wins, K/9, ERA, WHIP, Net Saves, and Quality Starts.

Enough about our incredibly awesome keeper league. With all the talk of the winter meetings, the World Baseball Classic, and a new year, the jump on pitching is long overdue. So, the top 155 pitchers were ranked accordingly.

Method

Steamer has released their 2017 projections. These projections, of some 4000-plus pitchers, were exported to Microsoft Excel. Pitchers were then sorted by WAR: highest to lowest. The top 155 pitchers were then selected. In a 10-team standard league, no team should roster more than 15 pitchers, giving justification for cutting off the sample at 155. Five stat categories were then selected. Steamer does not project quality starts or blown saves. Therefore, to balance the importance of SP vs RP, innings pitched was selected in addition to Wins, K/9, ERA, and WHIP.

A table was then created with the stat categories on the x-axis and the pitching running down the y-axis (if you will). Each pitcher was given a positional value based on where that pitcher ranked within each stat category. For example, Max Scherzer is projected to have an outstanding 10.93 K/9 rate, which ranks sixth in the top 155. Scherzer was therefore given a value of 6 for the K/9 category. Scores were summed for each pitcher. Pitchers were than ranked by final score. Finally, a correlation using the summed scores and pitcher rank was executed to examine the relationship between stat categories and pitcher ranks.

Table 1: Example of Pitching Scores
    Wins K/9 ERA Whip IP Total
10 Rich Hill 6 10 8 12 98 134
11 Lance McCullers 3 11 18 67 31 130
12 Robbie Ray 5 12 19 39 61 136
13 Tyler Glasnow 7 13 52 130 91 293

Results

A complete list of the top 155 pitchers can be found at the end of this document. Below is a list of the top 20. Of note are Lance McCullers and Robbie Ray, who rank at 17 and 19, respectively. Not surprisingly, Clayton Kershaw is number one.

Table 2: Pitcher Rank
Rank Pitcher
1 Clayton Kershaw
2 Max Scherzer
3 Noah Syndergaard
4 Corey Kluber
5 Chris Sale
6 Madison Bumgarner
7 Jon Lester
8 Chris Archer
9 David Price
10 Stephen Strasburg
11 Carlos Carrasco
12 Yu Darvish
13 Justin Verlander
14 Jake Arrieta
15 Johnny Cueto
16 Jacob deGrom
17 Lance McCullers
18 Rich Hill
19 Robbie Ray
20 Michael Pineda


A correlation was then performed to explore the relationships of stat categories on pitcher total scores. Table 3 highlights K/9, ERA and WHIP as very strong correlations, with ERA being the strongest. Innings pitched had the weakest correlation.

Table 3: Correlation of Stat Categories and Total Scores
  Wins K/9 ERA WHIP IP Total
Wins 1
K/9 0.122264 1
ERA 0.333911 0.716097 1
WHIP 0.372086 0.589884 0.815055 1
IP 0.909963 -0.04049 0.138322 0.2326 1
Total 0.594921 0.752427 0.891181 0.881576 0.458243 1


Discussion

The goal of this exercise was to explore the impact on the changing landscape of pitching stat categories in fantasy baseball. The top 20 pitchers remain starters. However, within the top 20, one can see the impact of the change to K/9 from strikeouts. Both McCullers and Ray rank inside the top-15 projected K/9, according to Steamer. This led to the question, just how much of an impact will K/9 have on total scores?

The correlation revealed a strong relationship, but not the strongest. Therefore, the answer is, it has a strong impact, but in the end not as much as ERA and WHIP. What does strong mean? Statisticians usually agree that a correlation above .75 is considered a very strong relationship. To explore this meaning, let us take a look at an extremely early positional ranking done by ESPN.

Below, we’ll play the guessing game.

Table 4: Player Comparison
IP W K ERA WHIP
Player 1 174.1 8 218 4.90 1.47
Player 2 175.1 7 167 4.88 1.27


The above numbers appear somewhat similar. In a standard league, you may be inclined to lean toward Player 2. Indeed, according to ESPN, Player 2 is ranked 38th at his position and Player 1 is ranked 62nd. However, when scored using the methodology in this study, Player 2 ranks 49th while Player 1 ranks 19th. Two things when considering this. Table 4 are stats from 2016. The aforementioned rankings are based on 2017 projections. It could be that Player 1 has more room to grow. However, the change from strikeouts to K/9 is evident. Player 1 (10.11) has a much better K/9 than Player 2 (8.35). Therefore, the K/9 relationship to player ranking is correctly strong, and ranking Player 1 higher than Player 2 is logical. If you were wondering, Player 1 is Robbie Ray, and Player 2 is Drew Smyly.

Limitations

Steamer does not project quality starts or blown saves, therefore the correlation could be skewed toward starters or relievers. These results should only be taken into consideration when these five stat categories are in play. The sample size of starting pitchers is large enough, but not for relief pitchers. Only five relievers were projected in the top 155 pitchers ranked by WAR. Results of the correlation, then, could look different had more relievers been incorporated.

Future research

Future research should then include additional relievers. Expanding the pitcher rankings to the top 300 would include most relevant pitchers according to Steamer. Furthermore, additional stat categories should be explored. Would adding saves and quality starts affect the rankings? Certainly, the more variables added, the more complicated the results become. However, finding a balance between starters and relievers, reflective of the real game, should be further explored.

Conclusion

A great importance is placed on starting pitching, both in the real and fake game. However, relievers seem to have a growing importance. In 2016, three months of Chapman cost the Cubs two of the game’s best prospects, a trade usually reserved for starting pitching. How to value starting pitching compared to relief pitching is left open to interpretation, especially in the world of fantasy. A reduction on starting pitching value was in order for our league and for standard leagues. How to go about this should reflect the real game. For 10 managers, the decision was to move from strikeouts to K/9.

This initial research demonstrates that this change does not swing the pendulum too far toward relievers and away from starting pitching. A correlation demonstrates the strongest relationship to pitcher ranking is ERA. Given a head-to-head matchup, with an innings limit, having multiple starters with a good ERA will still be favorable to deploying strong relievers. The top 155 pitcher rankings further confirm this fact. Initial conclusion is that a move to K/9 is a positive switch that reflects the growing importance of a good reliever, while still favoring starting pitching.

Appendix A

Top 155 Pitchers

Name
1 Clayton Kershaw
2 Max Scherzer
3 Noah Syndergaard
4 Corey Kluber
5 Chris Sale
6 Madison Bumgarner
7 Jon Lester
8 Chris Archer
9 David Price
10 Stephen Strasburg
11 Carlos Carrasco
12 Yu Darvish
13 Justin Verlander
14 Jake Arrieta
15 Johnny Cueto
16 Jacob deGrom
17 Lance McCullers
18 Rich Hill
19 Robbie Ray
20 Michael Pineda
21 Danny Duffy
22 Steven Matz
23 James Paxton
24 Danny Salazar
25 Carlos Martinez
26 Gerrit Cole
27 Andrew Miller
28 Aroldis Chapman
29 Kenley Jansen
30 Dellin Betances
31 Zack Greinke
32 Aaron Nola
33 Jose Quintana
34 Jameson Taillon
35 Matt Shoemaker
36 Kyle Hendricks
37 Edwin Diaz
38 Dallas Keuchel
39 Cole Hamels
40 Zach Britton
41 Masahiro Tanaka
42 Kenta Maeda
43 Jeff Samardzija
44 Tyler Skaggs
45 John Lackey
46 Vince Velasquez
47 Julio Urias
48 Matt Moore
49 Drew Smyly
50 Julio Teheran
51 Jon Gray
52 Matt Harvey
53 Kevin Gausman
54 Garrett Richards
55 Rick Porcello
56 Gio Gonzalez
57 Alex Reyes
58 Alex Wood
59 Wei-Yin Chen
60 Zack Wheeler
61 Collin McHugh
62 Carlos Rodon
63 Drew Pomeranz
64 Felix Hernandez
65 Tyson Ross
66 Matt Andriese
67 Jerad Eickhoff
68 Sean Manaea
69 Anthony DeSclafani
70 Michael Fulmer
71 Marcus Stroman
72 Blake Snell
73 Taijuan Walker
74 Tyler Glasnow
75 Ian Kennedy
76 Adam Wainwright
77 Jake Odorizzi
78 Jaime Garcia
79 Yordano Ventura
80 Joe Ross
81 J.A. Happ
82 Aaron Sanchez
83 Sonny Gray
84 Jharel Cotton
85 Hisashi Iwakuma
86 Michael Wacha
87 Francisco Liriano
88 Drew Hutchison
89 Mike Foltynewicz
90 Lance Lynn
91 Ricky Nolasco
92 Jeremy Hellickson
93 Archie Bradley
94 Luis Severino
95 Nate Karns
96 Mike Leake
97 Bartolo Colon
98 Mike Montgomery
99 Tyler Anderson
100 Ervin Santana
101 Junior Guerra
102 Ivan Nova
103 Chad Green
104 Tanner Roark
105 Jason Hammel
106 Mike Fiers
107 Dan Straily
108 R.A. Dickey
109 Doug Fister
110 Marco Estrada
111 Homer Bailey
112 Jesse Chavez
113 Ty Blach
114 Jordan Zimmermann
115 Trevor Bauer
116 Brandon Finnegan
117 Edinson Volquez
118 Charlie Morton
119 Daniel Norris
120 Cesar Vargas
121 Zach Davies
122 Adam Conley
123 Eduardo Rodriguez
124 Derek Holland
125 Luis Perdomo
126 Alex Cobb
127 Jose Berrios
128 Josh Tomlin
129 Shelby Miller
130 Chad Bettis
131 Patrick Corbin
132 CC Sabathia
133 Christian Friedrich
134 Hector Santiago
135 Kendall Graveman
136 Anibal Sanchez
137 Steven Brault
138 Tyler Chatwood
139 Wade Miley
140 Chris Tillman
141 Dylan Bundy
142 Andrew Triggs
143 Jason Vargas
144 Matt Garza
145 Phil Hughes
146 Miguel Gonzalez
147 Kyle Gibson
148 Ariel Miranda
149 Tom Koehler
150 Jorge de la Rosa
151 Chase Anderson
152 Martin Perez
153 Chad Kuhl
154 Andrew Cashner
155 Wily Peralta


What to Make of Blake Snell’s Arsenal

I’ll give y’all a warning: This is a very random article. It’s not like Blake Snell isn’t an interesting player; he’s a young arm who is going to be a pivotal piece of the Tampa Bay Rays rotation for a while. Even though he struggles to keep the ball in the zone, he has electric stuff and does a good job of keeping the hits he gives up in the ballpark. He was a highly-touted prospect and certainly delivered on that last year, striking out 24.4% of batters while delivering a 3.39 FIP in 89 innings.

However, there were some reasons to be concerned. Snell was very mediocre, according to Baseball Prospectus’ DRA (Deserved Run Average), which is widely considered to be one of the best measures of a pitcher’s ability. In 2016, he had a DRA of 4.58 with a DRA- of 108, with 100 being considered the average performance by a pitcher. He also struggled to keep batters off base, issuing 5.2 walks per nine and sporting a 1.62 WHIP. These are some legitimate reasons for concern, but I want to try to look at the positives, and that starts by looking at the pitches he throws. The reason scouts have been optimistic about Snell this whole time is because of his stuff. He was known for having a fastball with good velocity and movement, along with a plus slider and change-up that essentially made up for his control issues.

Looking at his 2016 numbers, Snell had a pretty bad fastball, giving up 1.02 runs per 100 pitches thrown, and it got smacked around to the tune of an .893 OPS. He only threw it in the zone 51.4% of the time, and when it was thrown in the zone, it got hit over 86% of the time, which can explain the OPS. That being said, there were positives here that shouldn’t be overlooked. Snell has ridiculous vertical movement on his fastball; 10.7 inches of rise according to the Baseball Prospectus leaderboard. In fact, he ranked fourth overall in fastballs thrown with a spin rate over 2500 RPM. The higher the spin rate, the more the ball tends to “rise” in the eyes of a hitter. Overall, 32.4% of his fastballs registered over 2500 RPM, and if you watch him pitch, you can see that his fastball, when located up in the zone, has a ridiculous amount of life, and makes even the most professional hitters look silly. Also, his fastball ranked in the 70th percentile (minimum 100 fastballs thrown) for whiffs with 19.7%. Snell’s change-up was actually his best pitch in terms of runs saved, saving 2.4 runs per 100 thrown, with good arm-side fade and a 9-mph velocity gap from his fastball. Now, this is where this article takes a strange turn, and leads into why I’m writing it in the first place.

Snell’s slider had the best whiff rate in the MLB last year. Batters missed it a whopping 56.2% of the time, six points better than the NL Cy Young winner Max Scherzer’s slider. Wow! That’s amazing! Let’s check how many runs it saved!

Well, actually, it cost Snell 2.04 runs per 100 thrown…which registered it as one of the worst sliders in baseball. That doesn’t really make a whole lot of sense. Looking deeper, I found his slider got absolutely clobbered when it got hit; it had a 100% HR/FB ratio and got smashed with an .898 OPS when batters hit it. But hitters also missed it 56% percent of the time. Yet it got hit, a lot. We could continue that back and forth forever.

Well, it turns out this isn’t the only breaking ball Snell has. He has a slow, looping curve that clocks in at the low to mid 70s with a ton of vertical drop created by 12-6 movement. He threw both his slider and curve at nearly identical rates, 12% for the slider and 12.8% for the curve. If you look at scouting reports from Baseball Prospectus and FanGraphs, you don’t see any mentions of his curve, just some blurbs about his slider and change-up being quality offspeed offerings. But, his curve was pretty damn good last year, ranking in the top five in runs saved per 100 thrown, with 2.2. It had sharp downward movement and comes out of the same arm slot as his slider, but is much slower, so it keeps batters off balance. It also held batters to a remarkable .162 OPS. It was truly one of the better curves in the game. Looking at this data, I’m left with a question: What do we make of this?

Before I attempt to answer that, I want to show a graph of Snell’s release points in 2016 — it will come up in the next paragraph.


Snell’s fastball has a ton of life, and is an absolutely nasty pitch when left up in the zone. If he’s throwing a “rising” fastball that comes out of the same arm slot as everything else (except the change), to me, it makes sense for him to throw his curve. His fastball becomes much harder to catch up to due to its movement if batters sit curve, and the velocity gap along with the drop he gets on his curve will get batters out if they sit fastball. The combination of the change of eye level, consistent arm slot, and the velocity difference will keep hitters off the entire game.

Not only is Snell improving both his fastball and curve this way, but he’s taking off the reliance on the slider by not having to throw a “bad pitch.” That being said, the slider still gets a ton of whiffs, but I would rather throw a pitch that batters can’t hit/do hit poorly in his curve than essentially taking a 50-50 shot of getting clobbered when throwing a slider. There’s no reason to stop throwing his change-up; it was his best pitch in 2016. It fills the velocity gap between the fastball and the curve and features movement away from righties, which is something he would otherwise lack. This brings me to my last point, and one more snippet of stats for you.

Snell’s slider vs. RHB: .650 SLG

Snell’s slider vs. LHB: .357 SLG

He threw his slider 9.7% of the time to righties. I’m not saying he should stop throwing it completely; there are obviously some redeeming qualities to it if he can get over 50% whiffs on on it. But if Snell can cut down on that slider usage and throw it more or less “exclusively” to lefties, he can eliminate the problem that he was having with it getting blasted. Since both breaking balls leave his hand at the same place, the deception will still be there, especially since batters will have to guess if it’s the harder, faster slider or the slower curve. If he can keep the walks down as well, we’re looking at a brand-new ace in the Rays rotation for 2017, assuming that throwing the better pitch can actually lead to success.


We Good, Pham

Playing with the wonderful new splits leaderboard that was just rolled out on these very pages has led me down a Tommy Pham-shaped rabbit hole.

Tommy Pham has a stat line that is currently boggling my mind.

.214 ISO, 10.9% BB%, .342 BABIP, and 9 HR in 183 PA…good to excellent offensive numbers, in my opinion. Yet despite all of these good to excellent offensive numbers, he sported a major-league-high 38.8% strikeout rate (min 100 PA) that dragged his wRC+ to a barely-above-average 105. This deserves some digging into.

Looking at this 15-game rolling K%, there were times this past season that his rolling K-rate was down to 20.8% (on August 12). The AMAZING thing happens the further right you look on that graph — he begins striking out at a rate that makes Bartolo Colon look patient, hitting a high of 66.7% in the middle of September. From the beginning of the season to August 12, Pham had a wRC+ of 126 — higher than the full-season numbers of Carlos Beltran, Nolan Arenado, and Jose Bautista. After August 12, his wRC+ was 40. 40! FOUR ZERO. That’s behind nine pitchers (min. 40 PA).

AND SOMEHOW

SOMEHOW

He managed to have a higher BABIP when he was walking through life in a strikeout-induced haze. After August 12, he ran a BABIP of .417 with a K% of 59.1%, meaning he didn’t put the ball in play much, but when he did, it was finding the holes. BABIP and wRC+ have an R^2 correlation of 0.23, so you’d sort of expect them to move up and down together. However, before he started striking out like he was afraid someone was going to outlaw strikeouts so he was getting them all in while he could, his BABIP was 89 points lower — .328.

That’s not just lower. That’s much lower. That’s the difference between Dexter Fowler and Albert Pujols. And somehow an 89-point difference in BABIP resulted in an 86-point difference in wRC+ in the wrong direction.

You’d think running a much higher BABIP would be the result of hitting more line drives. After all — that is the variety of batted ball that lands for a hit more often than any type.

BUT. IT. GETS. WEIRDER. He hit line drives 28.0% of the time up to and including August 12. After August 12, he hit line drives ONLY 7.7% OF THE TIME. So with a 28.0% line drive rate, he ran a .328 BABIP, but his 7.7% line-drive rate resulted in a .417 BABIP. WHAT KIND OF MAGIC IS THIS?

Well, you know. The magic of small samples. 183 plate appearances falls nearly 70 short of being half of a qualified season’s plate appearances. Weird things are going to happen when you are looking at smaller samples. Weird things are always happening in baseball; that’s part of its charm. We just don’t always notice because over the course of a season, some weird things will balance out other weird things and we’ll forget how weird things were at some point. That’s why it’s worth it to dive into the numbers — to remind yourself that fun things are always happening in baseball. You may even find yourself surprised with how interesting you find Tommy Pham at the end of it all.


Derek Norris, 2016 — A Season to Forget

While it may not be the most exciting Nationals story of the offseason, Wilson Ramos signing with the Rays and the subsequent trade for Derek Norris to replace him is a very big change for the Nats. Prior to tearing his ACL in September, Ramos was having an incredible 2016, and he really carried the Nationals offense through the first part of the year (with the help of Daniel Murphy, of course) when Harper was scuffling and Anthony Rendon was still working back from last season’s injury. Given Ramos’ injury history it makes sense to let him walk, but Nationals fans have reasons to be concerned about Norris.

After a few seasons of modest success, including an All-Star appearance in 2014, Norris batted well under the Mendoza line (.186) in 2016 with a significant increase in strikeout rate. What was the cause for this precipitous decline? Others have dug into this lost season as well, and this article will focus on using PitchFx pitch-by-pitch data through the pitchRx package in R as well as Statcast batted-ball data manually downloaded into CSV files from baseballsavant.com, and then loaded into R. Note that the Statcast data has some missing values so it is not comprehensive, but it still tells enough to paint a meaningful story.

To start, Norris’ strikeout rate increased from 24% in 2015 to 30% in 2016, but that’s not the entire story. Norris’ BABIP dropped from .310 in 2015 to .238 in 2016 as well, but his ISO stayed relatively flat (.153 in 2015 vs. .142 in 2016). Given the randomness that can be associated with BABIP, this could be good new for Nats fans, but upon further investigation there’s reason to believe this drop was not an aberration.

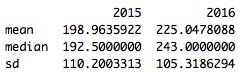
Using the batted-ball Statcast data, it doesn’t appear that Norris is making weaker contact, at least from a velocity standpoint (chart shows values in MPH):

Screen Shot 2016-12-11 at 9.50.27 PM.png

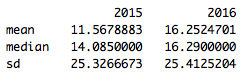
Distance, on the other hand, does show a noticeable difference (chart shows values in feet):

Screen Shot 2016-12-11 at 9.53.45 PM.png

So Norris is hitting the ball further in 2016, but to less success, which translates to lazy fly balls. This is borne out by the angle of balls he put in play in 2015 vs. 2016 (values represent the vertical angle of the ball at contact).

Screen Shot 2016-12-11 at 9.56.55 PM.png

The shifts in distance & angle year over year are both statistically significant (velocity is not), indicating these are meaningful changes, and they appear to be caused at least in part by the way pitchers are attacking Norris.

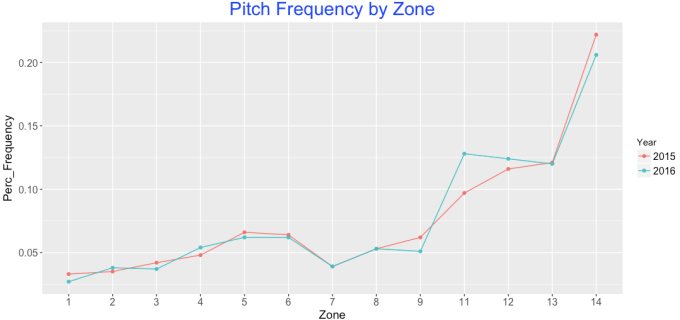
Switching to the PitchFx data, it appears pitchers have begun attacking Norris up and out of the zone more in 2016. The below chart shows the percentage frequency of all pitches thrown to Derek Norris in 2015 & 2016 based on pitch location. Norris has seen a noticeable increase in pitches in Zones 11 & 12, which are up and out of the strike zone.

Screen Shot 2016-12-11 at 10.11.19 PM.png

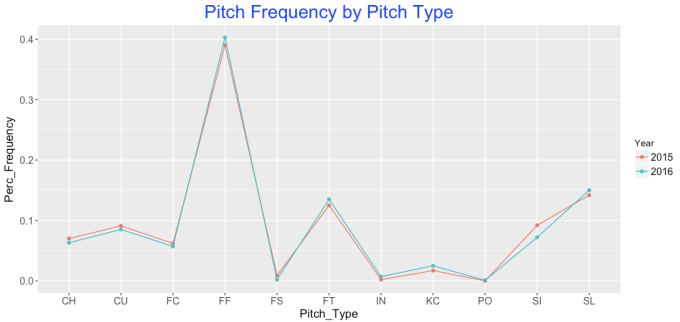
Norris has also seen a corresponding jump in fastballs, which makes sense given this changing location. This shift isn’t as noticeable as location, but Norris has seen fewer change-ups (CH) and sinkers (SI) and an increase in two-seam (FT) & four-seam fastballs (FF).

Screen Shot 2016-12-11 at 10.15.10 PM.png

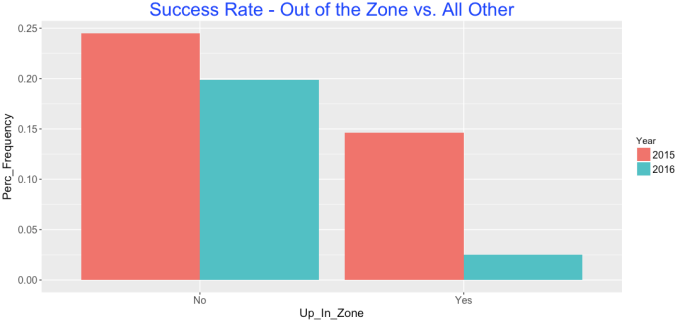
The net results from this are striking. The below chart shows Norris’ “success” rate for pitches in Zones 11 & 12 (Represented by “Yes” values, bars on the right below) compared to all other zones for only outcome pitches, or the last pitch of a given at-bat. In this case success is defined by getting a hit of any kind, and a failure is any non-productive out (so, excluding sacrifices). All other plate appearances were excluded.

Screen Shot 2016-12-11 at 10.21.20 PM.png

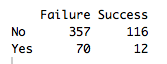
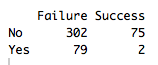
While Norris was less effective overall in 2016, the drop in effectiveness on zone 11 and 12 pitches is extremely noticeable. Looking at the raw numbers makes this even more dramatic:

2015                                                     2016

Screen Shot 2016-12-11 at 10.23.19 PM.png                       Screen Shot 2016-12-11 at 10.23.38 PM.png

So not only did more at-bats end with pitches in zones 11 and 12; Norris ended up a shocking 2-for-81 in these situations in 2016.

In short, Norris should expect a steady stream of fastballs up in the zone in 2016, and if he can’t figure out how to handle them, the Nationals may seriously regret handing him the keys to the catcher position in 2016.

All code can be found at the following location : https://github.com/WesleyPasfield/Baseball/blob/master/DerekNorris.R


Batted Balls and Adam Eaton’s Throwing Arm

Adam Eaton, he of 6 WAR, is now on the Nationals and there is a lot of discussion happening regarding that.  It would seem that maybe 2 – 3 of those WAR wins are attributable to his robust defensive play in 2016. 20 DRS!

In Dave Cameron’s article “Maybe Adam Eaton Should Stay in Right Field,” Dave points out that Eaton led MLB with 18 assists and added significant value by “convincing them not to run in the first place.”

What Dave and most of the other defensive metrics that I’ve seen on the public pages tend to ignore is the characteristics of the ball in play, i.e. fielding angle and exit velocity, and these impacts on the outfielders performance.  So with only a bit of really good Statcast data I understand this is still hard to do, but it’s time to start.  You can easily envision that balls hit to outfielders in different ways (i.e. launch angle and velocity) can result in different outfield outcomes.  Whether it is the likelihood of an out being made on that ball in play, or whether it is how that ball interacts with runners on base.  Ignoring this data has nagged me for a while now, as I love to play with the idea of outfield defense (just look at my other community posts).

So can some of these stats explain Adam Eaton’s defensive prowess this season?  Maybe it’s possible.  I had downloaded all the outfield ball-in-play data from the 2016 Statcast search engine so I fired it up.  I have cleaned the data up to include the outfielder name and position for each play.  Using this I can filter the data for the situation Dave describes, which is:

A single happens to right field with a runner on first base.

Before we go into the individual outfielders, let’s look in general:


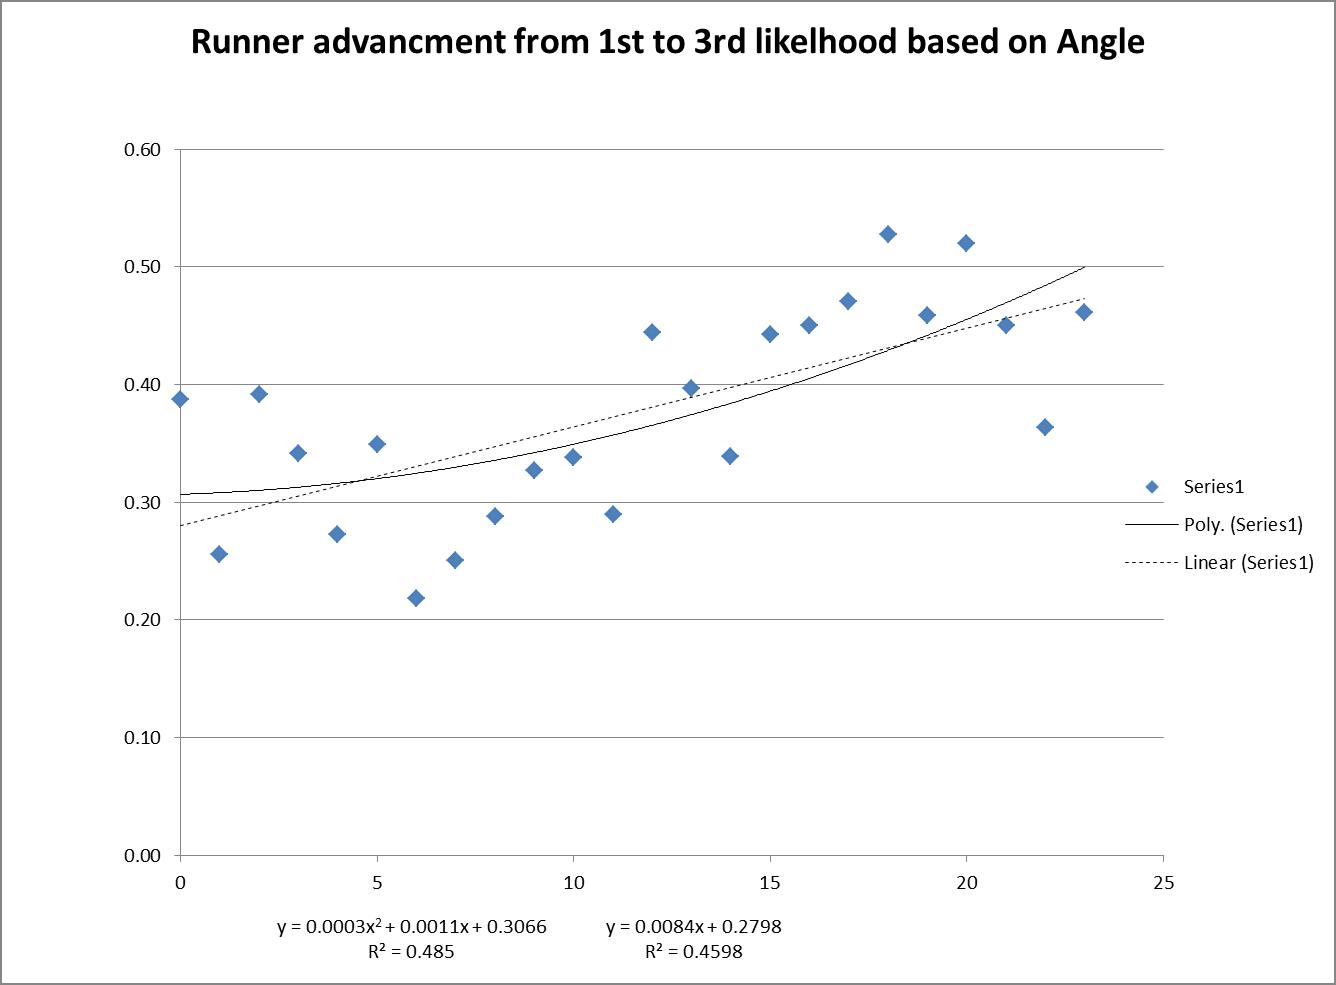
By looking in general at the plays, you can see that a player is significantly less likely to advance from 1st to 3rd on a single to right field if the ball is hit at 5 degrees vs 15 degrees.  It’s nearly double from ~20% at 5 degrees to ~40% at 15 degrees.  Wow. That’s huge, and with an R-squared of nearly 50%, we’re talking half of the decision to go from 1st to 3rd can be tied to the launch angle.  (The chart is basically parabolic if you go to the negative launch angles which do appear in the data set, but with much less frequency, which is why I removed those data points.  But it makes sense that it would be way.)

I did this same analysis using exit velocity and it wasn’t nearly as conclusive, though there was a trend downward, i.e guys were less likely to advance on singles hit at 100mph then they were for singles hit at 60 mph. The r-squared was ~13%.

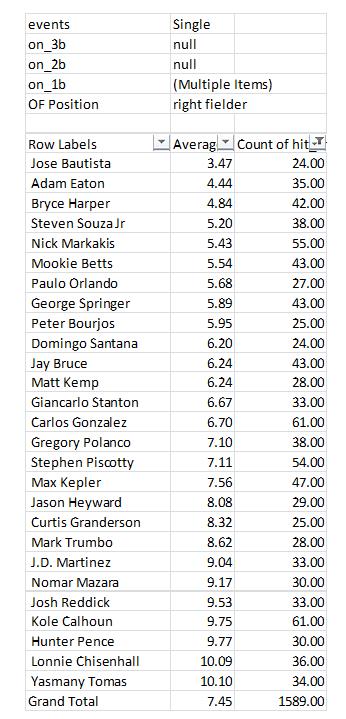
So now that we see that the angle the BIP comes to the outfield can make a big difference, who were the lucky recipients in the outfield of runner-movement-prevention balls in play?  When filtered to remove anybody who made fewer than 20 of this type of play, you end up with Eaton at No. 2 with an average angle of 4.44 (Bryce Harper, his now-teammate and also mentioned in Dave’s article in conjunction with his similarly excellent runner-movement-prevention, comes in at No. 3.  Possibly not a coincidence.)


You may notice my total number of plays for Eaton doesn’t match the total referenced by Dave per Baseball-Reference. I filtered out the plays where Eaton was in center field (which were several).  I believe that my analysis from the Statcast data had Eaton with 48 plays of this type (I think Dave’s article mentioned 52 per BR? Not sure what the difference is).

So in conclusion, I do think it’s very possible that Adam Eaton’s defensive numbers this past season, in particular with regards to his “ARM” scoring, could have been dramatically influenced in a positive direction simply by the balls that were hit to him and the angle they came.  Clearly this is something he has absolutely no control over whatsoever and it could fluctuate to another direction entirely next year.  I do think this area of analysis, in particular for outfield plays, whether it’s catches, assists, or even preventing advancement for runners, is a very ripe field for new approaches which in time should give us a much better idea of players’ defensive value.

That said, in this simple analysis the angle only accounted for ~50% of that runner-movement-prevention and that still leaves arm strength and accuracy as likely significant contributors, both of which I believe Eaton excels at.  And of course he did throw all those guys out.  So Eaton should be fine, likely well above average, but just don’t expect those easy singles to keep coming to him.


Where Bryce Harper Was Still Elite

Bryce Harper just had a down season. That seems like a weird thing to write about someone who played to a 112 wRC+, but when you’re coming off a Bondsian .330/.460/.649 season, a line of .243/.373/.441 seems pedestrian. Would most major-league baseball players like to put up a batting line that’s 12% better than average? Yes (by definition). But based on his 2015 season, we didn’t expect “slightly above average” from Bryce Harper. We expected “world-beating.” We didn’t quite get it, but there’s one thing he is still amazing at — no one in the National League can work the count quite like him.
Read the rest of this entry »


The Homer Numbers of a Hypothetically-Healthy Giancarlo Stanton

Giancarlo Stanton has missed significant playing time since his MLB debut in 2010 and has never played more than 150 games of a 162-game season (145 and 123 games being his next two highest totals). In spite of his injury-shortened seasons, Stanton has still been among the league home-run leaders in 2011, 2012, and 2014 (his 150, 123, and 145-game seasons, respectively).

Giancarlo Stanton Since Debut (June 2010)
Season Games PA HR HR MLB Rank Injury Report
2010 100 396 22 T-55 ——
2011 150 601 34 9 Hamstring issues limited time
2012 123 501 37 7 15-day DL: Arthroscopic knee surgery
2013 116 504 24 T-31 15-day DL: Strained right hamstring
  2014* 145 638 37 2 Season-ending facial fracture
2015 74 318 27 T-25 15-day DL: Season-ending hamate (hand) fracture
2016 119 470 27 48 15-day DL: Strained left groin
*=finished 2nd in NL MVP race (Clayton Kershaw)

Career-wise, Stanton has amassed a total of 208 home runs, good enough for 16th-most of any player through their age-26 season and among the likes of Miguel Cabrera and Jose Canseco.

HR-leaders through Age-26 season
Rank Player HR
1 Alex Rodriguez 298
2 Jimmie Foxx 266
3 Eddie Matthews 253
4 Albert Pujols 250
5 Mickey Mantle 249
6 Mel Ott 242
7 Frank Robinson 241
8 Ken Griffey, Jr. 238
9 Orlando Cepeda 222
10 Andruw Jones 221
11 Hank Aaron 219
12 Juan Gonzalez 214
13 Johnny Bench 212
14 Miguel Cabrera 209
14 Jose Canseco 209
16 Giancarlo Stanton 208

Given Stanton’s injury-plagued career, his career home-run numbers are a lower bound on what he may have accomplished had he played full, injury-free seasons following his debut. To quantify how Stanton’s injuries have suppressed Stanton’s career power numbers thus far, I extrapolated the home-run totals of Stanton’s injury-shortened seasons into full-season hypothetical home-run totals (hHR) using the formula below:

hHR = FLOOR(HR/G * 162)

The formula simply assumes that Stanton maintains his HR/G rate through a whole 162-game season and then conservatively rounds down. We can now compare home-run totals between the real Giancarlo Stanton and our hypothetical Giancarlo Stanton. I excluded his 2010 debut from the extrapolation.

Real Giancarlo Stanton vs. Hypothetical Giancarlo Stanton
Season Games HR HR MLB Rank hGames hHR hHR MLB Rank
2010 100 22 T-55 100 22 T-55
2011 150 34 9 162 36 8
2012 123 37 7 162 48 1
2013 116 24 T-31 162 33 T-9
2014 145 37 2 162 41 1
2015 74 27 T-25 162 59 1
2016 119 27 48 162 36 T-16

The real Stanton never led the MLB in home runs, but our hypothetical Stanton climbs into the MLB lead in three of his hypothetical seasons (2012, 2014, and 2015).

Career-wise, our hypothetical Stanton would have hit 275 total home runs. This hypothetical Stanton adds 67 home runs to his real total, jumping from 16th to second place on the Age-26 leaderboard, only 23 home runs behind the far-away leader, Alex Rodriguez.

HR-leaders through Age-26 season
Rank Player HR
1 Alex Rodriguez 298
2 Giancarlo Stanton (hypothetical) 275
3 Jimmie Foxx 266
4 Eddie Matthews 253
5 Albert Pujols 250
6 Mickey Mantle 249
7 Mel Ott 242
8 Frank Robinson 241
9 Ken Griffey, Jr. 238
10 Orlando Cepeda 222
11 Andruw Jones 221
12 Hank Aaron 219
13 Juan Gonzalez 214
14 Johnny Bench 212
15 Miguel Cabrera 209
16 Jose Canseco 209
17 Giancarlo Stanton (real) 208

Of note, using the same formula to calculate Stanton’s career strikeout totals predicts a whopping 1271 strikeouts for our hypothetical Stanton. His 977 strikeout “real” total through age 26 (second-highest) balloons and surpasses Justin Upton’s age-26-leading 1026 for a clear command of first place.

In reality, Stanton is a three-time All-Star, a Silver Slugger (2014), and a Home Run Derby champion (2016), and he historically ranks among the best in home-run totals for his age, all while facing injury issues in all of his first six full big-league seasons. Our hypothetically-healthy Giancarlo Stanton greatly improves his career numbers and garners himself a few MLB home-run crowns, giving a glimpse into how much larger his career numbers could be today had his first six full seasons been injury-free. As Stanton’s career progresses, it will be interesting to see where his home-run totals end up, and, unfortunately, how much greater they could have been.

Credit to Baseball-Reference for all publicly available data.


Eric Thames: The Ideal Gamble

It was in November, yet we may already have the most fascinating free-agency signing of the offseason. Traditionally, free agency is for contending major-league clubs looking to overpay players in hopes that they can deliver a championship. The Milwaukee Brewers went off the beaten path and may be using free agency as a vessel to help their rebuild.

This year’s free-agent class, headlined by Edwin Encarnacion (34) and Carlos Beltran (39), has a shortage of quality bats. The 2016-2017 free-agent class will more than likely be defined by complementary players rather than typical studs who will impact a pennant race. This lack of possible assets forced the Milwaukee Brewers to get creative. The Brewers’ signing of KBO baseball star Eric Thames, four years removed from his last MLB at-bat was…genius?

First, let’s see how we got here.

The Brewers were unhappy with Chris Carter manning the first-base position. It is not often a team will cut a player after he hit 41 home runs, but that is exactly what happened. Carter’s overall lack of production outweighed the power output. Posting a .218 batting average, coupled with a 33.1% strikeout percentage, Carter performed slightly better than a replacement-level player. After cutting ties with Carter, Milwaukee looked at its free-agent options.

With his coming off a 47-home-run season, it is unrealistic for the Brewers to sign All-Star Mark Trumbo (30). The only other impact bat would be Mike Napoli (35). Napoli should benefit from the scarcity of sluggers this offseason. In 2016, Napoli had a nice bounce-back campaign, launching 35 home runs and making headlines such as “Party at Napoli’s.” However, the party stops at first base. Napoli is a below-average baserunner and defender, causing his VORP (Value Over Replacement Level Player) to total just 1.0.

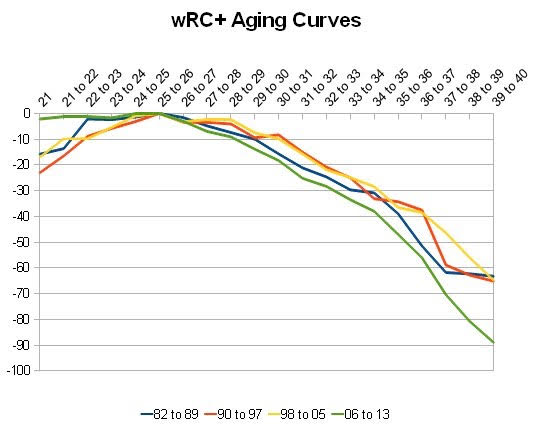
aging-curvesThe Brewers would have to be in love with Napoli’s ability to swing the stick for the club to decide to pull the trigger. But a 35-year-old slugger with poor defense is likely not a good fit for any National League team, let alone the rebuilding Brewers.

As for the rest of the free agents, there is a theme of mediocrity. Moreover, each of them will be over the age of 30 by opening day. Even if the remaining players are able to defy the odds and maintain their levels of performance, it will be nothing more than a stop-gap signing.

After a 73-89 campaign in 2016, the Brewers are not in “win now” mode. Over the past two years, the Brewers have sold, sold, and sold some more. Each trade Milwaukee made brought in quality talent, and according to MLB.com Milwaukee now has MLB’s #1 farm system. Milwaukee has eight players cracking the top-100 prospect list that will be making themselves known as soon as next year. So for a team in rebuilding mode, why sign Eric Thames? Low risk; high reward.

Per Adam McCalvy, Thames will make $4 million in 2017, $5 million the year after, and $6 million in 2019. The team also holds an option on his contract for 2020 for $7.5 million, with a $1-million buyout. That totals out to $16 million guaranteed. Fiscally, it boils down to this: Approximately $25 million for two years of Carter or 3-4 years of Thames for $16-$24.5 million, including bonuses.

In 181 major-league games, Thames posted a .250 batting average with 21 home runs. He had a respectable .727 OPS in that time. This bodes well in comparison to recent Cubs signee Jon Jay who had a similar .774 OPS in his first two seasons. Thames found himself out of the league, while Jon Jay continued his successful career. After 2012, Thames found work in the aforementioned KBO. Over three seasons, Thames averaged 42 home runs while hitting .347 and earned an MVP award in 2015. Oh, and there’s a 30-minute highlight reel of just home runs.

Pitching in Korea cannot be compared to the talent in Major League Baseball. There is a big difference between putting up numbers in Korea and doing so in MLB. However, Jung Ho Kang and Hyun Soo Kim are supporting evidence that succeeding can be done. One thing is evident when watching Thames swing: he has raw power to all fields.

If Thames performs similarly to his 2011-2012 form, then Milwaukee has lost nothing. The deal would simply mean they swapped two replacement-level first basemen while simultaneously saving money. But if Thames shows that he truly is a new player, Milwaukee will once again be front and center during the trade deadline. Thames could be the premier left-handed bat on the trade market while also having a dream contract for contending clubs. The value of his bat along with contractual control over him through 2020 at only $16 million guaranteed could bring in multiple top prospects. This is the dream scenario of course, but hey, it can’t hurt to dream.