Brandon Crawford’s changed approach – raised hands and raised stats
Brandon Crawford has always been known as a defensive shortstop. His three-straight Gold Glove awards can attest to that, as do advanced metrics (he isn’t pulling a Derek Jeter). It wasn’t until Crawford’s third full season (2014) that he became an above-average bat. Though, with a 101 wRC+, he was more average than above. Thanks to a power surge in the following season (that may or may not have been aided by the juiced ball), Brandon had his offensive career-year, running a 113 wRC+ along with 21 home runs, 11 more than his previous career high.
Essentially, this is a long-winded way of saying Brandon Crawford hasn’t been a middle-of-the-order, annual Silver Slugger-contending batter. The majority of his value is produced on the field. Because of this, Brandon Crawford’s 44 wRC+ from the start of the season through April 25th was concerning but not devastating. All the analysis in this piece was done using data from March 29th, 2018 through June 26th, 2018.
April 27th, 2018 may be remembered as the day the Giants’ shortstop energized their offense. According to Alex Pavlovic, Crawford made a mechanical adjustment in his swing. In his own words, Brandon is “getting [his] hands up and into the right slot by the time [he] start [his] swing.” Below are two set positions, immediately prior to the pitcher lifting his leading leg in his motion. Notice his hand positions.
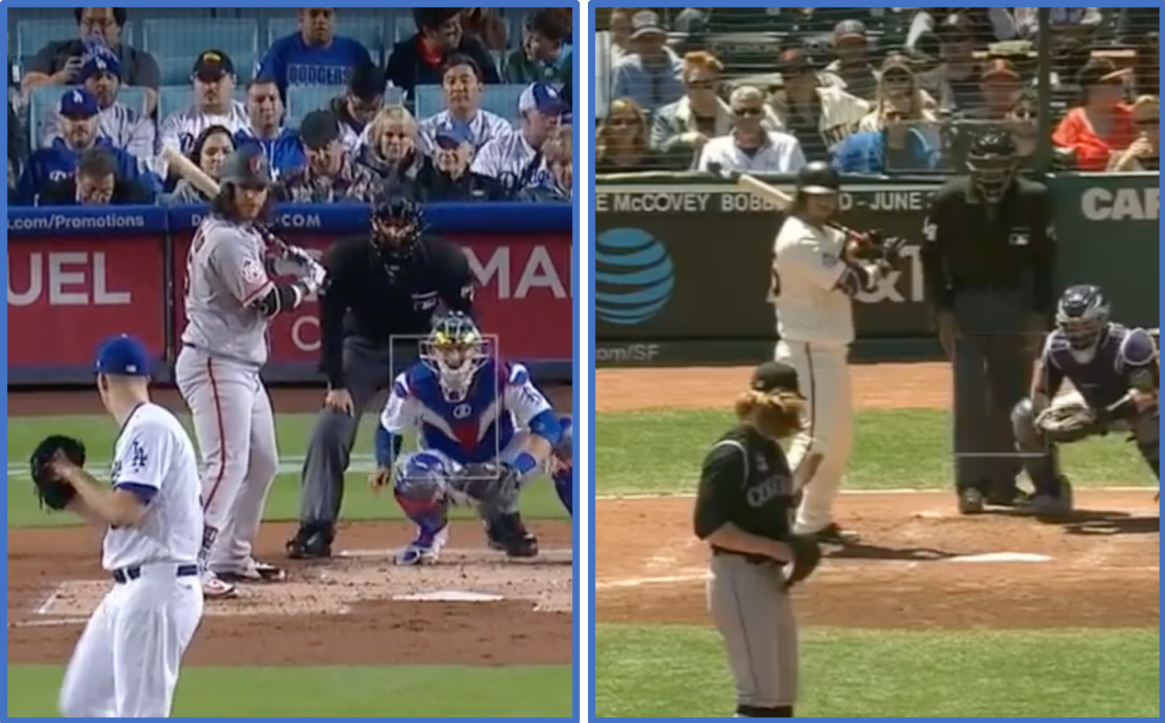
On the left is an at bat against Alex Wood from March 30th, 2018, where he struck out and went 1-3. On the right is an at bat versus Brooks Pounders of the Rockies, on May 19th, 2018. He went 3-5 with 4 RBI’s that day. Both images were from videos found on MLB’s Youtube page.
Like Brandon said in Pavlovic’s piece, the change was only a few inches of hand relocation. Below I highlighted the hand & bat angle to help. Note: the camera angle is slightly tilted, contributing partially to the angle of his hands in the second image. Through viewing multiple swings, I can confirm the angle seen is close to or equals what he is currently doing.
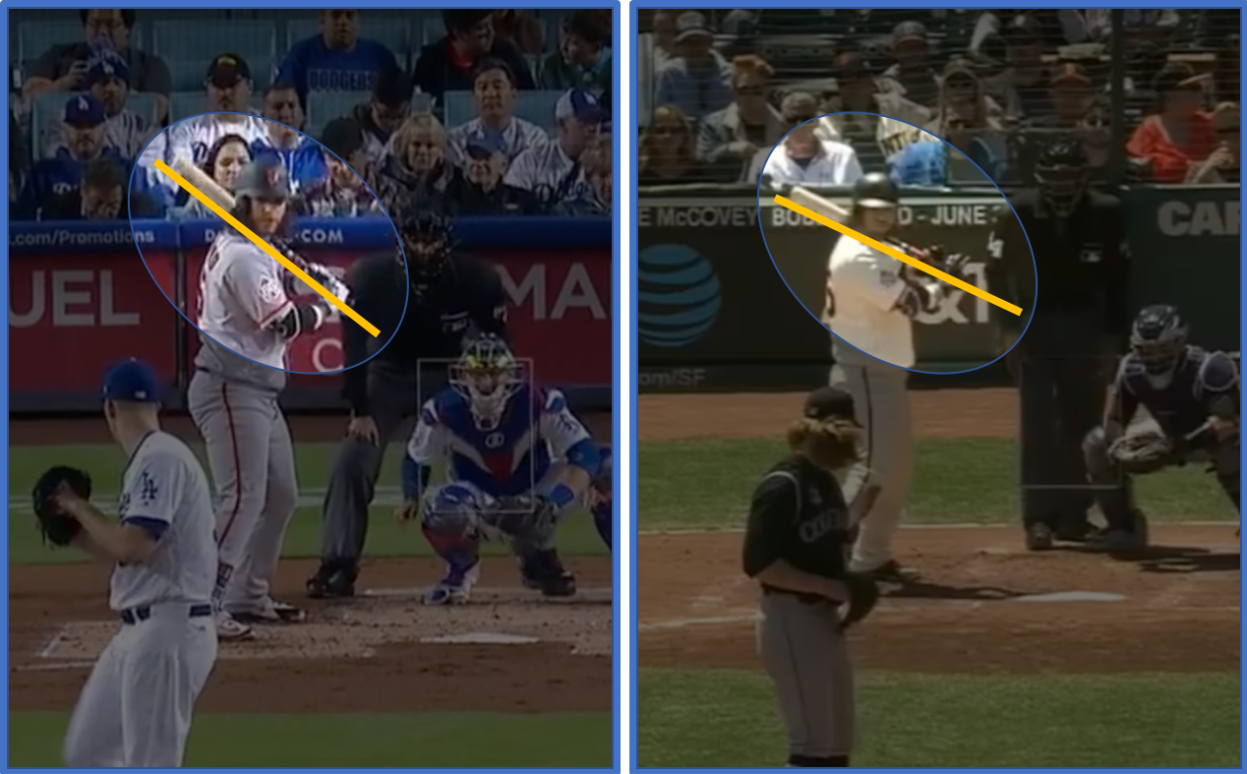
It may still be tough to see, but it’s there. This subtle change, contrary to the current ‘air ball‘ revolution’s lowering of ones hands for added loft, has fueled Brandon Crawford’s May. He had one of the hottest May’s of 2018, running a .448 wOBA and a 190 wRC+.
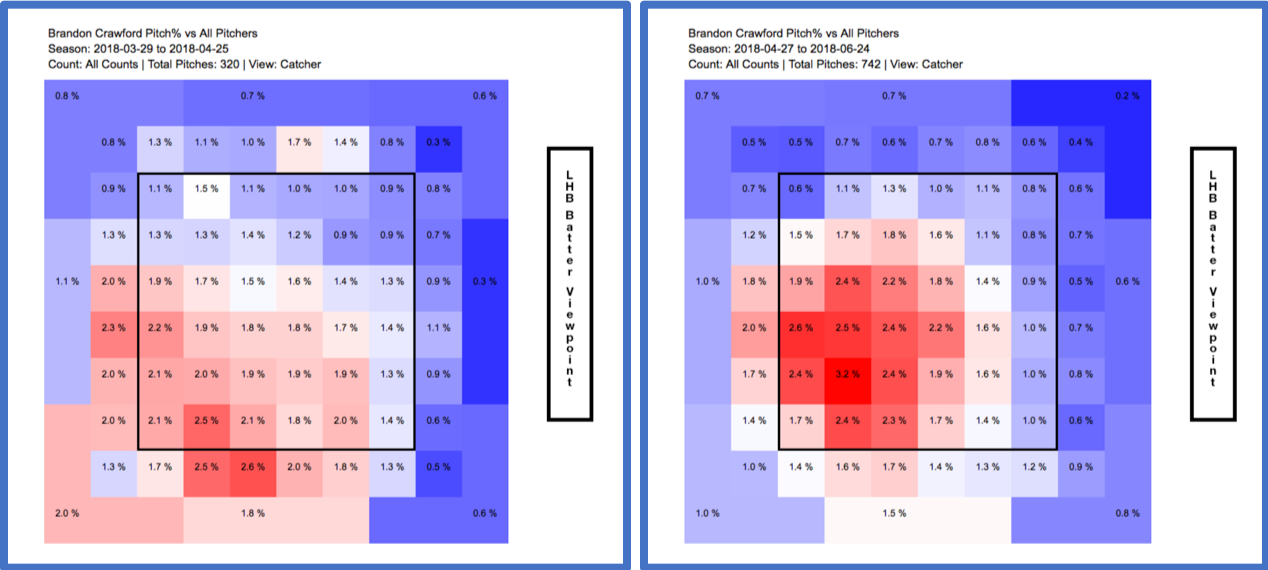
How has this mechanical change led to such a hot streak? Well, one could say he’s gotten lucky. Pitchers began to throw more pitches in the strike zone, of which Crawford is taking advantage. On the left is a heat map of pitches thrown to Brandon Crawford prior to the mechanical chance, and on the right is after the change. All the heat maps are from Fangraphs.
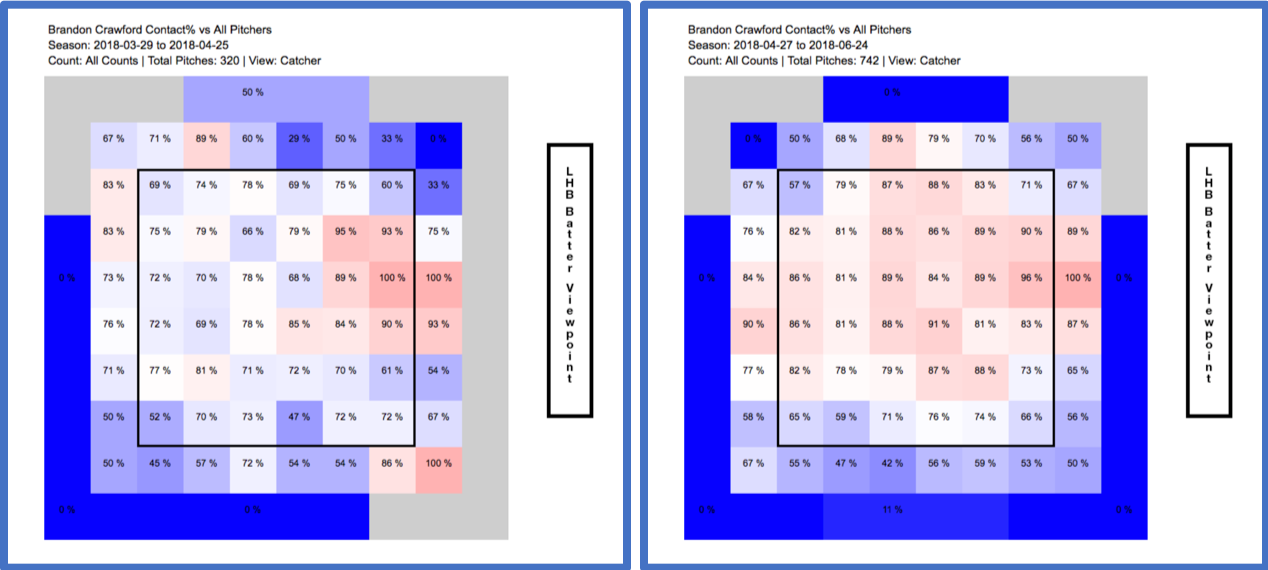
Pitchers aren’t the only ones locating the outside corner more. Crawford has increased his plate coverage since raising his hands. Before the change, he was struggling to make contact anywhere besides on the inside corner. Now, however, he is covering both corners, and up in the zone. Like above, the left heat map is from the period prior to the change, and the right heat map is from after the change was made.
What does this look like statistically? Through Statcast, we are able to measure the changes in Crawford’s batted ball distribution and quality of contact. The data in this table and the below distribution are from Statcast, through Baseball Savant.
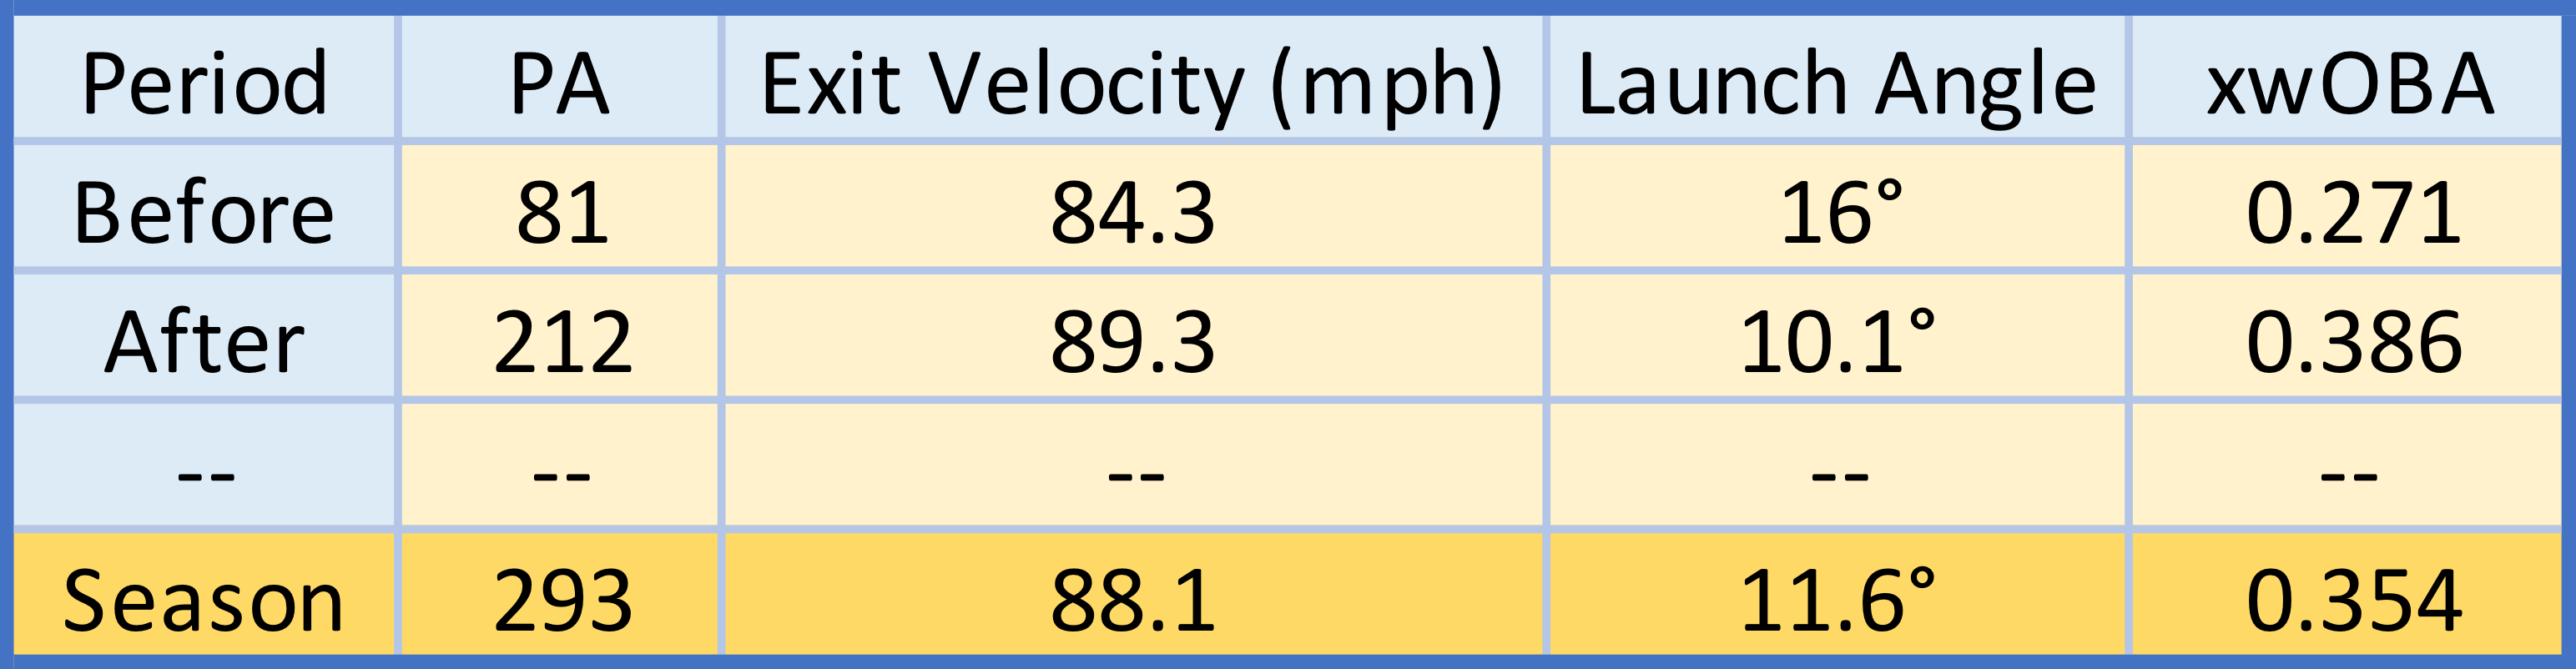
Brandon Crawford has hit the ball much harder since the hand position change, increasing his exit velocity by 6 mph! xwOBA, a stat that encompasses all offensive contributions and can be read like batting average, validates this improved batted ball profile. xwOBA uses a batter’s launch angle and exit velocity for each batted ball to calculate the expected wOBA value for each event, as an attempt to strip away defense and luck from the batter’s offensive performance. Brandon’s launch angle has lowered, however, furthering itself from the ideal fly ball range of the low to mid-20 degree range (though, some research may suggest that, at a 90 mph average exit velocity, a 13 degree launch angle may be optimal).
Average launch angle is deceiving, however, as extreme batted balls aren’t captured as well in the mean of all batted balls. A ground ball with a -10 degree launch angle and a pop up with a 45 degree launch angle would imply that the batter has an ideal launch angle of 17.5 degrees, though a ground ball and a pop up aren’t ideal outcomes. Below is Brandon Crawford’s launch angle distributions, before and after his hand position change.
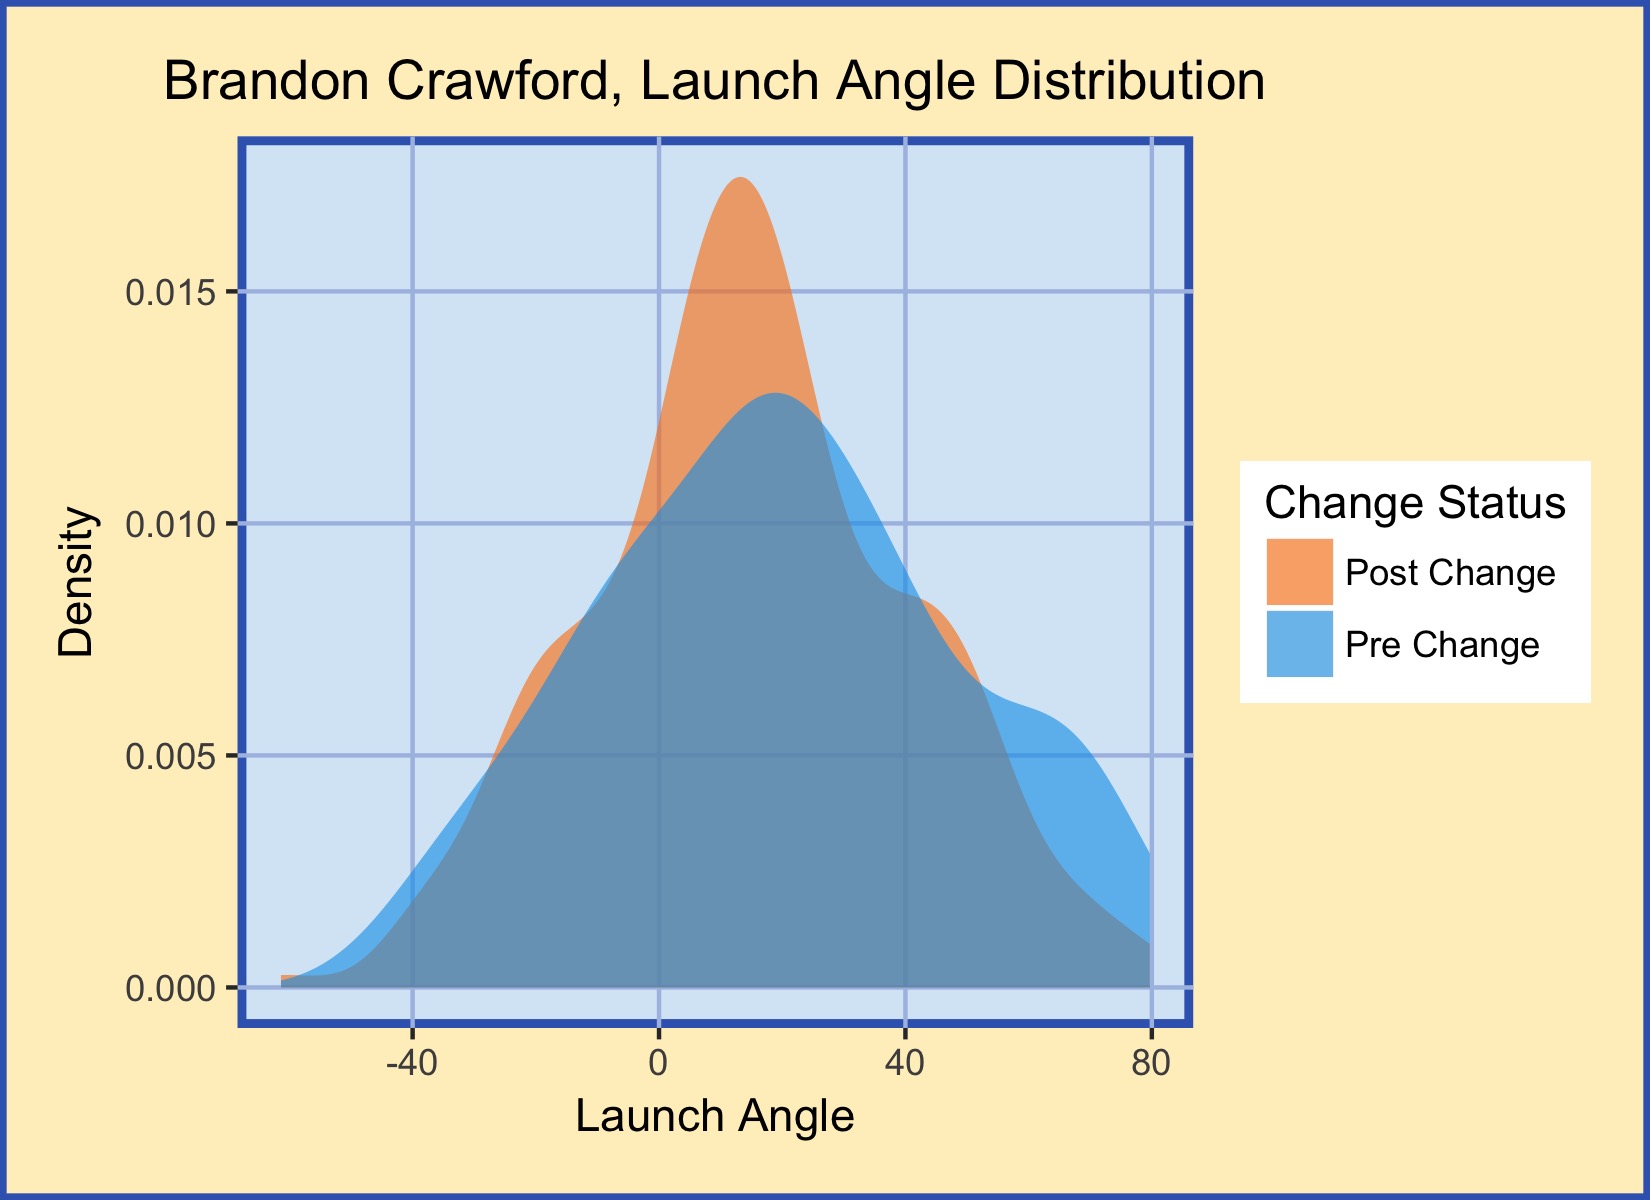
If anything, Crawford has trimmed worse-balled balls in favor of ideal batted balls. Despite lowering his average launch angle, Brandon Crawford increased the frequency of high-performance batted balls, namely line drives. As seen in the post-change pink distribution, Brandon reduced the number of pop ups and extreme ground balls. This can be seen in his batted ball rate statistics. This data is from Fangraphs.
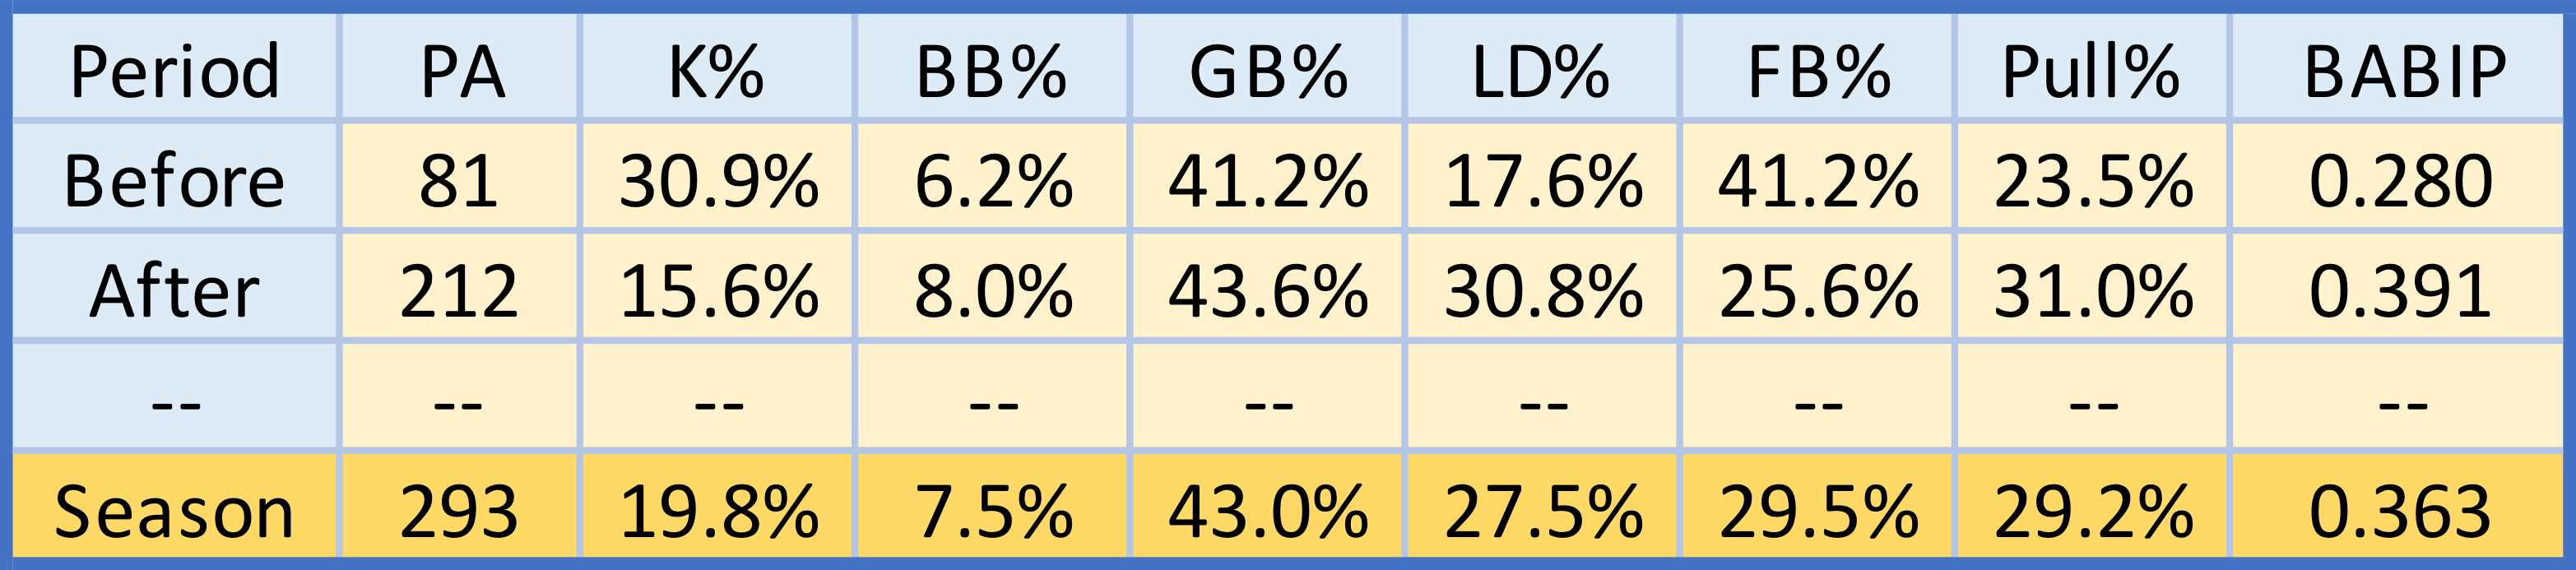
The changes in his offensive profile are reflected in the above table. Brandon’s increased line drive rate is seen in both the distribution and the rate statistics. His average launch angle decrease comes from replacing many fly balls with line drives. This high line drive rate helps explain the high BABIP (batting average on balls in play). Similarly, pulled balls are hit harder and, shift-dependent, can do more damage to the opposing team. Brandon’s K-rate decreased from dangerously high in one period to far below average in the post-change period, while his walk rate fell further below average between periods. Both of these drops were caused by the increased zone rate mentioned above (in the heat maps).
Brandon Crawford had a far-too high K-rate while being far too unproductive for his team. After receiving a bit of swing advice, raising his hands a few inches, he has become one of the hottest hitters in baseball. As the season has gone on, Crawford has slightly cooled off – his high post-change BABIP and line drive rates likely aren’t sustainable – though with the stronger plate coverage and better approach at the plate, Crawford shouldn’t return to his April self.
– tb
Great article!