A Metric for Home-Plate Umpire Consistency
When calling balls and strikes, consistency matters. As long as an umpire always calls borderline pitches the same way within a game, players seem to accept variations from the rule book strike zone. While there have been many excellent analyses of umpire accuracy, these studies tend to focus on conformity to a fixed zone, rather than on the dependability of those calls.
Disgruntled fans can turn to Brooks Baseball’s strike zone plots when they feel an umpire has had a bad game against their team. For example, the following zone map seems egregiously bad:
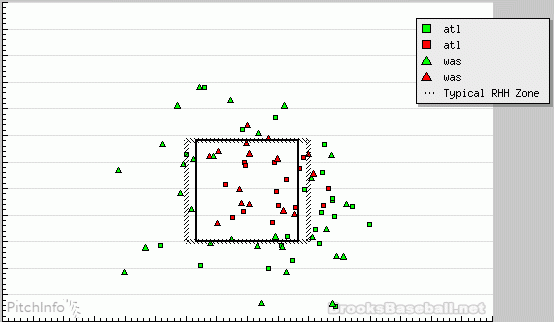
The calls seem very capricious, especially on the outside (right) of the zone. Balls (in green) are found in the same locations as strikes (in red), and some called strikes landed much further outside than pitches that were called balls.
On the other hand, the zone map below appears fairly consistent:
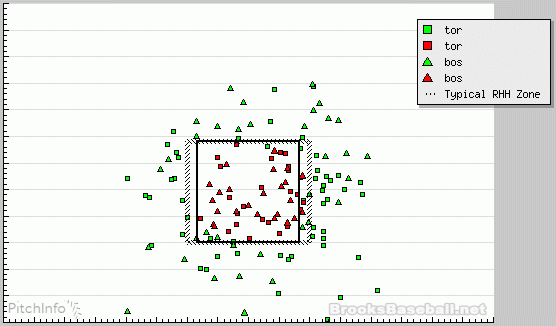
One might quibble with a couple of the outside calls, but the called strikes, for the most part, are contained within a ring of balls. Notice also that pitches in the lower-inside corner were consistently called balls. While this umpire didn’t establish a perfectly rectangular zone, he did establish a consistent zone; neither pitcher got those calls on the inside corner, and hitters on both teams generally knew what to expect.
In this post, I will propose a metric for assessing the inconsistency of an umpire’s strike zone. This metric does not assess how well the umpire conformed to the rule-book zone or the consensus MLB zone. Rather, it uses some tools from computational geometry to compare the overall shape formed by called strikes with the shape formed by the called balls.
Data from MLB Advanced Media describes each pitch as an ordered pair (px, pz), representing the left/right and up/down positions of the ball as it crosses the front of the plate. This pitch-tracking data includes measurements of each batter’s stance, which can be used to normalize the up/down positions to account for batters of different heights. If we draw a scatterplot of these adjusted positions corresponding to called strikes during a given game, the outline of the points represents what we define as the umpire’s established strike zone.
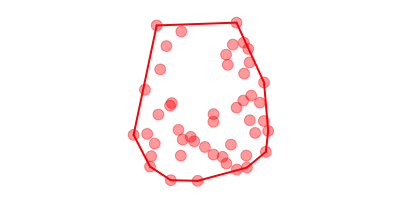
More precisely, the established strike zone is what mathematicians call the “convex hull” of these points. If you draw the points on a sheet of paper, the convex hull is what would remain if you trimmed the paper as much as possible, without removing any points, using only straight cuts that go all the way across the sheet.
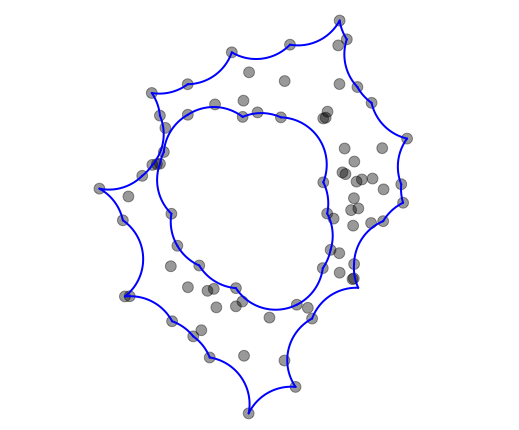
A similar construction describes the alpha hull of a set of points: replace the paper cutter with a hole punch that can only punch out circular holes of a given radius. Punch out as much of the paper as possible, without removing any of the points, and what remains is the alpha hull. Unlike the convex hull, the alpha hull can have empty region in its interior. We can therefore define an umpire’s established ball zone as the alpha hull of points corresponding to called balls.
A consistently-called game should have the property that the established ball zone lies entirely outside of the established strike zone. Any called strikes that fall within the established ball zone (and any balls inside the established strike zone) are inconsistent calls. Since it is reasonable to expect that a consistent umpire will establish different zones depending on the handedness of the batter, we calculate established zones separately for left- and right-handed batters, and then count the number of inconsistent calls from each side of the plate.
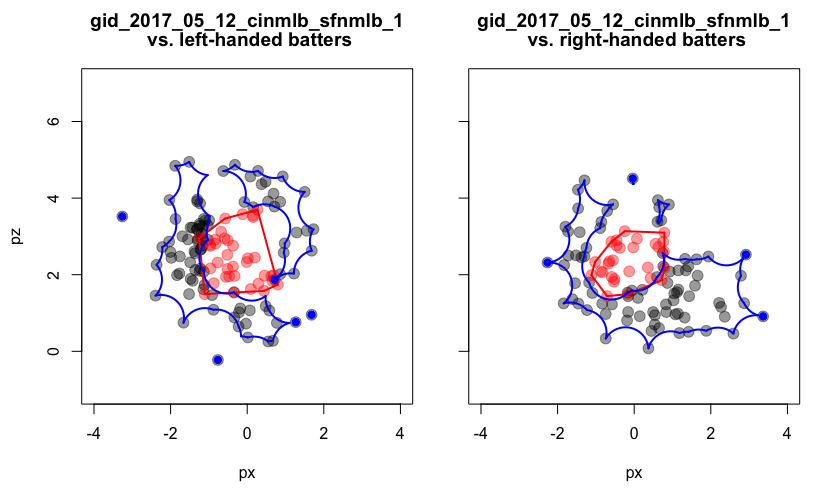
Over the course of a game, an umpire’s inconsistency index is the ratio of inconsistent calls to the total number of calls made. For example, the plots below show the established strike and ball zones for the game between the Reds and the Giants on May 12, 2017. Of the 239 calls made that day by the home-plate umpire, 14 balls fell within the established strike zone, while 5 called strikes landed in the established ball zone, resulting in an inconsistency index of (14+5)/239 ≈ 0.0795.
How do MLB umpires fare under this metric? Quite well, actually. Using data for the 2017 season (through September 10), the average inconsistency index for all games called was 0.0396. Moreover, of the 2112 games analyzed, there were 183 games where the home-plate umpire scored an inconsistency index of 0.0, meaning that the established strike zone fell completely within the established ball zone. The 15 most consistent umpires, based on their average inconsistency index over all games called in 2017, are given in the table below.
| Rank | Umpire | Inconsistency index (lower is better) |
|---|---|---|
| 1. | John Libka | 0.0239 |
| 2. | Mike DiMuro | 0.0253 |
| 3. | Nick Mahrley | 0.0274 |
| 4. | Carlos Torres | 0.0275 |
| 5. | Chris Segal | 0.0275 |
| 6. | Chad Fairchild | 0.0281 |
| 7. | Ben May | 0.0281 |
| 8. | Travis Eggert | 0.0292 |
| 9. | Dale Scott | 0.0301 |
| 10. | Gabe Morales | 0.0308 |
| 11. | Jim Wolf | 0.0310 |
| 12. | Sean Barber | 0.0310 |
| 13. | Eric Cooper | 0.0312 |
| 14. | Manny Gonzalez | 0.0313 |
| 15. | Brian Knight | 0.0314 |
While the strike zones of these umpires may not robotically correspond to the rectangles we see on MLB broadcasts, the zones they do establish are remarkably consistent.
Graphs and computations in this article were produced in R, using the PitchRx and alphahull packages. Source code for producing these examples is available on GitHub.