Are Hitters Hitting It Where It’s Being Pitched?

If you watch basebll games, which you probably do if you find yourself reading this, then you’re likely familiar with announcers employing phrases like “he just went with it,” or “hit it where it was pitched.” These phrases suggest hitters have made contact with the baseball such that outside pitches are hit to the opposite field and pitches on the inner half are put in play to the hitter’s pull side.
These comments beg the question: are hitters “going with” the pitches they are thrown with any discernible frequency? In today’s game, wherein the value of tapping into pull power and raising average launch angles has been well established, are hitters still hitting it where it’s pitched? To what extent do team’s defensive alignments correspond to how their pitchers will approach any given hitter should that hitter go with pitches? Given that pitchers who throw higher in the zone more often allow fly ball contact and those who throw lower induce more groundballs, does something similar apply for hitters given how they are pitched on a horizontal plane, i.e. inside and outside?
Here I aim simply to scratch the surface of these questions. In order to do so, Statcast data from Baseball Savant has been drawn upon. Specifically, data for all balls put into play (in play, out(s), in play, no out(s), in play, run(s)) by left-handed hitters with >500 PAs in 2021.
I selected only left-handed hitters so that the horizontal strike zone (inside versus outside) as well as field (pulled versus hit the opposite way) is uniform across all hitters. Alternatively, absolute values could have been used to accommodate both right- and left-handed hitters, but quite honestly that only occurred to me as I typed this.
In all, 39 left-handed hitters had 500+ PAs in 2021, and across those hitters, 15,754 balls were put into play. Each player had anywhere from 280+ to 500+ qualifying batted balls (you’ll be shocked to hear Joey Gallo had the fewest). Keeping things very basic, I have simply juxtaposed the field location of all batted balls and the zone locations of the pitches that corresponded to those hits.
Of all the batted balls, there appears to be a fairly weak positive association between horizontal pitch location and batted ball location. The scatterplot below illustrates that relationship.

The 0 on the X axis indicates pitches thrown right down the middle. Given these data reflect the catcher’s perspective, all pitches >0 were thrown inside to left-handed hitters. The 0 on the Y axis, meanwhile, indicates batted balls that landed/were caught directly up the middle. All batted balls with a measure >0 were hit to the right side of second base, i.e. were pulled by a LHH. Thus, the especially dark stripe just above 0 on the y-axis indicates a heightened concentration of pulled baseballs.
The correlation between horizontal pitch location and batted ball location is .220, thus reaffirming a mild, but positive, association between the two values. Of course, such a correlation says nothing about causality; inside pitches do not necessarily cause batted balls to be pulled and pitches thrown outside aren’t the explicit reason they are hit the opposite way. Still, there is some light association between these two metrics.
This is all well and good across all left-handed hitters, but to dig a bit deeper, correlations between these two metrics have been grouped by each of the 39 qualifying hitters. The table below lists those players and sorts them by individuals with the highest pitch location/batted ball location correlation.
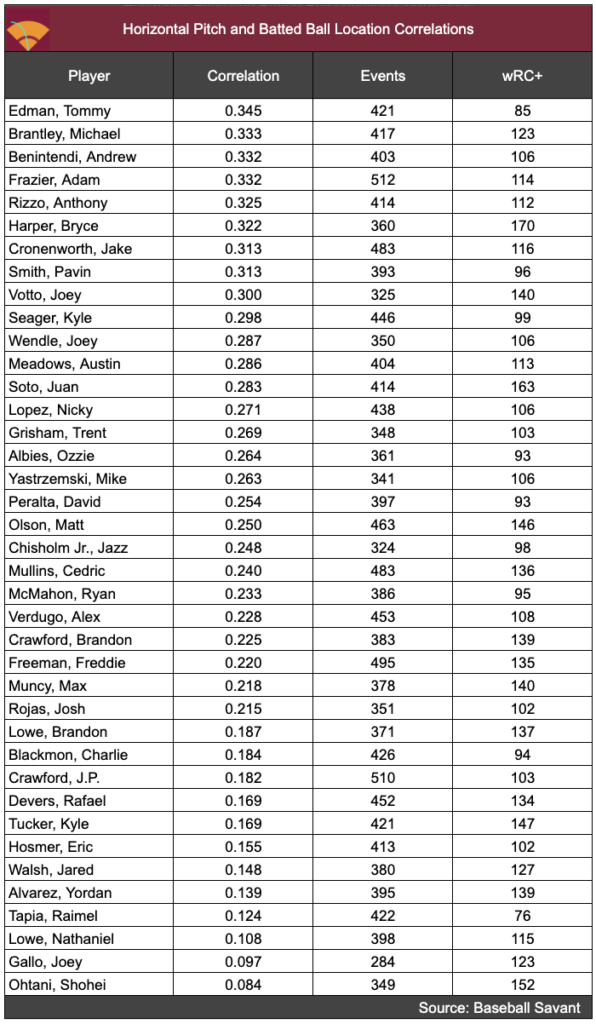
Topping the list is Tommy Edman, whose batted ball locations most positively corresponded to where he was pitched. On the other end of the spectrum was none other than Shohei Ohtani, whose batted ball direction has essentially no relationship to the horizontal location of the balls he put into play.
For those wondering about the relationship between this correlation and offensive production, as given by wRC+, there is none. That said, this 39 hitter list is a tiny sample, which also certainly features sampling bias as it often takes a highly proficient hitter to earn 500+ PAs (the average wRC+ of this group is nearly 118). Still, there are exceptional players on either end of the spectrum with the list sorted as such: players like Kyle Tucker, Yordan Alvarez, Ohtani, and Rafael Devers all sit in the bottom quartile of this list and were all exceptional 130+ wRC+ hitters. Meanwhile Bryce Harper and Joey Votto occupy the top quartile for correlation and are exceptional in their own right.
It should also be noted that not a single player listed above has a negative correlation on these two metrics. It seems as though hitters aren’t, on the whole, hitting in directions that particularly contradict the horizontal (east/west) locations they are being pitched.
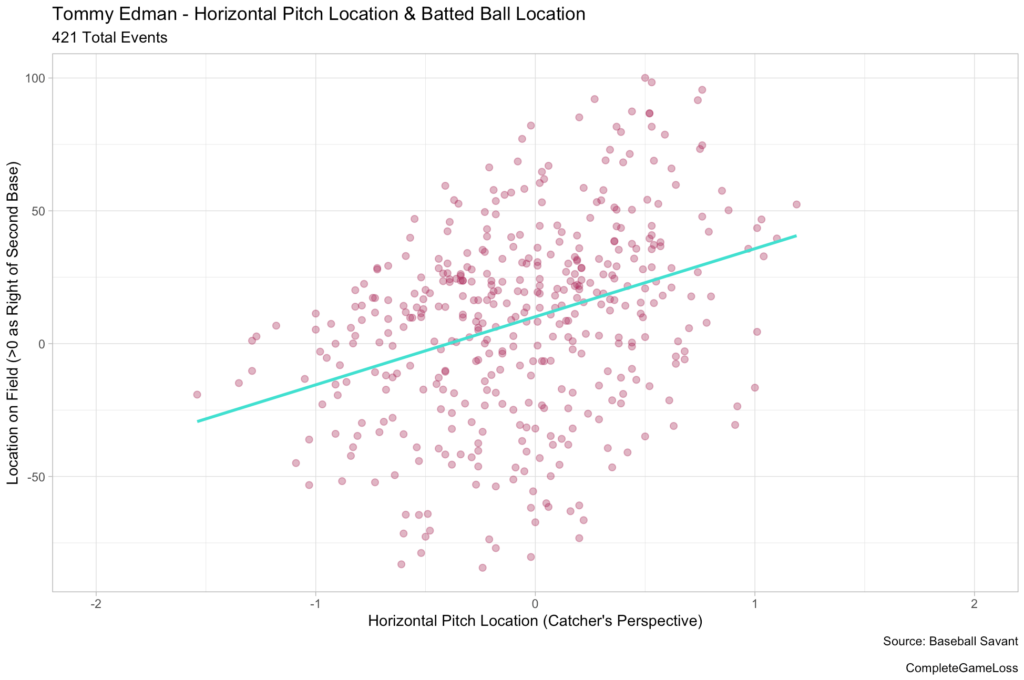
To illustrate the variations in those correlations cases above, the following scatterplots depict the relationship between pitch locations and batted ball directions for the two most “extreme” LHHs in 2021: Shohei Ohtani and Tommy Edman.
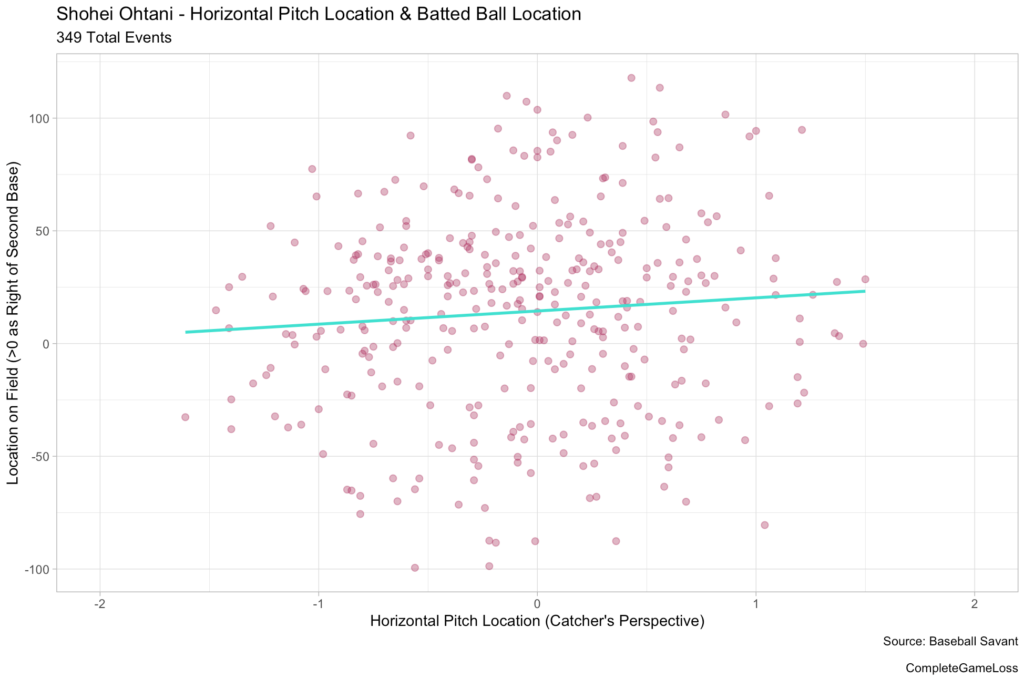
For Ohtani, there is very simply no relationship between the horizontal location of the pitches he put into play in 2021 and the direction he struck them. Anecdotally and without any evidence, it seems reasonable that Ohtani’s long levers enable him to get around pitches outside and pull them regardless of those east-west locations, but I can only speculate. There appear to be more points north of the 0 on the y-axis in any event, indicating that Ohtani is one to pull the ball more often than not (FanGraphs confirms this with a 48% pull% for Ohtani in 2021).
As for Edman, there does appear to be a clear relationship between pitch location and batted ball direction, although it is a rather weak relationship rife with instances where that wasn’t the case. Considering he was the most likely LHH to “go with the pitch” in 2021, this relationship isn’t particularly overwhelming by any means.
All in all, there does appear to be evidence that left-handed hitters in 2021 “hit the ball where it’s pitched,” but only in the most general way. Those correlations do not seem strong enough, for instance, to justify altering a shift to a batter depending on where specifically a batter might be pitched (which would show a defense’s hand anyway). More clear is the fact that, on average, hitters aren’t contradicting east-west pitch locations with their batted ball direction.
This post was originally published on my personal blog.
Love this post! It’s so fun when someone runs a chart and it backs up visual anecdata with proof. Approach matters…
Thanks for reading!
Great post, loved your idea. A lot of cool avenues to take from here, either expanding the data set by incorporating all BIP from season, or binning the variables (hard left, left, center etc.) to try to eliminate some of the noise.
Another cool path forward would be analyzing guys season to season variance, I was surprised to see Shohei Ohtanis placing on the list when he’s so well known(at least in his first couple seasons) for his all fields power, is 2021 a fluke or is he really just a master of sending the ball wherever he wants.
Agreed – there are a number of different ways this could be taken from here, and I am curious is there is any season to season relationship between these correlations or if there is simply too much noise to make any determination. Thanks for reading!
Great idea for an article!
Here’s a question: Your data only looks at batted balls in play. Do you think there is a lot of bias in terms of pitch selection in your data? How about fouls? For instance, Shohei Ohtani might take an outside pitch while Tommy Edman will swing at it, pushing it to left field.
Another variable is situational. For instance, the two strikes approach. Joey Gallo will still try to pull the ball, but Votto might not. This is something that we can see in the defensive approach: infielders often shift position depending on the count, especially with two strikes.
Does it also correlate with BB% and/or K%?
So many avenues for research!
Thank you! That’s a really interesting question; I figure that this data, by definition only including balls in play, is absolutely impacted by pitch selection/balls in play off certain pitches. At a glance, I would imagine fastball variations are put in play disproportionately often relative to how much they are thrown, which skews things some. Approach is an interesting point too. There definitely is a lot of space to space on this.