A Discrete Pitchers Study – Perfect Games & No-Hitters
I. Introduction
In the statistics driven sport of baseball, the fans who once enjoyed recording each game in their scorecard have become less accepting of what they observe and now seek to validate each observation with statistics. If the current statistics cannot support these observations, then they will seek new and authenticated statistics.
The following sections contain formulas for statistics I have not encountered, yet piqued my curiosity, regarding the 2010 Giants’ World Series starting rotation. Built around Tim Lincecum, Matt Cain, Jonathan Sanchez, and Madison Bumgarner, the 2010 Giants’ strength was indeed starting pitching. Each player was picked from the Giants farm system, three of them would throw a no-hitter (or perfecto) as a Giant, and of course they were the 2010 World Series champions. Throw in a pair of Cy Young awards (Lincecum), another championship two years later (Cain, Bumgarner, Lincecum), eight all-star appearances between them (Cain, Bumgarner, Lincecum), and this rotation is highly decorated. But were they an elite rotation?
II. Perfectos & No-No’s
It certainly seems rare to have a trio of no-hit pitchers on the same team, let alone home-grown and on the same championship team. No-hitters and perfect games factor in the tangible (a pitcher’s ability to get a batter out and the range of the defense behind him) and the intangible (the fortitude to not buckle with each accumulated out). Tim Lincecum, Matt Cain, and Jonathan Sanchez each accomplished this feat before reaching 217th career starts, but how many starts would we have expected from each pitcher to throw a no-hitter or perfect game? What is the probability of a no-hitter or perfect game for each pitcher? We definitely need to savor these rare feats. Based on the history of starting pitchers with career multiple no-hitters, it is unlikely that any of them will throw a no-hitter or perfect game again. Nevermind, it happened again for Lincecum a few days ago.
First we deduce the probability of a perfect game from the probability of 27 consecutive outs:

Table 2.1: Perfect Game Probabilities by Pitcher
|
Tim Lincecum |
Matt Cain |
Jonathan Sanchez |
Madison Bumgarner |
|
| On-Base Percentage |
.307 |
.294 |
.346 |
.291 |
| P(Perfect Game) |
1 / 19622 |
1 / 12152 |
1 / 94488 |
1 / 10874 |
| Starts until Perfect Game |
N/A |
216 |
N/A |
N/A |
The probability of a perfect game is calculated for each pitcher (above) using their exact career on-base percentage (OBP rounded to three digits) through the 2013 season. Based on these calculations, we would expect 1 in 12,152 of Matt Cains starts to be perfect. Although it didn’t take 12,152 starts to reach this plateau, he achieved his perfecto by his 216th start. For Tim Lincecum, we would expect 1 in 19,622 starts to be perfect; but starting even 800 starts in a career is very farfetched. Durable pitchers like Roger Clemens and Greg Maddux only started as many as 707 and 740 games respectively in their careers and neither threw a perfect game nor a no-hitter. No matter how elite or if Hall of Fame bound, throwing a perfect game for any starting pitcher is very unlikely and never guaranteed. However, that infinitesimal chance does exist. The probability that Jonathan Sanchez would throw a perfect game is a barely existent chance of 1 in 94,488, but he was one error away from a throwing a perfect game during his no-hitter.
The structure of a no-hitter is very similar to a perfect game with the requirement of 27 outs, but we include the possibility of bb walks and hbp hit-by-pitches (where bb+hbp≥1) randomly interspersed between these outs (with the 27th out the last occurrence of the game). We exclude the chance of an error because it is not directly attributed to any ability of the pitcher. In total, a starting pitcher will face 27+bb+hbp batters in a no-hitter. Using these guidelines, the probability of a no-hitter can be constructed into a calculable formula based on a starting pitcher’s on-base percentage, the probability of a walk, and the probability of a hit-by-pitch. Later we will see that this probability can be reduced into a simpler and more intuitive formula.
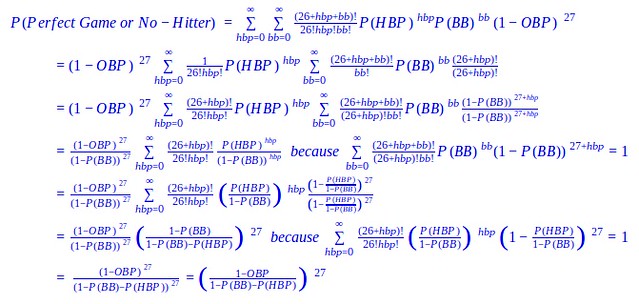
Let h, bb, hbp be random variables for hits, walks, and hit-by-pitches and let P(H), P(BB), P(HBP) be their respective probabilities for a specific starting pitcher, such that OBP = P(H) + P(BB) + P(HBP). The probability of a no-hitter or perfect game for a specific pitcher can be constructed from the following negative multinomial distribution (with proof included):

This formula easily reduces to the probability of a no-hitter by subtracting the probability of a perfect game:
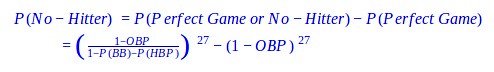
The no-hitter probability may not be immediately intuitive, but we just need to make sense of the derived formula. Let’s first deconstruct what we do know… The no-hitter or perfect game probability is built from 27 consecutive “events” similar to how the perfect game probability is built from 27 consecutive outs. These “event” and out probabilities can both broken down into a more rudimentary formulas. The out probability has the following basic derivation:

The “event” probability shares a comparable derivation that utilizes the derived out probability and the assumption that sacrifice flies are usually negligible per starting pitcher per season:

From this breakdown it becomes clear that the no-hitter (or perfect game) probability is logically constructed from 27 consecutive at bats that do not result in a hit, whose frequency we can calculate by using the batting average (BA). Recall that a walk, hit-by-pitch, or sacrifice fly does not count as an at bat, so we only need to account for hits in the no-hitter or perfect game probability. Hence, the batting average in conjunction with the on-base percentage, which does include walks and hit-by-pitches, will provide an accurate approximation of our original no-hitter probability:
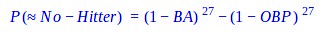
Comparing the approximate no-hitter probabilities to their respective exact no-hitter probabilities in Table 2.2, we see that these approximations are indeed in the same ball park as their exact counterparts.
Table 2.2: No-Hitter Probabilities by Pitcher
|
Tim Lincecum |
Matt Cain |
Jonathan Sanchez |
Madison Bumgarner |
|
| P(No-Hitter) |
1 / 1231 |
1 / 1055 |
1 / 1681 |
1 / 1772 |
| P(≈No-Hitter) |
1 / 1295 |
1 / 1127 |
1 / 1805 |
1 / 1883 |
| P(No-Hitter) / P(Perfect Game) |
15.9 |
11.5 |
56.2 |
6.1 |
| Starts until No-Hitter |
207, 236 |
N/A |
54 |
N/A |
The probability of a no-hitter is calculated for each pitcher (above) using their exact career on-base percentage, walk probability, and hit-by-pitch probability through the 2013 season. Notice that the likelihood of throwing a no-no is significantly greater than that of a perfecto for each pitcher. For example, Lincecum and Cain’s chances of making no-no history are far easier than being perfect by the respective factors of 15.9 and 11.5. Although Lincecum and Cain are still both unlikely to accumulate the 1,231 and 1,055 starts necessary to ascertain these no-hitter probabilities. If it’s any consolation, Lincecum already achieved his no-hitter by his 207th start (and another by his 236th start) and Cain already has a perfecto instead.
Furthermore, it’s possible for two pitchers with disparate perfect game probabilities to have very similar no-hitter probabilities, as we see with Sanchez and Bumgarner. Sanchez has a no-hitter probability of 1 in 1,681 that is 56.2 times greater than his perfect game probability, while Bumgarner’s 1 in 1,772 probability is a mere 6.1 times greater. This discrepancy can be attributed to Sanchez’ improved ability to not induce hits versus his tendency to walk batters, while Bumgarner’s improvement is of a lesser degree. Regardless, Sanchez’ early no-hitter, achieved by his 54th start, can instill hope in Bumgarner to also beat the odds and join his 2010 rotation mates in the perfect game or no-hitter’s club. Adding Bumgarner to the brotherhood would greatly support the claim that the Giants 2010 starting rotation was extraordinary. However, the odds still fall in my favor that I will not need to rewrite this section of this study due to another unexpected no-no or perfecto by Lincecum, Cain, Sanchez, or Bumgarner.
I came across this article regarding expected no-hitters recently. It’s interesting that James suggests 26 outs works better for a no-hitter, since most include some sort of out on the bases (or double play).
After reading the article, I wanted to know how likely pitchers were to throw perfect games, so I ran some numbers a while back using essentially the same formula you did. Walter Johnson came out on top with 0.149 expected perfect games. The first non-1800s pitchers were Don Sutton, Tom Seaver, and Greg Maddux.
It’s good to know I’m not alone in my curiosity!
What about errors in a No-No?
@isasson, The probability of a no-hitter that accounts for errors is [(1-OBPe)/(1-P(BB)-P(HBP)-P(E))]^27-(1-OBPe)^27. This probability is created under the following assumptions: P(E) is the probability of an error for a given pitcher and the given defense behind this pitcher, P(E) can be estimated as [(1-FP)(AB-H)/(AB+BB+HBP+SF)] where FP is the cumulative fielding percentage of the defense behind the pitcher, errors are a subset of AB, OBPe is the on-base percentage that accounts for errors such that OPBe = OBP+P(E) = P(H)+P(BB)+P(HBP)+P(E).
Sorry for the broken link in the image above. Here is the path to the image until I get the link fixed:
@StevenSilverman, It’s nice to know that both James and I deduced approximately (1-BA) as the out percentage, although I’m not sure if he realized his no-hitter probability is inclusive of the perfect game probability that should be subtracted out.
Chance of a perfect game is actually higher than presuming each event is independent. In reality, they are NOT independent.
Check my blog and forum for research on this.
@Tangotiger — But each event is independent statistically. I think the point you were trying to make on your forum was that we should account for the variability in batter performance within a lineup. Although, given the amount of variability that exists from lineup to lineup, I am not convinced that calculating and applying a generalized lineup variability will add more accuracy to the perfect game calculation. Hence, (1-OBP) should be an appropriate estimator for predicting perfect games.