Archive for July, 2016

My Ongoing Conversation In My Head About Aroldis Chapman

What ails you now, brain?

Well, I still feel icky watching the Cubs after their trade for Aroldis Chapman.

Even after watching the last few games? Chapman’s been basically as good as advertised.

Actually even more so. Looking at pictures of the team celebrating with Chapman bother me and I wonder about whether the Cubs have mortgaged their souls. There’s one of my favorite young players Addison Russell, high-fiving unrepentant “I’m only sorry because of the gun” wife-choker Aroldis Chapman.

Look, you have to look at this from a baseball perspective. This is a borderline defensible deal. On the one hand, the Cubs gave up a LOT for Chapman, but they also had less relative value of those pieces. The Cubs want to win now, and the Yankees can afford to stock up on pieces to win later. The price of high-leverage lights-out relievers is high. I might think the deal looks imbalanced, but the Cubs stockpiled prospects for this very reason.

OK, but you can’t talk about this in terms of “a baseball perspective”! Clearly the reasons this deal makes you queasy have nothing to do with just baseball. Also in terms of BASEBALL reasons, doesn’t this feel like you’re defending Billy Beane’s terrible Donaldson trade? Or the Astros’ terrible Ken Giles trade?

OK, but when it’s the bottom of the 9th in the playoffs with two men on, are you going to want Aroldis Chapman’s 105-mph fastball against your team or for your team? This is more like the Michael Bourn-Brad Lidge deal. Giving up a lot in the future for one additional piece right now.

Yeah but that also means that when the Cubs go cheering in celebration at that big win, they will be running into the arms of a man who probably choked his girlfriend and then fired a gun multiple times into his garage. Are you OK with that?

Well, you still listen to James Brown, don’t you? You still love “Ignition (Remix)” (surely far more stomach-churning in context). You still watch Woody Allen movies. You still enjoy Degas’ paintings. Can’t you separate the act from the person? Look at that helpless swing from Jose Abreu in the face of a 91-mph slider following a 105-mph fastball and tell me it’s not art!

Yes, but that doesn’t mean that you need to make choices to pursue people who have done awful things. It’s one thing if the world accrues some sort of benefit from this work. Here, only the Cubs do! I can appreciate his fastball on the Yankees, thanks. And on top of that, Aroldis Chapman’s fastball is extraordinary but he’s not somehow irreplaceable. Hector Rondon has been as good this season.

OK, but last time I checked, Mr. “I Think Criminal Defendants Shouldn’t Have Stigma Forever,” you think we should let people who have served their time reenter society, find employment, vote, and be citizens without having the stigma of “ALLEGEDLY” in front of their names for the rest of their lives. We don’t know what happened that night. Chapman was not indicted, and he served a suspension in his job. Why can’t he just be another player now? Why must his collateral consequences last forever?

Well, obviously some categories of crimes we deem worse than others, and you proclaim that crimes that reinforce the patriarchy and misogyny are worse crimes. And do we really think Chapman’s changed? His general comments on the incident are not those of a repentant person and are pretty much a non-apology apology.

OK, but Matt Bush drunkenly ran over a guy’s head with a motorcycle and he plays baseball. Jose Reyes is out there playing baseball. And if what you care about is misogyny, I’m sure that MLB is full of misogynist guys if you ask. Everyone loved Kirby Puckett! Bobby Cox was a lovable grump! And those guys all hit their wives.

That’s hardly a defense. This gets back to what I said earlier: do we need to affirmatively seek out guys with that history? And on top of that, the Cubs paid a lot for the guy! Way more than the Yankees traded back in the offseason. It implies that the Cubs do not care about his past at all. Does this mean that hitting your girlfriend depresses your employability right after it happens, but not eight months after it happens?

Yes basically! Time and penalties separate us from our past indiscretions as a society. It’s not that time somehow heals the wound, but it’s a return to normalcy.

But I don’t want players who commit domestic violence to be normalcy!

Yeah, but when it comes to a collision of your conscience and baseball, why does your conscience only worry about this aspect of Chapman? Do you expect all businesses to have these high-minded ideals? If you do, where are people who do something you think is terrible supposed to do? Go work in the landfills and live under a bridge? If anything, the economics make it easier to let prior bad acts become history. Jhonny Peralta went from PED user to good SS for the Cardinals. Baseball execs are analytical thinkers in a zero-sum world. Your gain is someone else’s loss. SOMEONE will be employing Aroldis Chapman; your moral stance does not change that.

But the Cubs were supposed to be different! They’re my team! A lovable fun team of goofballs who wear fun costumes and play fun-loving pranks on each other and definitely don’t beat their wives.

OK, one, that’s wrong. Remember Starlin Castro? You think those sexual assault allegations just went away? And he was such a lovable scamp! Sammy Sosa had accusations of spousal abuse. Mark Grace has many a DUI to his name. And second, the Cubs are not heroes. They are, as you often say, millionaire jocks in their early 20s playing a child’s game for your entertainment. Do you expect them to reflect your values?

I guess we all have to accept that our heroes are mercenaries wearing cute outfits and our beloved sports teams are just billion dollar businesses.

There, now sit back and enjoy the baseball.

BUT THAT’S EXACTLY THE THING. Baseball is supposed to be an escape. It’s pure and beautiful and keeps us from thinking about our impending deaths. I want to enjoy it guiltlessly. Why can’t it also have a conscience?

Because baseball is not apart from the world; indeed it almost always reflects the world around it. Baseball is messy and full of flawed humans and you need to accept that.

Why must we accept all those flaws, though? That’s where I think you’re wrong! We celebrate Roberto Clemente and Hank Aaron and players with hearts. We celebrate Branch Rickey for selecting Jackie Robinson because we think his conscience was right.

But he only did it because it “made good baseball sense.” Which this deal makes too. Baseball is inherently immoral. We recognize Clemente, but Kennesaw Mountain Landis and Pete Rose and Ty Cobb are all celebrated too.

OK, but your answer cannot be “not as bad as Ty Cobb” every time.

Fine but modern baseball is not much better. Should I list the terrible working conditions for minor league players? Should I get into these baseball “academies” in poor countries? Terrible stadium deals that rob the public?

Agh! I guess I’ll just feel a little gross about my Cubs this year and a little queasy about any potential playoff glory being tainted by the 50% chance that Aroldis Chapman will be the focus of the big celebration, but only slightly less gross than I should feel about baseball itself?

Yeah that’s about right.

At least I can feel good about hot dogs and apple pie right?

Yeah, about that


Shifting Against Right-Handers

Since even before the Pirates began using a shift against left-handed hitters regularly in 2013, this tactic has slowly become more and more prevalent.  In fact, it has become so prevalent that it is now a fixture in Major League Baseball.  As the shift has gotten more popular, many variations of it have been invented for different instances.  In some extreme shifts, the second baseman is placed in short right field, while the shortstop is positioned slightly to the right of second base.  Another shift places the second baseman, shortstop, and first baseman in between first and second, creating an almost impenetrable wall of three fielders on one side of the infield.  And, in some cases with certain hitters, all four infielders are placed to the right of second base.

All of these shifts have been proven to be immensely effective.  In fact, when the Pirates first began implementing it regularly when nobody else was using it that much, it gave them a jaw-dropping advantage over other teams.  Since then, every defense in the league has used it routinely — but mostly only against left-handed hitters.  There are many pull-happy right-handed hitters who have benefited immensely from not having shifts implemented against them regularly.  There is no reason why shifts should not be placed against right-handed hitters.  Of course, there are some right-handed hitters who go the other way as or more often than they pull the ball.  But there are some right-handed hitters, some of whom are very good, who could be considerably hampered by a shift.  Let’s take a look at some examples:

Robinson Chirinos:

Although Robinson Chirinos is not an impact player for the Rangers, he is a player who could have a significant amount of hits taken away from him because of the shift.  In fact, Chirinos could be one of the players who is most impacted by a shift.  He pulls the ball a shocking 62.1 percent of the time, and goes to center 24.1 percent of the time.  That means that he only goes the other way 13.8 percent of the time.  That percentage is so minimal that there should be a shift against him 100% of the time.  This shift would take away much of his production.  Actually, I invented a calculation that determines exactly how much of his production the hypothetical shift takes away.  I call this calculation “Fixed Average”, and it is very simple:  Fixed Average (FA) equals hits (H) minus by hits that would have been outs with the shift (SHIFT OUTS) divided by at bats (AB).  Or FA = (H – SHIFT OUTS)/ AB.  In this calculation, “hits that would have been outs with the shift” are grounders in between short and third that got through, or grounders up the middle that got through (the second baseman would have been playing up the middle with the shift).  However, some of the SHIFT OUTS  would still get through even with the shift.  So in that case it can be assumed that 1/4 of those hits (in between short and third and up the middle grounders) would have been hits.  And if the number of hits that would have been taken away is not divisible by four, then the calculation assumes that less than 1/4 of the discussed hits would have been stopped.

Robinson Chirinos’ regular average is .205.  Using the aforementioned Fixed Average, his average is .170.  That difference should be more than enough to convince teams to shift against right-handed hitters.

Maikel Franco:

Right now, Maikel Franco is the premier outlet of production for the Phillies.  He has hit 18 home runs so far this year, by far the most by a Phillies player.  Of course, his home runs wouldn’t be impacted by a shift, but he does have a .257 average, which would be impacted by a shift.  That average is respectable, but he pulls the ball 44.9 percent of the time and hits it to center 35.1 percent of the time.  He only hits it the other way 19.9 percent of the time.  So with a shift hampering his production, how would Franco do?

Using Fixed Average, that .257 average drops to .214.  Watch out Franco.  If a shift comes your way, you suddenly become less productive than your teammate Ryan Howard.

Brian Dozier:

Brian Dozier is a hard-hitting Twins’ second-bagger who has been a mainstay in the rapidly changing Twins organization for four years.  He has put together good power numbers while maintaining a less than desirable, but still respectable, batting average.  He has a very good amount of patience at the plate, keeping his OBP steady with his walks, but that would all change if a shift were implemented on him.  Out of all the players on this list, none pull the ball and hit it to center more than Brian Dozier.  And none hit it the other way less than him.  He pulls the ball 52.9 percent of the time and goes up the middle 34.2 percent of the time.  That means he goes the other way less than 13 percent of the time.

Right now, Brian Dozier’s average is .249.  Using Fixed Average, his average with the shift becomes .214.

Albert Pujols:

It is sad to see what a pull hitter Albert Pujols has become.  Although he was never one to go the other way with consistency, Albert always went the other way enough so that a shift would not be implemented on him.  However, since Albert joined the Angels, he has started to pull the ball with alarming regularity in order to prolong his quickly fading career.  Because of his new approach, Albert has been hitting the ball hard and often despite his climbing age.  That could change, though, if he were faced with a continuous shift.  That’s not to say he hasn’t ever encountered a shift.  He has been sporadically shifted on by opponents for the past few years.  But it’s been too little to significantly diminish his hitting.  In the absence of a continuous shift, Albert has kept on pulling.  He pulls the ball almost half the time he’s up, going to left field at a 49.2 percent clip.  He goes to center 32.2 percent of the time and hits it the other way a paltry 18.6 percent of the time.  That may not sound as significant as the other players on this list, but he still owns one of the most lopsided pull percentages in baseball.

Albert’s regular average is .249.  Utilizing Fixed Average, that average drops to a paltry .208.  Suddenly, the number-four man in the Angels’ batting order becomes an expensive waste.

Evan Longoria:

To have Evan Longoria on this list is perplexing.  He is commonly referred to as the “laser show,” because he sprays line drives all over the field.  However, it seems that the “laser show” only hits lasers to one part of the field.  Indeed, he’s been pulling for a while, although not as much as he is now.  This year, he has started to pull much more than he has in the past.  It’s been working.  His batting average, mired at or below .270 for the past few years, has suddenly jumped to .290.  It’s not as if he’s getting younger, either.  He’s almost 31 years old, just a year removed from his prime.  Therefore, it’s a weird time for him to be getting better.  There is only one dramatic change in his statistics that would explain exactly what caused his production to change.  His other-way percentage has dropped eight percentage points from last year, from 26 percent to 18 percent.

As pointed out before, Longo’s average this year is .290.  His Fixed Average is .255.  Therefore, his production would drop to even lower than it was before this year if a shift were implemented against him.

Edwin Encarnacion:

Feared stalwart of the Blue Jays batting order, Edwin Encarnacion has consistently produced 30-40 home runs a year.  Also, unlike teammate Jose Bautista, he has been known to keep a respectable average while blasting baseballs into the stands.  But there is a reason why his wRC+ hasn’t dipped below 135 since 2012.  Since that year, his other-way percentage has never climbed above 20 percent.  This year, it is at an all-time low, as he struggles to maintain production as his age and career progress.  His production would grind to a halt much quicker, and his value would drop much faster, if teams would put a shift on him.

Encarnacion’s season average is at a respectable .264, but his Fixed Average is .239.  That is a difference between a formidable All-Star and a three-true-outcome type of hitter.

Adam Duvall:

Adam Duvall burst onto the scene this year, giving the depressed Reds fans something to cheer about.  His majestic homers earned him an invite to the Home Run Derby, and his wRC+ has remained steadily above 110.  These stats are especially amazing considering his former stats in the major leagues were not good at all.  This has left people wondering, though, what the cause is for Duvall’s sudden jump.  Why has he suddenly vaulted himself into the upper echelons of baseball players?  What has he changed?  The answer is, of course, because he has started to pull the ball with consistency.  In his first few years in the bigs, Duvall went the other way 27 percent of the time with bad results.  Now, he only goes the other way approximately 18 percent of the time, and he’s experienced very good results.

Duvall’s average so far this season is just hanging onto “not horrible” at .246.  With Fixed Average, it is well into the “bad” bracket at .213.

Kris Bryant:

I saved the best (and the most surprising) for last.  Ever since he arrived at the major leagues, Kris Bryant has been pulling more and more.  His pull percentage has risen to 47.5 percent, and his other-way percentage has dropped to 18 percent.  Although he joins a list which includes the likes of Evan Longoria and Albert Pujols, Bryant would by far be the most affected by the shift.  He would be most affected because of how good he’s become.  Presently, he has a WAR above 5 and a wRC+ of approximately 150.  Many people have predicted him to win the MVP, and if he continues producing at this rate, he has a fair shot at this prestigious award.

Bryant’s average is .284, and his power is off the charts.  However, his Fixed Average for the year is .245.  Nobody with an average of .245 or below (except for pitchers) has ever won an MVP award.  Of course, his stats would still be considered respectable with a .245 average, because of his 25 home runs.  He’d also probably begin to go other way if faced with a shift regularly, so that we could assume his average wouldn’t drop to .245.  But overall, his stats would most likely not be as good as they are now.

I may have left out some right-handed hitters known for pulling, but these were the players with the most drastic pull stats.  There are many right-handed hitters who go the other way just as much as they pull, but overall the evidence is pointing towards implementing a shift against select right-handed hitters.  It would drastically change their production and the way the MLB works.  It all depends, though, on if teams are willing to use it.  It would help them immensely, but as with the shift against left-handed hitters, it will take time for teams to adopt the strategy.  But soon, as they begin to see results, it will slowly become more and more prevalent to the point where it is used almost as often as the shift against left-handed hitters.  The Fixed Average calculation is based on some assumptions utilizing each player’s play-by-play data; it is my best attempt at forecasting what would happen to each player’s production if they were to face regular shifts.  All the statistical information in this article was acquired from the games prior to July 24th.


A Proposed Methodology to Express the Value of Defense: Right Fielders

Note: this post is not by “guesto”, but rather by Carl Aridas.

***

If you have a net worth of USD $10 million, assuming nothing else, you are doing well.  As most readers of this site are either Americans or at least have a ready comprehension of the value of the American dollars, the American dollar is a readily understood value of money.  However, if the net worth of person B is Yen 10 million and person C has a net worth of HKD 10 million, what does that mean in comparison to you with a financial net worth of USD 10 million, and how can the three net worth values be compared via one more widely accepted value?

The quick answer, used by foreign exchange markets every trading day, is to use an exchange rate.  This allows Americans to equate HKD and Yen into their more familiar USD, people in Hong Kong to translate the Yen and USD amounts to HKD, and Japanese citizens to equate USD and HKD into Yen equivalents.

In baseball — yes, I recognize this is a baseball site — WAR is our exchange rate, and oWar and dWAR help translate different parts of the game into a common currency for us.  However, what if we want to equate dWAR by position into more a more traditional yardstick for some baseball fans who might prefer to see a triple-slash line rather than a dWAR value?  In researching the relative value of defense and the contract equivalent for Jason Heyward, I did just that and in so doing developed a simple methodology described below for users who prefer to use a triple-slash line.

In 2014 and 2015, Justin Heyward was worth a combined 4.8 dWAR.  With access to only games in the NY marketplace, this seemed high, and Heyward hadn’t passed my eye test for being a great defensive right fielder.  Starting with very traditional defensive metrics, I composed the following table of NL right fielders, using only their time in right field and ignoring all other positions, with the exception of dWAR:

1

Using just these defensive statistics avoids errors due to opinions of how hard a ball was hit, and also combined both range and positioning, either or both of which can be used to record putouts.  Once done, I repeated the exercise for the prior season:

2

And combining the two resulted in the following chart:

3

A quick comparison shows that Heyward is certainly the most durable right fielder in the senior circuit, and had the most putouts, and had near the most assists and led in dWAR over the two years in our study.  However, one must make an adjustment for the differences in innings played, which the next table attempts to do:

4

A quick review of the per-inning defensive metrics reveals that Heyward does indeed catch more fly balls than any other NL right fielder.  In addition, as assists are so minuscule to be almost useless (Heyward would have one more assist in 1,000 innings than Curtis Granderson), and errors even less frequent, the only source of extra defensive value assigned to right fielders is their position/range resulting in actual outs.  The next chart determines the extra number of outs over 1,267 innings of defensive value, which is the average number of innings Heyward played between 2014-15:

5

The last column above is the key – the number of extra outs per season of the fielder’s defense.  As a side note, note that Giancarlo Stanton is also an extremely strong defender, and Jeff Francoeur still had defensive value in 2014-15.  Conversely, someone needs to teach Jorge Soler what a glove is for, and at this point in their careers both Yasiel Puig and Matt Kemp will be leading the charge to bring the DH to the National League.

Below are the rather pedestrian offensive values of Jayson Heyward in 2015:

6

Less than 15 homers, only 50 extra-base hits, and only 60 RBI to go along with 79 runs scored had me convinced that the Cubs had made a rather severe overpay.  Even his .359/.439/.797 slash line failed to convince me otherwise.

However, adding the extra 43 “extra outs” computed previously as an additional 43 singles (I know readers already think that some if not most of these extra outs had to be extra bases in the gaps, but I decided to be conservative in my estimates) to Heyward’s slash line results in the following:

7

A triple-slash line is familiar to all readers, and I assume all readers recognize that is a great triple-slash line, just as USD $10 million is a lot of money.  A .429 OBP in 2015 would be fifth in baseball, ahead of Trout, McCutchen and Rizzo and behind only Harper, Votto, Cabrera and Goldschmidt.  His OPS would be sixth in baseball, behind Harper, Goldschmidt, Votto, Trout, and Cabrera but still ahead of Donaldson, Cruz, Encarnacion, Davis and Ortiz.

This analysis, of converting defensive value to traditional statistics, can be leveraged and used elsewhere.  Certainly not limited to right fielders, this same methodology can be followed to other positions, although in the infield, both assists and putouts would need to be quantified compared to just putouts as done here.  Also, since these basic defensive statistics have been kept for decades, the same analysis could be repeated using historical players.


The Yankees Made the Right Move

The New York Yankees had already announced that they were shopping star closer Aroldis Chapman, and this week it was announced that they had officially traded him to the Chicago Cubs in exchange for 19-year-old prospect Gleybar Torres, pitcher Adam Warren, outfield prospect Billy McKinney, and a fourth player to be named later. The recent hot streak the Yankees had struck had brought up questions on whether or not they were buyers or sellers, and a move of this caliber certainly appears (at least at its surface) to mean that the Yankees are announcing they are officially sellers, with more moves possibly in the works. There are also questions regarding why Torres was the primary prospect in the deal, when the Yankees already have both a good shortstop in Didi Gregorius, and impending holes at first base and right field at the start of next season. However, I believe that the Yankees shipping off Chapman was almost an intrinsic net positive for them, and here’s why:

1. The Yankees needed to prioritize Andrew Miller and Dellin Betances. One of the more intangible aspects of those two pitchers is that they don’t quite have the superstar status that Chapman does, partly due to the fact that Chapman’s 105 MPH fastball potential is exciting; it’s almost the pitching equivalent to Giancarlo Stanton’s 500-foot home-run potential. The trio of Yankees relievers are undoubtedly three of the best in the MLB: Betances, Miller, and Chapman are 3rd, 2nd, and 1st in FIP- since the start of the 2014 season, and 1st, 4th, and 7th in WPA/LI in that same time frame, respectively. Miller was an obvious keep, as he is signed through the 2018 season and for $9 million per year he is giving the Yankees terrific value. Betances will be up for arbitration this winter, so he also isn’t going anywhere either and will most likely still deliver great value. If the Yankees keep Chapman, then miss the playoffs, then keeping him was pointless unless they wanted to sign him to a long-term deal. Paying both of them also means they have less money to spend on a bat, something they will certainly need to do. Letting Chapman go makes the most sense here for sure.

2. Good teams don’t win close games, because good teams don’t play in close games. The Yankees offense has struggled immensely this year, and while the Yankees can end a game which they are winning through six innings, they forgot the most important part of that strategy: Having a lead after six innings. The Yankees’ poor offense has meant they have been in a lot of close games, and they are 2nd in the MLB with a 16-9 record in one-run games. It would be more beneficial for the Yankees to improve their rotation and their lineup though, because their bullpen can’t blow a lead if they don’t even have one. Torres and McKinney are hardly ready for the MLB yet, and obviously there are no guarantees that they will even evolve into star ballplayers. However, they can also now be used as trade chips in the future if need be, or even be used in a trade this season. Or, who knows? Maybe they’ll both become stars and will start for New York within the next five years. When the Yankees are freed of Mark Teixeira, Carlos Beltran, and CC Sabathia this offseason, they’ll have some money to spend, and now they’ll be able to spend it on having a more complete team.

3. Adam Warren is no chump. His 141 FIP- this year hardly disproves that, but his 88 FIP- in three years with the Yankees from 2013 through 2015 does. More importantly, Warren gives the Yankees innings. He has the ability to start, and he can also give more than one inning coming out of the bullpen. Obviously he’s no Aroldis Chapman, but throwing Warren out there in the 6th or 7th is hardly a risk, and ending a game with Betances/Miller is still essentially game over. If they have more offense then having Warren around to eat innings becomes more valuable than having Chapman around to save some games, but having him sit on the bench any time the Yankees don’t have a lead after six.

At this point, it is clear that the Cubs are going all-in on winning the World Series this year, and felt that Chapman was the missing piece of the puzzle. They also have confidence in Addison Russell, Ben Zobrist, and Javier Baez to secure the middle infield for the next X number of years. With the Yankees, it’s a little bit more complex, and considering every aspect of this trade is what tells us that it makes sense, and that it was the right move. The Yankees have always been known as buying their teams, and not building them, as their payroll consistently ranks among the highest in the MLB. There’s no saying they’ve completely abandoned that strategy, but at least here they find themselves selling in a very smart way. They weren’t going to benefit from potentially signing Chapman in the offseason, so instead of just losing him and his contract they figured they’d add pieces along the way. I’m not saying the Yankees have won the trade, because in my opinion you can only judge the intelligence of a trade by the information that was present when the trade was made. Considering everything we know right now, Yankees have made a very intelligent move, and it sets a precedent for more intelligent moves in the near future.


Historical Relevance of Elite Rookie Seasons

As of this writing, Tyler Naquin is running a wRC+ of 171 through 196 plate appearances. While still statistically a fairly small sample size, it’s enough to be a qualified rookie season. If the season were over today, Naquin’s 171 would be the fourth-highest for a qualified rookie ever.

Now there’s a lot of discussion about Naquin’s impending regression. Even though Naquin has always had a high BABIP profile (over .350 through minors), his current mark of .417 is clearly unsustainable. It’s also hard to see someone continuing to hit home runs at over four times the frequency he did in the minors.

I’m not going to debate what his regression might look like, or where his true-talent level might be. I am just going to look at the fact that he has had an incredible rookie season so far. Even with some significant regressions in the second half, Naquin is well set up to put up some pretty gaudy rookie numbers. So, I decided to take a look at some of the other best rookie seasons ever, and how these players fared in the rest of their careers. Since 1901, there have been 30 qualified rookie hitters (if you include Naquin) to post a wRC+ of at least 150, a mark that even with some significant regression, Naquin should have a chance to exceed.

# Name Team G PA HR R RBI SB BB% K% ISO BABIP AVG OBP SLG wOBA wRC+ BsR Off Def WAR
1 Willie McCovey Giants 52 219 13 32 38 2 10% 16% 0.302 0.379 0.354 0.429 0.656 0.467 185 0.5 24 -1.8 3.1
2 Frank Thomas White Sox 60 240 7 39 31 0 18% 23% 0.199 0.421 0.33 0.454 0.529 0.437 178 -0.5 20.7 -5.7 2.4
3 Joe Jackson – – – 177 768 8 144 100 45 9% 0.173 0.391 0.449 0.564 0.476 178 2 76.2 -3 10.2
4 Tyler Naquin Indians 63 196 12 32 29 3 9% 29% 0.313 0.417 0.324 0.387 0.636 0.426 171 0.8 17.6 -2.5 2.2
5 Bret Barberie Expos 57 162 2 16 18 0 12% 14% 0.162 0.4 0.353 0.435 0.515 0.418 169 0 12.6 1 2
6 Bernie Carbo Reds 129 470 21 54 63 10 20% 17% 0.239 0.341 0.307 0.451 0.546 0.438 168 0.6 40.5 -3.2 5.6
7 Jose Abreu White Sox 145 622 36 80 107 3 8% 21% 0.264 0.356 0.317 0.383 0.581 0.411 167 -2.9 42.7 -14.4 5.3
8 Bill Skowron Yankees 87 237 7 37 41 2 8% 8% 0.237 0.344 0.34 0.392 0.577 0.429 166 0.2 18.5 -5.6 2.1
9 Benny Kauff – – – 159 681 8 124 97 76 11% 8% 0.162 0.4 0.368 0.447 0.529 0.463 166 12.4 65.6 1.6 9.9
10 Fred Lynn Red Sox 160 656 23 108 115 10 10% 15% 0.238 0.37 0.338 0.408 0.576 0.434 166 0.2 48.3 4.8 7.9
11 Rico Carty Braves 135 507 22 72 88 1 9% 16% 0.223 0.357 0.328 0.387 0.551 0.408 164 -0.4 36.3 -9 4.9
12 Bill Salkeld Pirates 95 317 15 45 52 2 16% 5% 0.236 0.288 0.311 0.42 0.547 0.451 161 0.2 23.2 2.7 3.9
13 Yasiel Puig Dodgers 104 432 19 66 42 11 8% 23% 0.215 0.383 0.319 0.391 0.534 0.398 160 -3 26.2 -0.7 4.1
14 Buck Herzog Giants 64 213 0 38 11 16 17% 0.063 0.3 0.448 0.363 0.405 160 1.1 14 -0.2 2.5
15 Dick Allen Phillies 172 733 29 131 93 3 9% 20% 0.236 0.367 0.317 0.378 0.553 0.401 160 -0.7 48.9 1.6 8.3
16 Carlton Fisk Red Sox 147 568 24 81 67 5 9% 17% 0.239 0.32 0.292 0.363 0.531 0.401 160 0.4 34.2 11.7 7.1
17 Albert Pujols Cardinals 161 676 37 112 130 1 10% 14% 0.281 0.336 0.329 0.403 0.61 0.423 159 -1.1 50.7 0.9 7.2
18 Stan Musial Cardinals 152 585 11 95 79 7 11% 4% 0.173 0.327 0.325 0.402 0.498 0.42 158 1.1 38.6 1.7 6.1
19 Al Bumbry Orioles 119 406 7 78 34 24 8% 12% 0.163 0.375 0.338 0.398 0.501 0.403 158 0.8 27.3 -5.5 3.8
20 Mitchell Page Athletics 145 592 21 85 75 42 13% 16% 0.214 0.343 0.307 0.405 0.521 0.404 157 6.9 46.9 -6 6.2
21 Brett Lawrie Blue Jays 43 171 9 26 25 7 9% 18% 0.287 0.318 0.293 0.373 0.58 0.407 157 2.2 13.4 5.5 2.6
22 Ted Williams Red Sox 149 677 31 131 145 2 16% 10% 0.281 0.328 0.327 0.436 0.609 0.464 156 -0.4 52.7 -4.4 7.1
23 Johnny Mize Cardinals 126 469 19 76 93 1 11% 7% 0.249 0.322 0.329 0.402 0.577 0.436 156 0 33.5 -2.5 4.3
24 Ryan Braun Brewers 113 492 34 91 97 15 6% 23% 0.31 0.361 0.324 0.37 0.634 0.421 155 1.3 36.3 -26.9 2.5
25 Mike Trout Angels 179 774 35 149 99 53 10% 22% 0.226 0.358 0.306 0.379 0.532 0.389 153 15.9 63.9 15.5 11
26 Erubiel Durazo D-backs 52 185 11 31 30 1 14% 23% 0.265 0.385 0.329 0.422 0.594 0.43 151 -0.2 12.5 -1.4 1.6
27 Kal Daniels Reds 74 207 6 34 23 15 11% 15% 0.199 0.356 0.32 0.398 0.519 0.402 151 2.2 14.3 -1.8 2
28 Miguel Sano Twins 80 335 18 46 52 1 16% 36% 0.262 0.396 0.269 0.385 0.53 0.392 151 -4.8 14.8 -6.6 2
29 Mark McGwire Athletics 169 699 52 107 127 1 11% 21% 0.316 0.285 0.28 0.361 0.597 0.4 150 -0.9 44 -18.5 4.8
30 Fred Snodgrass Giants 157 579 3 81 51 44 14% 11% 0.111 0.365 0.317 0.431 0.428 0.421 150 3.3 36.6 -3.9 5.9

It’s easy to see that Naquin puts himself in some impressive company on this list. I wanted to see how likely it is for an elite rookie season to lead to a successful MLB career. Next is a list these players including their career WAR and wRC+ compared to what they did as rookies.

# Name Team G PA wRC+ WAR Career WAR Career wRC+ Seasons
1 Willie McCovey Giants 52 219 185 3.1 67.4 145 22
2 Frank Thomas White Sox 60 240 178 2.4 72 154 18
3 Joe Jackson – – – 177 768 178 10.2 60.5 165 13
4 Bret Barberie Expos 57 162 169 2 7.5 99 6
5 Bernie Carbo Reds 129 470 168 5.6 20.6 128 12
6 Jose Abreu White Sox 145 622 167 5.3 8 134 3
7 Bill Skowron Yankees 87 237 166 2.1 28.6 118 14
8 Benny Kauff – – – 159 681 166 9.9 34.1 149 8
9 Fred Lynn Red Sox 160 656 166 7.9 49.2 129 17
10 Rico Carty Braves 135 507 164 4.9 34.7 132 17
11 Bill Salkeld Pirates 95 317 161 3.9 8.7 137 6
12 Yasiel Puig Dodgers 104 432 160 4.1 11.3 134 4
13 Buck Herzog Giants 64 213 160 2.5 28.6 97 13
14 Dick Allen Phillies 172 733 160 8.3 61.3 155 15
15 Carlton Fisk Red Sox 147 568 160 7.1 68.3 117 25
16 Albert Pujols Cardinals 161 676 159 7.2 91.1 154 16
17 Stan Musial Cardinals 152 585 158 6.1 126.8 158 23
18 Al Bumbry Orioles 119 406 158 3.8 22.6 106 14
19 Mitchell Page Athletics 145 592 157 6.2 7.1 118 8
20 Brett Lawrie Blue Jays 43 171 157 2.6 9.7 100 6
21 Ted Williams Red Sox 149 677 156 7.1 130.4 188 19
22 Johnny Mize Cardinals 126 469 156 4.3 68.6 157 18
23 Ryan Braun Brewers 113 492 155 2.5 36.9 141 10
24 Mike Trout Angels 179 774 153 11 44.4 167 5
25 Erubiel Durazo Diamondbacks 52 185 151 1.6 9.2 124 7
26 Kal Daniels Reds 74 207 151 2 16.9 140 7
27 Miguel Sano Twins 80 335 151 2 2.9 132 2
28 Mark McGwire Athletics 169 699 150 4.8 66.3 157 16
29 Fred Snodgrass Giants 157 579 150 5.9 19.7 114 8

Finally, I have broken these careers down into tiers, just as a quick visual. These tiers are loosely based mostly on career WAR. I am not considering controversies surrounding these players (e.g. McGwire, Jackson), just what they accomplished at the plate.

Tier 1 – “First Ballot” Hall of Fame Talent – 5 Players

Name wRC+ WAR Career WAR Career wRC+ Seasons
Ted Williams 156 7.1 130.4 188 19
Stan Musial 158 6.1 126.8 158 23
Albert Pujols 159 7.2 91.1 154 16
Joe Jackson 178 10.2 60.5 165 13
Mike Trout 153 11 44.4 167 5

Not much to say here, you all know these names. Yes, I put Trout here already; I don’t think anyone is arguing how good a player he is at this point. Jackson was placed here because, again, I’m just looking at how good a player these players individually were.

Tier 2 – “Fringe” Hall of Fame Talent – 6 Players

Name wRC+ WAR Career WAR Career wRC+ Seasons
Willie McCovey 185 3.1 67.4 145 22
Frank Thomas 178 2.4 72 154 18
Dick Allen 160 8.3 61.3 155 15
Carlton Fisk 160 7.1 68.3 117 25
Johnny Mize 156 4.3 68.6 157 18
Mark McGwire 150 4.8 66.3 157 16

Fringe HOF was just what I named this group, based on career WAR. Obviously some of these players are much less “fringe” than others when it comes to actual voting, but regardless, all of these players had long careers of being excellent hitters.

Tier 3 – Starter Talent – 5 Players

Name wRC+ WAR Career WAR Career wRC+ Seasons
Benny Kauff 166 9.9 34.1 149 8
Fred Lynn 166 7.9 49.2 129 17
Rico Carty 164 4.9 34.7 132 17
Bill Skowron 166 2.1 28.6 118 14
Buck Herzog 160 2.5 28.6 97 13

Group of players with great, but not generally HOF-quality careers. You’ll notice here that Herzog didn’t actually maintain above-average offense throughout his career, but he was able to find success as a great defensive player.

Tier 4 – Successful MLB careers – 4 Players

Name wRC+ WAR Career WAR Career wRC+ Seasons
Bernie Carbo 168 5.6 20.6 128 12
Al Bumbry 158 3.8 22.6 106 14
Kal Daniels 151 2 16.9 140 7
Fred Snodgrass 150 5.9 19.7 114 8

The difference between a successful MLB career and a bust is extremely relative. I put the cutoff at 10 WAR, which seems to me like a mark you would expect to be able to reach after putting up one of the greatest rookie seasons ever.

Tier 5 – Relative Bust – 4 Players

Name wRC+ WAR Career WAR Career wRC+ Seasons
Erubiel Durazo 151 1.6 9.2 124 7
Mitchell Page 157 6.2 7.1 118 8
Bill Salkeld 161 3.9 8.7 137 6
Bret Barberie 169 2 7.5 99 6

None of these players lived up to what they produced in their rookie seasons. However, you do see that this is still a group with generally good offensive production throughout their careers.

Jury’s Out –  5 Players

Name wRC+ WAR Career WAR Career wRC+ Seasons
Miguel Sano 151 2 2.9 132 2
Ryan Braun 155 2.5 36.9 141 10
Brett Lawrie 157 2.6 9.7 100 6
Yasiel Puig 160 4.1 11.3 134 4
Jose Abreu 167 5.3 8 134 3

And finally, we have a few active players where it’s too early to call what class of career they are going to have.

So what does this all mean for Tyler Naquin? Well, probably not as much as an irrational Cleveland fan such as myself might hope. There is no ignoring though that there is an exceptional success rate for players who hit this well as a rookie. 75% were able to run career WAR totals over 20, and about half of those made it to 60!

Now there are going to be a lot of people who argue that Naquin’s minor-league track record might suggest that he is still likely to end up somewhere in that bottom 25% group. I don’t know how good Naquin really is, or how good he might be. I do know that he has put himself in a group with some impressive names, and I am quite excited to see how his career plays out.


Hardball Retrospective – What Might Have Been – The “Original” 1969 Reds

In “Hardball Retrospective: Evaluating Scouting and Development Outcomes for the Modern-Era Franchises”, I placed every ballplayer in the modern era (from 1901-present) on their original team. I calculated revised standings for every season based entirely on the performance of each team’s “original” players. I discuss every team’s “original” players and seasons at length along with organizational performance with respect to the Amateur Draft (or First-Year Player Draft), amateur free agent signings and other methods of player acquisition.  Season standings, WAR and Win Shares totals for the “original” teams are compared against the “actual” team results to assess each franchise’s scouting, development and general management skills.

Expanding on my research for the book, the following series of articles will reveal the teams with the biggest single-season difference in the WAR and Win Shares for the “Original” vs. “Actual” rosters for every Major League organization. “Hardball Retrospective” is available in digital format on Amazon, Barnes and Noble, GooglePlay, iTunes and KoboBooks. The paperback edition is available on Amazon, Barnes and Noble and CreateSpace. Supplemental Statistics, Charts and Graphs along with a discussion forum are offered at TuataraSoftware.com.

Don Daglow (Intellivision World Series Major League Baseball, Earl Weaver Baseball, Tony LaRussa Baseball) contributed the foreword for Hardball Retrospective. The foreword and preview of my book are accessible here.

Terminology

OWAR – Wins Above Replacement for players on “original” teams

OWS – Win Shares for players on “original” teams

OPW% – Pythagorean Won-Loss record for the “original” teams

AWAR – Wins Above Replacement for players on “actual” teams

AWS – Win Shares for players on “actual” teams

APW% – Pythagorean Won-Loss record for the “actual” teams

Assessment

The 1969 Cincinnati Reds 

OWAR: 59.0     OWS: 355     OPW%: .619     (100-62)

AWAR: 37.4      AWS: 267     APW%: .549     (89-73)

WARdiff: 21.6                        WSdiff: 88  

The “Original” 1969 Reds outdistanced the Giants by a fourteen-game margin to secure the National League pennant. Pete Rose (.348/16/82) aka “Charlie Hustle” led the NL with 120 runs scored and registered personal-bests in home runs, RBI, batting average, OBP (.428) and SLG (.512). “The Toy Cannon”, center fielder Jim Wynn swatted 33 big-flies, nabbed 23 bags and tallied 113 runs. Completing the outfield trio with 30+ Win Shares, Frank “The Judge” Robinson crushed 32 long balls and knocked in 100 baserunners while posting a .308 BA.

The Cincinnati infield, with the exception of second-sacker Tommy Helms, produced 23+ Win Shares each. Tony “Big Dog” Perez (.294/37/122) manned the hot corner while the “Big Bopper”, Lee May (.278/38/110) earned his first All-Star assignment over at first base. Leo “Mr. Automatic” Cardenas (.280/10/70) provided a steady bat at shortstop. “Little General” Johnny Bench (.293/26/90) delivered an encore to his 1968 NL Rookie of the Year campaign. The Reds’ reserves featured the fleet-footed Cesar Tovar (.288, 45 SB) and Tommy Harper (73 SB) along with seven-time Gold Glove Award-winning center fielder Curt Flood.

Bench ranked second behind Yogi Berra at catcher in the “The New Bill James Historical Baseball Abstract” top 100 player rankings. “Original” Reds teammates enumerated in the “NBJHBA” top 100 rankings include Frank Robinson (3rd-RF), Pete Rose (5th-RF), Jim Wynn (10th-CF), Tony Perez (13th-1B), Vada Pinson (18th-CF), Curt Flood (36th-CF), Lee May (47th-1B), Leo Cardenas (50th-SS), Johnny Edwards (53rd-C), Tommy Harper (56th-LF), Cookie Rojas (69th-2B), Cesar Tovar (79th-CF), Tony Gonzalez (82nd-CF) and Tommy Helms (99th-2B).

  Original 1969 Reds                                                                     Actual 1969 Reds

LINEUP POS OWAR OWS LINEUP POS AWAR AWS
Frank Robinson LF/RF 5.31 31.84 Alex Johnson LF 2.86 18.84
Jim Wynn CF 7.36 36.09 Bobby Tolan CF 4.43 26.52
Pete Rose RF 4.83 36.77 Pete Rose RF 4.83 36.77
Lee May 1B 3.31 25.11 Lee May 1B 3.31 25.11
Tommy Helms 2B -0.93 5.57 Tommy Helms 2B -0.93 5.57
Leo Cardenas SS 2.81 23.74 Woody Woodward SS 0.45 5.83
Tony Perez 3B 5.77 30.41 Tony Perez 3B 5.77 30.41
Johnny Bench C 5.69 29.93 Johnny Bench C 5.69 29.93
BENCH POS OWAR OWS BENCH POS AWAR AWS
Cesar Tovar CF 3.37 20.31 Jimmy Stewart LF -0.1 4.89
Curt Flood CF 2.14 19.71 Ted Savage LF 0.29 3.27
Tony Gonzalez CF 1.89 17.19 Pat Corrales C 0.28 2.82
Tommy Harper 3B 1.78 16.64 Chico Ruiz 2B 0.03 2.68
Art Shamsky RF 2.61 16.22 Darrel Chaney SS -1.23 1.8
Johnny Edwards C 1.94 14.95 Jim Beauchamp LF -0.06 0.99
Vada Pinson RF 0.11 10.97 Fred Whitfield 1B -0.24 0.36
Brant Alyea LF 0.62 6.52 Danny Breeden C -0.1 0.08
Joe Azcue C 0.61 6.49 Bernie Carbo -0.04 0
Don Pavletich C 0.5 4.96 Mike de la Hoz -0.01 0
Chico Ruiz 2B 0.03 2.68 Clyde Mashore -0.01 0
Cookie Rojas 2B -0.66 2.56
Vic Davalillo RF -0.21 2.26
Gus Gil 3B -0.64 1.8
Darrel Chaney SS -1.23 1.8
Len Boehmer 1B -0.91 0.58
Fred Kendall C -0.26 0.31
Bernie Carbo -0.04 0
Clyde Mashore -0.01 0

Claude Osteen (20-15, 2.66) established career-highs with 321 innings pitched, 41 starts, 16 complete games, 7 shutouts and 183 strikeouts. Mike Cuellar (23-8, 2.38) claimed the Cy Young Award and fashioned a personal-best 1.005 WHIP. Jim Maloney contributed a 12-5 mark with a 2.77 ERA as a member of the “Original” and “Actual” Cincinnati rotations. Diego Segui tallied 12 wins and 12 saves to anchor the bullpen. Wayne Granger saved 27 contests in his sophomore season for the “Actuals” and topped the Senior Circuit with 90 appearances.

  Original 1969 Reds                                                                   Actual 1969 Reds

ROTATION POS OWAR OWS ROTATION POS OWAR OWS
Claude Osteen SP 5.09 24.65 Jim Maloney SP 3.93 14.63
Mike Cuellar SP 4.91 24.57 Jim Merritt SP 0.72 10.63
Jim Maloney SP 3.93 14.63 Gary Nolan SP 1.71 7.02
Casey Cox SP 2.14 12.03 George Culver SP -0.37 3.64
Gary Nolan SP 1.71 7.02 Gerry Arrigo SP -0.29 2.99
BULLPEN POS OWAR OWS BULLPEN POS OWAR OWS
Diego Segui RP 1.38 11.3 Wayne Granger RP 1.32 14.75
Dan McGinn RP -0.04 6.86 Clay Carroll RP 1.04 10.09
Jack Baldschun RP -0.3 3.57 Pedro Ramos RP -0.6 1.6
Billy McCool RP -0.04 2.88 John Noriega RP -0.19 0
John Noriega RP -0.19 0 Camilo Pascual SW -0.31 0
Mel Queen SP 0.37 1.17 Tony Cloninger SP -2.26 2.86
Sammy Ellis SP -0.33 0 Mel Queen SP 0.37 1.17
Jose Pena RP -0.68 0 Jack Fisher SP -1.91 0.72
Al Jackson RP -0.23 0.54
Dennis Ribant RP -0.05 0.49
Jose Pena RP -0.68 0
Bill Short RP -0.26 0


Notable Transactions

Frank Robinson

December 9, 1965: Traded by the Cincinnati Reds to the Baltimore Orioles for Jack Baldschun, Milt Pappas and Dick Simpson.

Jim Wynn

November 26, 1962: Drafted by the Houston Colt .45’s from the Cincinnati Reds in the 1962 first-year draft.

Leo Cardenas

November 21, 1968: Traded by the Cincinnati Reds to the Minnesota Twins for Jim Merritt.

Cesar Tovar

December 4, 1964: Traded by the Cincinnati Reds to the Minnesota Twins for Gerry Arrigo.

Claude Osteen

September 16, 1961: Traded by the Cincinnati Reds to the Washington Senators for a player to be named later and cash. The Washington Senators sent Dave Sisler (November 28, 1961) to the Cincinnati Reds to complete the trade.

December 4, 1964: Traded by the Washington Senators with John Kennedy and $100,000 to the Los Angeles Dodgers for a player to be named later, Frank Howard, Ken McMullen, Phil Ortega and Pete Richert. The Los Angeles Dodgers sent Dick Nen (December 15, 1964) to the Washington Senators to complete the trade.

Mike Cuellar 

Before 1963 Season: Sent from the Cincinnati Reds to the Cleveland Indians in an unknown transaction.

Before 1964 Season: Obtained by Jacksonville (International) from the Cleveland Indians as part of a minor league working agreement.

Before 1964 Season: Returned to the St. Louis Cardinals by Jacksonville (International) after expiration of minor league working agreement.

June 15, 1965: Traded by the St. Louis Cardinals with Ron Taylor to the Houston Astros for Chuck Taylor and Hal Woodeshick.

December 4, 1968: Traded by the Houston Astros with Tom Johnson (minors) and Enzo Hernandez to the Baltimore Orioles for John Mason (minors) and Curt Blefary.

Honorable Mention

The 1907 Cincinnati Reds 

OWAR: 39.9     OWS: 275     OPW%: .527     (81-73)

AWAR: 30.3       AWS: 198      APW%: .431    (66-87)

WARdiff: 9.6                        WSdiff: 77

Cincinnati ended the 1907 season in a fourth-place tie with Philadelphia but finished only six games behind the front-running Cubbies. “Wahoo” Sam Crawford (.323/4/81) laced 34 doubles, 17 triples and led the circuit with 102 runs scored. Orval Overall (23-7, 1.68) flummoxed opposing batsmen, posting a 1.006 WHIP with a League-high 8 shutouts. “Long” Bob Ewing compiled 17 victories with a 1.73 ERA and a WHIP of 1.094 while completing 32 of 37 starts. Patsy Dougherty swiped 33 bags while Mike Mitchell rapped 12 three-base hits in his rookie campaign. Harry Steinfeldt drilled 25 two-baggers and Socks Seybold drove in 92 baserunners.

On Deck

What Might Have Been – The “Original” 1997 Red Sox

References and Resources

Baseball America – Executive Database

Baseball-Reference

James, Bill. The New Bill James Historical Baseball Abstract. New York, NY.: The Free Press, 2001. Print.

James, Bill, with Jim Henzler. Win Shares. Morton Grove, Ill.: STATS, 2002. Print.

Retrosheet – Transactions Database

The information used here was obtained free of charge from and is copyrighted by Retrosheet. Interested parties may contact Retrosheet at “www.retrosheet.org”.

Seamheads – Baseball Gauge

Sean Lahman Baseball Archive


Is Pitcher BABIP All Luck?

This article was originally published on Check Down Sports.

For those of you who have been reading baseball content at Check Down Sports semi-regularly, you’ve probably seen one of us talking about players and teams we think are performing at a level far from expected.

A lot of times when attempting to explain the reasoning behind abnormal pitching performance, we cite a few reasons, and then attribute the rest to good or bad luck. Luck we usually associate with a batter’s batting average on balls in play (BABIP), which is agreed upon by most as beyond the control of the pitcher.

The influx of ball-tracking systems in MLB has allowed for a boatload of new measurements that, until a few years ago, were only dreams in the minds of analysts and evaluators. One of those — the velocity of ball exiting the bat (exit velocity) — is a popular, yet informative piece of data.

Intuitively, it makes sense that the softer the ball leaves the bat, the less likely the ball should result in a hit. A pitcher who suppresses exit velocity should allow fewer batted balls to become base hits than a pitcher who gives up a high exit velocity. Yes, bloops and seeing-eye ground balls will find open space, but on average, I think this assumption makes sense.

But thanks to Statcast and baseballsavant.com, this assumption doesn’t have to be an assumption at all. We can test it out.

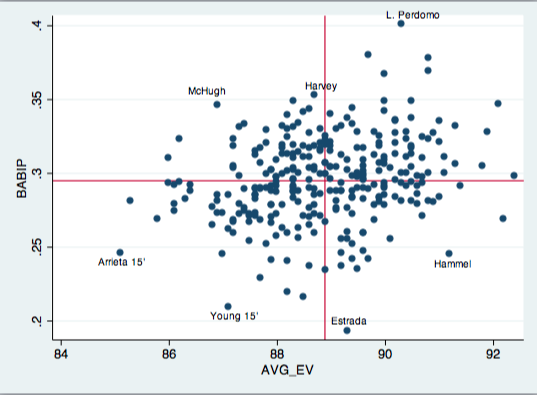
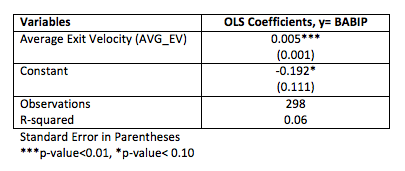
Baseball Savant has exit-velocity data since the beginning of 2015, so that’s where I started. I gathered average exit velocity against for pitchers with at least 190 batted-ball events in 2015 and 2016 (298 total). I then got the BABIP for those pitchers in those seasons from FanGraphs. Next, using STATA, I ran a simple linear regression with the two variables. Results are shown below.

Screen Shot 2016-07-14 at 12.33.28 PM

Screen Shot 2016-07-13 at 11.05.37 PM

The scary math-stuff explained:

  • A pitcher’s BABIP isn’t entirely caused by luck
  • Exit velocity has a minor, yet significant, effect on BABIP
  • 6% of a pitcher’s BABIP can be explained by exit velocity
  • If a pitcher decreases his average exit velocity by 1 mph his BABIP will decrease by 0.005 points, on average (i.e. a pitcher decreases his average exit velocity from 90 to 89 mph — his .300 BABIP would fall to .295. In turn, this would lower his ERA)
  • The bottom-left quadrant is ideal. Though, because of exit velocity’s small effect on BABIP, probably not sustainable. We’ve seen Arrieta and and Chris Young come back to earth a bit in 2016
  • The top-left quadrant includes candidates for improvement in the second half of 2016 or 2017. Pitchers here have been unlucky in terms of BABIP. Their exit velocities suggest they should have a lower BABIP, and, therefore, ERA


Playing Probability: Drew Pomeranz and Anderson Espinoza

The Drew Pomeranz-Anderson Espinoza trade has plenty of unknowns. With Pomeranz in the midst of a breakout season and blowing by his previous innings totals and Espinoza at the age when you normally would be graduating high school it is hard to know what to expect. Will Pomeranz continue to dominate or will he return to his previous self where he was either injured or mediocre? Will Espinoza blossom into the pitcher everyone sees when they watch his stuff, or will he fail to get his command under control and turn into the pitcher that his 4+ ERA in Single-A might seem to predict? To evaluate a trade like this you would have to do a lot of guesswork on the futures of these players. So instead of digging into the details it can be best to zoom out, and play the probabilities.

Predicting the futures of prospects is one of the most difficult tasks. Not only do you have to deal with the small samples of short minor-league seasons, but you have to project how those statistics will translate one, two or even three levels above their current competition. Additionally, you have to predict how the player will grow and mature as he enters his prime years. While some try to discover the answers to this question on an individual scale, it can be more effective to embrace the randomness present in each individual human being and create an average performance level for similar groups of players. To do this I tried to think of ways to quantify what makes Espinoza such a noteworthy prospect.

First, I thought that maybe the combination of age and strikeout rate that Espinoza has produced at Single-A Greenville this year might stand out and place him in a small group of notable players. A quick look at even his same team however seemed to prove this hypothesis wrong, as his teammate Roniel Raudes has almost identical statistics to Espinoza this year and is the same age. Raudes however is ranked 24th in Baseball America’s Red Sox preseason rankings, demonstrating that Espinoza’s stats this year are not anything incredibly special by themselves, even when accounting for age.

Next I examined how starters who have debuted for at least 50 innings in a year by age 21 have fared in the major leagues, since Espinoza is predicted to arrive in either his age 20 or 21 season. There are 44 pitchers that meet these qualifications and debuted between 1990 and 2005, some of which are big names (such as Hernandez, Sabathia, Greinke and Kerry Wood) while others not so much. In the time before they were scheduled to reach free agency, these players accumulated on average a total of roughly 8.2 wins above replacement of production over that span. There are some problems with this calculation, however. For one, almost a third of starters debut by age 21, so it is not terribly extraordinary. For every Felix Hernandez in this group there in a Rich Hunter who had one good minor-league season, which prompted a promotion to the big leagues. In his case, his career lasted only that one season. There are also pitchers such as Bud Smith in this group who were once top prospects but faltered in the big leagues. In his case he was once ranked first in the Cardinals’ system, a spot ahead of Albert Pujols, which can work as a friendly reminder that not all big name prospects pan out.

Another way of looking at Espinoza’s value is just to take his prospect ranking for what it is. Kevin Creagh and Steve DiMiceli have done research to try to put a trade value on prospects using Baseball America’s prospect rankings. The following table outlines their findings.

Tier Number of Players Avg. WAR Surplus Value
Pitchers #1-10 22 14.6 $69.9M
Pitchers #11-25 43 8.3 $39.0M
Pitchers #26-50 85 6.4 $29.8M
Pitchers #51-75 104 3.7 $16.5M
Pitchers #76-100 113 3.5 $15.6M


Analyzing data on Baseball America lists from 1994 to 2005, the two men created this table to calculate the average surplus value of players from each tier of the rankings. (Their process is fairly complicated, so it is worth it to take a look at their process here in an earlier version of the study). This can be a very simple yet effective way to evaluate prospects based on both their stats and scouting report (since both are used to create the rankings) while also eliminating as many individual biases as possible (of course the prospect rankings are subject to those same problems).

In Espinoza’s case, he was just recently ranked 15th on the Baseball America midseason top-100, a five-spot jump from his preseason rank (though six players ahead of him have now graduated to the big leagues). This ranking puts him in the second tier of pitchers on the BA rankings and in line to have an average surplus value of 39 million dollars with a projection of 8.3 wins. This is almost exactly the 8.2 wins calculated earlier, though found through a very different method. While these rankings are in no way perfect, it is about as close as you can get to putting a concrete value on Espinoza’s skills (especially since both methods seem to agree), so we will use the $39 million value as a benchmark to compare with Pomeranz.

Moving on to Pomeranz, it is important to find a way to factor in all the different scenarios. You might have multiple ideas about how to take into consideration both this year’s statistics and those of the past, to try to come up with some sort of middle ground. While this is the right idea, this method is going to rely on assumptions that are unlikely to be made completely accurately. Instead we can use projection systems are much better at doing these calculations for us. For Pomeranz, this is the best way to include all the information about the many aspects of his performance and boil it down to one number.

Based on the depth chart projection on FanGraphs (the average between ZiPS and Steamer weighted for projected playing time), Pomeranz is projected to be worth about 1.3 wins the rest of the way. This is considerably worse than he has been so far this year, though much better on a per-inning basis than previous years, and still a valuable player. Using this projection, you can also project out the final two years of his contract assuming that he will continue pitching up to the same standard, by just doing a little math.

With roughly 46% of the season remaining at the All-Star break, you can use his rest-of-season projection to estimate his value over a full season, which ends up being 2.8 wins. First, though, you must use the same process as in the prospect ranking analysis to discount future performance since production today is considered more valuable than years down the line. Multiplying the value of each subsequent season by 0.92 you can account for the future discount rate of 8% (used in the prospect evaluation). Performing this adjustment results in 2017 and 2018 being valued at 2.6 and 2.4 wins respectively for a total of 6.3 wins over the three years with the Red Sox. At eight million dollars per win this totals to be around $50.4 million worth of production.

Finally, we must account for surplus value by subtracting how much Pomeranz is projected to make in arbitration. This year he is only making $1.35 million, but that should see a substantial increase after an All-Star season. I have little experience projecting arbitration but it seems reasonable that he would see his contract jump up to around $6 million in 2017 and see a more modest improvement up to around $10 million after a decent but somewhat less valuable season.  These estimates would total to around $17 million going to Pomeranz from the Red Sox in the three years, and subtracting this from the $50.4 million, you end up with around $33 million in surplus value.

In the end these surplus values are very similar. Espinoza’s value comes in a little higher at $39 million compared to Pomeranz at $33 million, but the $6 million gap is nothing the Red Sox would have to lose sleep over. In reality though that gap is just the gap in average outcomes for both players and it is more likely to be much more lopsided toward one side or the other. While this seems to show that the Padres are getting a slightly better deal, you can easily rationalize this trade for the Red Sox by saying that wins today matter more now for the Red Sox than for the average team since they are in the midst of a tight wild card and division race where they are favored over the division leader in the playoff odds on both FanGraphs and Baseball Prospectus. That way of looking at it does make it much more appealing for Boston. It was a trade that they had to make given their situation. Not a great trade, not a bad trade, but an adequate trade that could turn out either way.

The real takeaway from all this however is on San Diego’s side of the deal. For them it wasn’t just an adequate deal, and it wasn’t even just a good deal. It was a great deal! For them, the pushing of wins down the road is a net gain for them as opposed to a net loss as it is for the Red Sox. They pushed Pomeranz’s average outcome of 6.3 wins (which was being wasted on an noncompetitive team) down the road to a time when they may be competitive and wins will matter much more. Not only that, but they also increased the projected output to 8.3 wins. While it is possible that Espinoza could flop and be a major bust, that is all part of the math that works in the Padres’ favor. For every underwhelming Espinoza, there is a great Espinoza; one that was acquired in exchange for a player that had little value to the club at this point in time and someone the team will get to watch for years to come.


Why Dylan Bundy Will Succeed as a Starter

(Originally written before last Sunday)

It was announced that Orioles pitcher Dylan Bundy will start this Sunday on the road against the Rays. The move makes sense — the Orioles need good starting pitching and Bundy could become a good starter. I think Bundy will do very well as a starter, and in this article I’ll talk about why.

Dylan Bundy’s career started with incredible promise. Drafted fourth overall, his first eight starts in the minors were punctuated by a 0.00 ERA and a 20/1 K/BB ratio. By the end of the year, he was considered the top prospect in all of baseball. The next few years were rife with injuries — first Tommy John surgery in 2013, followed by complications in his shoulder which caused him to miss almost the entire year in 2014. Bundy hasn’t looked like the same pitcher since. His fastball velocity this season started at 92 MPH, much lower than the high 90s we saw in the minors. But since the beginning of June, Bundy has made a remarkable turnaround. Since June 9, the numbers are beyond outstanding, with 14.1 IP, 19 SO, only 4 BBs, and 0 earned runs. But the peripheral stats are even better.

I am currently in the process of writing an article about how I think the most important skill of a starting pitcher is getting to two strikes quickly. Since June 9, Bundy has done this better than any pitcher in baseball. In the top 10: Clayton Kershaw, Max Scherzer, and Stephen Strasburg, arguably three of the best pitchers in baseball. This obviously is not to say that Bundy is one of the best pitchers in baseball; his track record is far, far too short to proclaim that. But it bodes well for Bundy that over the past month he is controlling the ball as well as baseball’s top pitchers.

Bundy’s fastball velocity is also encouraging. Bundy throws a rising four-seam fastball, which bodes well for his ability to miss bats. But at the low 90s, he wasn’t able to generate a lot of swings and misses, and as a fly-ball pitcher was susceptible to home runs. Last appearance, Bundy threw his fastball harder than he’s ever thrown it.

12917_P_FA_20160706

The chart may not look like much, but there’s a clear trend here: Up. His fastball velocity has increased over 4 MPH since the beginning of the season, which is a gigantic leap.

The Orioles desperately need starting pitching, and Bundy could be that answer. The Orioles do not have the worst starting pitching in the league. In terms of WAR, that is currently the Reds. But the Orioles’ staff is really bad, even if they look worse pitching in a hitter’s park. Chris Tillman is their only competent starter, while the rest of their rotation contain some of the worst pitchers in the league. So stretching Bundy into a starter seems appealing.

There is a risk that Bundy will be much worse as a starter. Pitchers are notorious for throwing harder in the bullpen than they would as a starter, and given that the majority of Bundy’s success has come at a higher velocity, it would be reasonable to assume Bundy will not be nearly as effective as a starter as he is as a long reliever. I think this is correct thinking; we should not expect Bundy to start and still average 11 K/9. But his numbers as a reliever have been elite, so there is a lot of room for Bundy to come down and still be a quality starting pitcher. Starting pitcher is where Bundy has the most upside, and the sooner he gains experience, the sooner we can expect him to improve.

Bundy will probably do well this Sunday, especially against a Rays team that strikes out the second-most in the league. Don’t think this is a mirage. Bundy has the stuff and command to succeed, and I think we will see that as a starter.


The WIS Corollary

Interestingly enough, one of the major postwar genres of Anglo-American literature was the academic comedy. Popularized in large part by Philip Larkin and the “Movement,” authors strove to poke fun at academic institutions and the conventions followed by the terrifically aloof professors. The most famous novel to fall into this genre is Lucky Jim by Kingsley Amis. The book features Jim Dixon, a poverty-stricken pseudo-pedant with a probationary position in the history department of a provincial university. A veritable alcoholic, Dixon attempts to solidify his position by penning a hopelessly yawn-inducing piece entitled “The Economic Influence of the Developments in Shipbuilding Techniques, 1450 to 1485.” Short novel made shorter, it doesn’t help him retain his position, but it does succeed in illustrating the banal formalities that academic writing necessitates.

In sabermetrics, there is a heavy reliance on sometimes inscrutable jargon, acronyms that sound like baby words (“FIP!”), and Mike Trout’s historical comps (Chappie Snodgrass is not a very good one in case anyone is wondering) that quite understandably renders the average fan mildly frustrated and the average fan over sixty wondering how we will ever make baseball great again. Typically, I enjoy those articles very much because they communicate news efficiently and analytically. Occasionally, however, articles stray into the Jim Dixon range of absolute obscurity, examining the baseball equivalent of “Shipbuilding Techniques,” whatever that may be. Such writings form the cornerstone of sabermetrics as they mesh history, theory, and sometimes economics.

Fortunately or unfortunately, my article today isn’t quite Dixon-esque, but it retains some of that style’s more tedious elements. It falls more closely into the category of two-minute ESPN quick sabermetric theory update. I don’t think that’s a thing. Seemingly pointless introduction aside, please consider what you know about DIPS theory. I won’t insult your intelligence, but it was developed by Voros McCracken at the turn of the millennium and has served as one of the principal tenets of the pitching side of sabermetrics ever since then. The theory, in its most atomic form, essentially posits that pitchers should be evaluated independently of defense because it’s something they cannot control. Hence “defense-independent pitching statistics.”

Certainly, it was a revolutionary concept and one that has even gained quite a bit of traction in the mainstream sports media. Announcers talk about how a certain pitcher would look a lot better pitching in front of, say, the Giants instead of the Twins. Metrics like xFIP only serve to quantify that idea.

But every grand theory or doctrine (DIPS is essentially sabermetric doctrine at this point) requires a corollary to frame it. And so I propose something I like to call the “WIS Corollary to DIPS,” where WIS stands for Weather Independent Statistics. The natural extension of evaluating pitcher performance independently of defense is to evaluate players independently of weather because it also exists outside of player control.

The basic idea of this is that weather plays enough of a role in enough games to superficially alter the statistics of players such that they cannot be accurately and precisely compared with the other players in the league because all of them face different environmental conditions. Taking that into consideration, all efforts must be made to strip out the effects of weather when making serious player comparisons. Coors Field is why Colorado performances are regarded with such skepticism, while the nature of San Francisco weather and AT&T Park is supposedly why that location serves as an apt environment for the development of pitchers.

Think about it — it’s something we already do. We look at home/road splits, we evaluate park factors, we try and put players on +/- scales. We talk about this constantly even at youth games. I have heard parents say many times, “If only the wind hadn’t been blowing in so hard he might have hit the fence.” It’s honestly a commonly held, yet generally unquantified, notion that the general public has.

Player X hits a blooper at Stadium C that falls in front of the left fielder for a hit. Player Y hits a blooper at Stadium D with the exact same exit velocity and launch angle as Player X’s ball, but it carries into the glove of an expectant left fielder. Should Player X really get credit for a hit and Player Y for an out? Basically all statistics, striving to communicate objective information, would say yes. If this kind of thing happens enough times over the course of a season, it can make a significant difference. A couple of fly balls that leave the park instead of being caught at the fence would put a dent in a pitcher’s ERA, while changing a player’s wRC+ by no small sum.

For that reason, players should be measured as if they play in a vacuum. One of the biggest goals of sabermetrics is to isolate player performance in order to evaluate him independently of variables he cannot necessarily control. Certainly, this has some far-reaching consequences if the idea gets carried out to its natural conclusion. Someone would likely end up developing a model that standardized stadium size, defensive alignment for varied player types, and other things of that nature. I’m not necessarily advocating for that, just for stripping out the effects of weather.

WIS by itself isn’t radical, but the extent to which it’s applied could be considered as such. As of now, it’s something consciously applied a relatively small portion of the time, but I think that it’s something that should be considered as much as possible. Obviously, there are issues with this. You can’t very well modify “raw” statistics like batting average or ERA so that they reflect play in a vacuum. What you could conceivably do is create a rather complicated model that requires a complicated explanation in order to describe how the players should have performed. And that’s something which brings us to an important point; the metrics that would employ this information would not be for the average fan; rather, they would be aimed at the serious analyst.

This is something I’ve already tried to employ with a metric I created called xHR, which uses the launch angle and exit velocity of batted balls to retroactively predict the number of home runs a player should have hit. The metric is still in development, but I think it’s something that works relatively well and can be applied to other types of metrics. For instance, an incredibly complex and comprehensive expected batting average could utilize Statcast information to determine whether a given fly ball would have been a hit in a vacuum based on fielder routes and the physics of the hit. By no means am I trying to assert that I have all, if any, of the answers. The only thing I’m trying to do here is to bring debate to a small corner of the internet regarding the proper way to evaluate baseball players.

Probably the most crucial thing to understand here is that the point of sabermetrics is to accurately and precisely evaluate players in the best possible way. Sabermetricians already do an incredible job of doing just that, but perhaps it’s time to take things a step further in the evaluation process by developing metrics that put performances in a vacuum. I know that baseball doesn’t happen in a void, but the best possible way to compare players is to measure them* as if they do.

WIS Corollary — One must strip out the effects of weather on players in order to have the most accurate and precise comparison between them.

*Oftentimes it’s necessary to compare players while including uncontrollable factors, like sequencing, especially when doing historical comparisons. It’s important to note that the WIS Corollary is applicable only in very specialized situations, and would generally go unused.