Archive for April, 2016

What Is Wrong With Adam Wainwright?

Adam Wainwright is the star of the St. Louis Cardinals pitching staff and one of the best aces in the majors. The righty has 121 wins, a 3.04 career ERA, 1,335 strikeouts and four top-three Cy Young finishes under his belt. In 2015 he started as expected, cruising. In four starts he managed to post a 1.44 ERA and a 2.05 FIP in 25 innings with 18 strikeouts and just one walk, with eight extra-base hits (35% of the hits allowed). When everything was looking promising for another dominant season, he suffered a ruptured Achilles tendon during a plate appearance against the Milwaukee Brewers on April 25th. This injury sent him to the disabled list until late September where he just got the chance to pitch another three innings.

Before the start of this season his name was part of lots of baseball discussions: Which Adam Wainwright should we expect? The ace? Or will he show declining signs due to the long ride on the DL, his 34 years and 500+ innings in the last two seasons? The numbers speak by themselves: A 7.25 ERA, 4.87 FIP in 22.1 innings with just nine strikeouts and 10 walks, with 13 extra-base hits (45% of the hits allowed). A complete disaster if we compare this start with last April.

Those facts led us to the question: What is wrong with Adam Wainwright? Using the data sample of April 2015 and 2016 we will try to figure out the reasons behind this horrible start of the season and what should be the changes that could help Waino get back on track.

Pitch velocity and movement

The first reason that jumped to my mind was that he may be having trouble with the speed of the fastball or break of his nasty curveball. I went to Brook Baseball to check this values and compare April’15 with April’16.

Picture

​Using the four starts of last year, Waino’s fast pitches were the four-seamer, the sinker and the cutter, averaging 90.3 MPH, 90.4 MPH and 86.4 MPH respectively. Contrary to my first hypothesis, the speed chart on 2016’s April did not show any significant variance averaging 90.8 MPH, 90.3 MPH and 87.1 MPH. If anything, he is throwing faster. What about the breaking stuff? During 2015 the nasty curveball and the changeup average were 75.4 MPH and 83.7 MPH, values that are really similar to what we have seen this year: 75.4 MPH and 83.5 MPH.

We can conclude with this data that the speed is not an issue, but what do the numbers say about the ball’s movement? All his pitches were showing very similar vertical and horizontal movement compared to last year data and the career normal of Adam Wainwright. These means that the first hypothesis has to be dismissed, the power on his fast pitches and the break on the slow ones is still there.

Location and control

Other potential cause of the bad start of the season could be the location of Adam’s pitches and his control of them. A good way to visually understand the location of his pitches is using a heat map over the K-Zone. The darker the color, the biggest the frequency. To generate the great graphs that you can see below I used the PITCHf/x tool from Baseball Savant, posting side-by-side the career, 2015 and 2016 values.

Picture

The heat maps really help to get quick answers. Let’s start with the four-seamer. We can clearly see that during this season the dark cluster is located up in the zone. Compared to his career profile Wainwright is locating the fastball higher than his typical zone, something that is not a good sign for a pitcher that only throws it at 90 MPH and depends so much on control to minimize damage.

Picture

The case of the cutter is similar: low control of the pitch. 2016 graph shows a problem locating this pitch in the strike zone. The career profile indicates that he likes to throw this pitch down and outside for RHB and down and in for LHB, something that have been difficult this season when the cutter is also falling higher that normal.

Picture

Picture

In the case of the sinker I split the heat maps between lefties and righties since this specific pitch is used very differently by Waino depending on the batter handedness. Against lefties the heat maps show that he is following his typical profile, so there should not be a problem.  Meanwhile against righties Wainwright has been having troubles locating this pitch outside in the zone as he is used to. This year, lot of the sinkers against righties has been located in the center of the plate many times, low in the zone, but still in an area that MLB batters can crush easily.

Picture

Exactly the same thing happens when we see the curveball graphs. Career data showed that he has been really successful hitting the low part of the strike zone, especially last year when this pitch was falling in the ideal place, just below the K-zone frame. But this year the story have changed. The curveballs has been located higher than ever, in the hitter power zone.

There is no doubt that Wainwright in this season is having a hard time controlling his pitches, especially falling up in the zone with the fast ones and right in the middle with the breaking ones. He is showing significant differences with his career profile that could be a direct cause of the bad start of 2016.

Pitch mix

The speed and break are still there. The location not so much. So what about the approach to the at-bats? Is it similar or has he changed it due to the lack of control of his pitches? Let’s try to answer this question using data of his pitch mix and the results of balls in play comparing Wainwright’s career profile with the 2016 sample data.

As you can see in the table below, two things needs to be addressed: First, this season he largely ditched his sinker (-9%) in favor of more cutters (+8%) and curves (+4%). Second, the ground balls have dropped dramatically (-10%), leading to an increase in fly balls (+9%) and line drives (+1%). Why such a change in Waino’s approach to the plate?

Picture

There are quick conclusions. The sinker is an excellent groundball pitch, so obviously if you use less sinkers, you get less groundballs. But as we saw in the previous section of the article, Wainwright is having tons of problems with the location of his sinker: the majority of this pitches stay on the hitter-friendly zone, resulting in an increase of the line-drive percentage (+17%) and a .500 batting average on balls in play.

As if it were not enough with the sinker issues, the high location of his four-seamer is causing 18% more fly balls and 24% less ground balls. This critical situation left just one option of the fast-pitch arsenal of Wainwright: the cutter. As his last resource he increased the use of it 8% and some results have been good. It’s the only one that has an increase in ground-ball percentage (+4%) and a drop in fly-ball percentage (-12%). Nevertheless the resulting average of balls in play is .400, so please don’t take this as a silver bullet. Remember that we also pointed out previously that the control on the cutter has not been the best.

The other pitch that has been favored this season is the curveball. Although the rate of whiffs has dropped from a career average of 17% to only 9% and the fly balls (+11%) have increased significantly, the opponents only average .118 against the curve. This is really impressive especially after we analyzed the bad location of this pitch, but he keeps using it since it is the only pitch that is giving good results.

Conclusion

Even with a small sample of 2016 data we can derive some conclusions: The arm power and the movement on Adam Wainwright’s five pitches is still there. The long rest due the injury, the 500+ innings from 2013 to 2015 and his 34 years do not seem to be a problem right now. The problem seems to be in the location of his pitches. The four-seamer high in the zone and the sinker in the middle of the plate have been destroyed by the batters, reducing the ground balls in a dramatic way and increasing the line drives and fly balls.

Wainwright is clearly trying to make adjustments in order to reduce the damage. For now his nasty curve is saving the day being his only effective pitch even when it has been located in a dangerous zone. The cutter is not helping enough so his focus should be in taking back the control of the location of the pitches. In his last outing he showed some positive signs. Let’s see what happens in the next one against Arizona — if we get more of the ace or if he still struggles to get back to track.
Is Freddie Freeman Broken?

The Braves’ offense is terrible.  Absolutely putrid.  Jeff Sullivan already covered that here.  If the offense has been historically bad, odds are the best player in that lineup is performing below expectations as well.  Sure enough, that is the case with the 2016 Atlanta Braves and Freddie Freeman.  Look at any stat you want and they all tell the same story.  Sabermetrically inclined?  His wRC+ (as of when this was written) is down 65 points from his career average, with his ISO down a whopping 107 points.  Prefer the more traditional numbers? He’s batting .203 with three extra-base hits in 82 PAs.  Regardless of how you want to measure them, the results have been bad, but the real question is, what is driving the poor results?

The tempting answer is bad luck.  His BABIP is down, he’s faced several of the game’s toughest lefties and it is only April after all.  Another easy explanation is lack of protection around him. Why would pitchers throw Freeman anything he can hit when he is the only one in the lineup that can punish them?  Oh wait, his Zone% is UP and he has seen more fastballs than last year? Hmm.

This leads to questions about his health — is Freddie Freeman still battling the wrist issue that plagued him last season?  He said it was fine headed into spring training but then felt some discomfort in mid-March before calling it a false-alarm.  Maybe the wrist is still a problem for Freeman — either directly with discomfort or indirectly through altered mechanics stemming from the injury — but regardless, it is my opinion Freddie Freeman is broken.

Even this early in the season, there are data indicators to watch.  Swing%, Contact% and (in my opinion) exit velocity are all useful to an extent over small samples.

O-Swing% Z-Swing% Swing% O-Contact% Z-Contact% Contact% Avg. Exit Velocity
Freeman 2015 29.1% 75.6% 49.5% 66.6% 82.4% 77.2% 91.2
Freeman 2016 23.7% 73.9% 47.2% 63.4% 77.0% 73.4% 88.1

Swing% is down across the board, with a marked drop in O-Swing% which is actually a good indicator most times.  The real concerns lie in the decreases in Z-Contact%, Contact% and Avg. Exit Velocity.  A large drop in Contact% accompanied by a large drop in exit velocity and ISO is a recipe for disaster — typically players trade Contact% for an increase in power.  A decrease in contact and exit velocity points to a bat-speed issue, and Freeman himself believes that to be the case telling the reporters earlier this season that “My bat speed is just not there.  I don’t know if I’m tensing my shoulders and I’ve got to get loose; that’s what I was just working on.” I agree with his assessment, the bat speed has not been there.  Freeman has made in-play contact on just eight of his 39 swings against pitches with a perceived velocity of at least 93 MPH according to Baseball Savant.  This is down compared to 66 of 194 in 2015 (the only other year with data, when he was still battling the wrist issue).  His production on fastballs in general is down as well, with a negative wFB/C mark for the first time since his debut in 2010.

The reduced bat speed also shows up in his spray chart.  Freeman’s percentage of balls hit up the middle or pulled have both decreased, leading to an increase in his Opp% of over 10%.  This increase in opposite-field hitting alone is not crippling, but combined with an unbelievable decrease in production on these balls in play — 2015 wRC+ of 180 to the opposite field, wRC+ of 31 so far in 2016 — it creates a major problem.

Clearly, the Braves and Freeman are focused on adjustments at this point, but if the struggles continue much longer it will be hard to silence questions about the health of his wrist.  Credit Freeman for working on a solution, but if he and hitting coach Kevin Seitzer cannot figure out a way to get him back to normal (or if he misses extended time due to reemergence of the wrist issue), then the Braves’ offense from the first 20 games may not improve much after all.  That is a possibility that could lead to a terrible, long and historic season in Atlanta.


Waiting On an Ace: Jimmy Nelson

I love pitching prospects. Not that I can back this statement up, but I believe pitchers make a more immediate impact on a fantasy roster than hitters. So, each year I stack my “Watch List” with young pitchers that might get called up in September, have a good shot of getting called up in June and potential breakout sleepers. Four years ago, one such player was Jimmy Nelson. How could a man that stands 6-6 at 245 lbs. not be on the radar? I watched with eager anticipation at all those strikeouts. That was four years ago and not much has changed. Both the Brewers and I seem to be in the same boat — waiting on Jimmy Nelson.

At one point, Nelson was the number one prospect in the Brewers’ organization. His fastball and slider were scouted as plus pitches and as such, Nelson was touted as a middle-of-the-order pitcher with potential to move up with the development of a third pitch. He was drafted in the 2nd round, 64th overall and is still just 26 years old. His aforementioned size gives him the frame to tax his arm with 200-plus innings each year. Plainly put, Nelson has the pedigree to be a stud and clearly the Brewers thought so too. Why then are we waiting three years into Nelson’s MLB career?

About 16 months ago, Mike Newman wrote about Nelson’s rising stock. That was prior to a year when Nelson had somewhat of a breakout campaign, going 11-13 with a 4.11 ERA and a 19.7 K%. If you recall he seemed to put things together in July to the point of striking out 32 in 33 IP with a sizzling 1.61 ERA. That’s when everyone jumped on board and expected big things in my fantasy league (10-team mix league, five keepers, deep rosters, 12 years running). July ended, however, and Nelson fizzled with the fading temperatures in 2015. His stock was mixed heading into this year (ADP 211, Yahoo!). It’s a new year now and the temps are starting to rise again. Will Nelson resurface as the potential ace he showed last July?

Last year Jimmy Nelson introduced a curveball to his arsenal, and it was good. The story on Nelson is that he always lacked confidence in his third pitch, the changeup. In the early going Nelson rarely threw that pitch. In order to get lefties out and develop into an ace Nelson needed a third pitch he was not only confident in but that could develop into a plus pitch. Maybe the curve was just what the doctor ordered. His pitch distribution looks like this.

In 2015, Nelson offered his newly-found curve 21% of the time while keeping his plus slider around (17%). 2016 seems to be a different story to this point. Nelson is throwing his fastball much more often and his off-speed pitches less, basically ditching the change all together. This has had two results: hitters are swinging less and making more contact. Z-contact% is creeping up to scary levels (93%).

Worse, so far, hitters are being patient with Nelson. It seems when Nelson goes outside the zone, hitters are laying off.

To summarize, hitters are swinging less at pitches, both inside and outside the zone, and making more contact, both inside and outside the zone, than ever before against Nelson. This is not a good sign. Dating back to Nelson’s early days, he has displayed control issues. What happens when hitters become patient against a pitcher with historic control issues? His walk rate increases.

Jimmy Nelson is progressing in the wrong direction. Hitters have adjusted to his curve and slider, they are being more patient, and they are making more contact. While Nelson’s K% has not dropped dramatically, his BB% is trending in the wrong direction. As a result his K-BB% is at an all-time high (in both the major and minor leagues).

I have something to confess. Prior to researching Jimmy Nelson I attempted to trade him in my fantasy league. To multiple teams. Multiple times. Here were my selling points: Pedigree, development of a third pitch and progression. So far this year Nelson has a 3.46 ERA, a 3-1 record, and he is still striking guys out at 17.9%. On the surface it looks like he is pitching to more contact and inducing weaker contact when he does; his 24.7% soft-contact rate is up from 19.2% last year.

One could be optimistic about this. I am not, however. His ERA is being supported by a .225 BABIP and a crazy 90% strand rate. Worse, pitching to contact is not a good strategy when fly-ball percentage is also trending in the wrong direction; up to 35% from 29% last year.

To wrap this lengthy post up I have several concerns with Jimmy Nelson. He’s always been known for having control issues and it seems he has not improved that yet. He’s developed a third pitch but is refusing to throw his plus slider and curveball more often. He’s inducing more contact but that contact is in the air. I am not searching for a way to “fix” Jimmy Nelson. His velocity seems to be consistent, perhaps just a tick down. His mechanics seem fine. There are no injuries to report. Rather, this post is about waiting on the ace that the Brewers thought they had. If that ace is going to emerge, Nelson is going to have trust in his slider and curve as he did in July of 2015. He’s going to have to find a way to induce more swings outside the zone. As it stands now, he is living dangerously inside the zone and will eventually run into major problems when those stranded runners come around to score as his BABIP rises. As deep as our fantasy league is, he still might be able to be moved. More than likely, however, he’ll remain what he has been — a middle- to back-end-of-the-rotation arm both in fantasy and real baseball.


The New Ace of the Seattle Mariners?

After being taken in the first supplemental round of the 2010 MLB Draft, Taijuan Walker quickly established himself as a legitimate prospect due to his unique athleticism and his big-time fastball, which led to high strikeout totals in the low minors. He first appeared in Baseball America’s Top 100 list in 2012 at #20 as a 19-year-old, and at #18 in the 2013 list. Jonathan Mayo of MLB.com had Walker ranked as the #4(!?) overall prospect in both 2012 and 2013. But there always seemed to be questions regarding command issues and whether he would fully develop three pitches.

After a few cups of coffee in the Majors, three starts in 2013 and five starts in 2014, Walker broke camp in the starting rotation for the 2015 season. However, things were anything but successful to begin the season. In his first nine starts, the command issues that were a question while he was a prospect were alive in full force. He only made it through six innings in two of those first nine starts, and had 23 walks in 43 innings. He was running an ERA of 7.33 and an FIP of 5.48. Then, on May 29th 2015, something clicked, as he went eight shutout innings, with two hits, no walks, and eight strikeouts. Ever since, Walker has been a very good starting pitcher, as you can see in the below table comparing before and after May 29th 2015.

GS Innings K BB K-BB% ERA FIP
First 9 starts of 2015 9 43 39 23 7.7% 7.33 5.48
Since 5/29/2015 24 151.2 143 20 20.6% 3.26 3.34

Look at that K-BB%! A 20% K-BB% puts him in some pretty elite company. Here’s the complete list of qualified SP that have a K-BB% greater than 20% since the beginning of 2015:

Name K-BB%
Clayton Kershaw 28.6%
Chris Sale 26.5%
Max Scherzer 25.7%
Carlos Carrasco 23.1%
Corey Kluber 22.5%
Madison Bumgarner 22.3%
Jacob deGrom 22.1%
Chris Archer 21.6%
Jake Arrieta 21.3%
David Price 20.7%
Michael Pineda 20.4%

Not a bad group to be in! Ten guys that we think of as being aces, or near aces, and then Michael Pineda, a solid pitcher in his own right. It’s clear that limiting bases on balls has been key for Walker, and has probably been the main reason why he has improved so much. But why has he gone from walking over four batters per nine innings to around one batter per nine innings? From what I can gather, it looks like Walker tried to focus on two things: getting ahead in the count, and using his off-speed pitches more than he had been doing. In regards to the first point, as Eno Sarris wrote in June of 2015, Walker decreased the usage of his cutter, instead relying more on his fastball, which led to a significant increase in first-strike percentage. Since that start on May 29th 2015, Walker has a 71% first-strike percentage when he throws his fastball in a 0-0 count, and has been pounding the zone with his fastball no matter what the count is. Information from Brooks Baseball:

Fastball since 5/29/2015

Count Ball Strike Swing Foul Whiff BIP
0-0 32.74% 43.05% 28.48% 13.90% 5.61% 9.19%
Any 29.40% 30.78% 48.79% 21.55% 9.95% 17.55%

Now for the second point, take a look at this article from the Seattle Times in early June 2015. Walker talks about how he was not comfortable with his old curveball, so he changed the grip to a similar one used by Felix Hernandez, and in addition, that he learned to throw a changeup. If we take a look at his pitch mix from before and after that May 29th start, there is definitely a change in his arsenal. He has increased the usage of his curveball and changeup, suggesting that he has finally gained confidence in his off-speed pitches. Information from Brooks Baseball, but what they are calling a splitter I believe to be his changeup.

Pitch Type After 5/29/15 Before 5/29/15 Change
Fourseam 60.89% 65.90% -5.01%
Split 19.10% 16.92% 2.18%
Curve 10.09% 5.51% 4.58%
Cutter 7.62% 11.41% -3.79%
Sinker 2.31% 0.13% 2.18%

To get to the point of the title of this article, has Walker now become the best pitcher in Seattle’s rotation? The truth is that he has pitched like it since that start on 5/29/15. Using the same stats from earlier, here is how he has performed compared to Felix Hernandez over that time frame:

SINCE MAY 29, 2015

GS Innings K BB K-BB% ERA FIP
Taijuan Walker 24 151.2 143 20 20.6% 3.26 3.34
Felix Hernandez 25 156 144 58 12.9% 3.98 4.01

Looking at this table, I don’t know if I should be more excited about Walker, or more worried about the King. That being said, you can’t help but be impressed by what Walker has done over his last 24 starts. While the Mariners have the longest playoff drought in all of baseball, and have put together some pretty terrible and/or under-performing teams as of late, a bona fide ace is the one thing that they have had almost since when Felix made his debut in 2005. Walker is not currently a top-15 pitcher, and may never develop into that, but it is clear that at just 23 years old he is becoming a top-of-the-rotation type of pitcher. At a time when it appears that King Felix has entered into a decline phase, the Mariners may have found someone to front their rotation for years to come.


The Case For Jake Arrieta as the Most Dominant Pitcher of All Time

C.R.A.P.  It’s a fairly modern affliction that affects a great deal of people like you and me — and by ‘you and me’ I mean internet users.  It’s clear that the internet, like all of mankind’s greatest achievements, is not without drawbacks.  Never before have we been so connected, and never before have we heard the terms: Athazagoraphobia (Fear of missing out), ‘Paradox of Choice’, and ‘Intellectual Technologies’ (just Google it — because I can’t remember what it means).  The level of connectedness is so intense that on a day-to-day basis, I feel like I meet people whose personalities are plagiarized patchworks of charismatic, yet ill-informed internet voices (myself included).  And then, of course, there’s C.R.A.P., which stands for Combative Responses to Antipodal Posts.  An amusing component of C.R.A.P. is the ferocity with which contrary opinions are met with online; I have experienced 30 years of life and not once have I heard strangers communicate with each other in the manner that they do in the comments section of baseball blog posts on the internet.

To be clear, I’m not completely condemning the common vernacular found in said comments sections, because debate and conversation simply happen differently when we’re responding to a pun that’s a screen name rather than a face with eyes.  On Thursday, the 21st of April, Jeff Sullivan wrote a piece titled, The Case for Noah Syndergaard as Baseball’s Best Pitcher, and the comments section is littered with people who suffer from C.R.A.P.  In my opinion, if you actually read the article, you’d be able to tell that Jeff isn’t declaring Syndergaard the best pitcher, but based on his stuff and recent results, there’s definitely a case for it, hence the title.  Essentially, I think Jeff is saying that it’s possible Syndergaard is taking that step, and he’s open to the idea.  Jeff did a great job (as always, thank you, Jeff) as evidenced by reactions to the article.  He got us thinking and he got us discussing — some of us liked what Jeff had to say and some of us clearly weren’t receptive to the idea.  At all.  To his credit, Jeff did exactly what he’s supposed to do.

Now before we nosedive into the reasoning behind the outlandish title of this article, I want to get a few things out of the way: First and foremost, I’m sorry for throwing gasoline on an already raging fire.  Second, I think Clayton Kershaw is the best pitcher in baseball because of his sustained dominance (1.98 ERA over his last 1066.1 IP).  Certainly that doesn’t mean that pitchers can’t be better than Kershaw for a period of time, however, it’s just that while others rise and fall to his level, Kershaw remains.  And finally, I think Pedro Martinez is the best pitcher of all time.  That’s partly because I was born in 1985, and partly because I read it on the internet.  Mentioning Pedro is a good time to tie back into Jeff’s article.  To quote:

…Right now, in 2016, Syndergaard has a 23 ERA- and a 22 FIP-, through three starts…

Believe it or not, Kershaw has 37 three-start stretches with an ERA- no higher than 23. He has just seven three-start stretches with an FIP- no higher than 22. What Syndergaard is doing, Kershaw has done several times. But it’s not like this is Kershaw’s resting level. And Syndergaard is just as much about the scouting as he is about the stats.

That 23 ERA- just happens to be the number I was looking for.  During his peak (97 – 03), Pedro was preposterously good, posting a K-BB% of 26.1%, a 47 ERA-, and a 52 FIP-.  The acme of his peak came in a 22-game stretch spanning the 1999-2000 seasons when he posted an ERA- of 23 and an FIP- of 33.  His K-BB% was an unruly 34%, and he allowed just 95 hits in 168.1 IP.  Marvel at the overall line: 

August 3, 1999 – June 14, 2000

GS IP TBF H R ER HR BB K ERA WHIP FIP GSv2 K-BB% ERA- FIP-
22 168.1 635 95 25 21 7 31 247 1.12 0.75 1.51 84 34.0% 23 33

Again, that 23 ERA- is what I’m focusing on because it’s the number we saw in Mr. Sullivan’s article.  I could not find a better or equal stretch of dominance, based on ERA-, over 22 games, than Pedro’s going back to 1969…until Jake Arrieta.  Looking at only regular-season games, dating back to July 2nd of 2015, Arrieta has produced that magic 23 ERA- number we’re looking for:

July 2, 2015 – April 21, 2016

GS IP TBF H R ER HR BB K ERA WHIP FIP GSv2 K-BB% ERA- FIP-
22 162 590 84 19 16 4 31 159 0.89 0.71 2.12 75 21.7% 23 55

For those of you who prefer FIP I say leave your C.R.A.P. in the comments section, because as we gain more data, we learn that pitchers have some modicum of control over the quality of contact they allow, and at this point it’s probably safe to say that Jake Arrieta is a proven FIP-beater, even if he’s earned this title in less time than it takes others.  But Arrieta’s streak is now actually at 24 starts in the regular season, and two of those have been no-hitters.  His line:

June 21, 2015 – April 21, 2016

GS IP TBF H R ER HR BB K ERA WHIP FIP GSv2 K-BB% ERA- FIP-
24 178 647 91 20 17 4 33 173 0.86 0.70 2.09 76 21.6% 22 54

Pop the confetti!  Blow your vuvuzelas! Or Tweet!  That 22 ERA- is something we’ve never seen over such a large quantity of starts (at least going back to 1969 — and at least with my hack-job research)!

What this means in the scope of baseball’s long history isn’t nothing.  It’s a marvelous line.  Of course, it is just one number I’m looking at, and ERA-, like the internet, is not without flaws.  It’s arguable and perhaps even likely that Pedro’s line, with that 34.0% K-BB%, is more impressive (that mark was 293% better than league average — lolz).  But Arrieta has two no-hitters.  However, if we look at quality of opponents, well, Pedro’s line becomes more impressive because the teams he squared off against combined for an average wRC+ of 102, whereas Arrieta’s opponents averaged 94 wRC+.

Dave Cameron wrote an article about Arrieta’s ability to control the quality of contact he allows, and as we learn more about this skill, perhaps we’ll revere it a little more — never as much as strikeouts, but definitely more than we do now.  One of Jeff’s points about Syndergaard is that he undoubtedly has the arsenal and command to become the game’s top arm.  Arrieta has legit weaponry as well, but I don’t think anything we’ve ever seen from a starter matches what Syndergaard is throwing.  We know Arrieta’s story up to this point, which makes his sudden-ish ascent to a level where he can put a streak together like the one he’s on more interesting, if not more impressive.  What he does from now until the end of his career will go a long way in determining the weight this current streak holds.  If he flames out, or loses his ability to induce weak contact, it will be seen as a lucky blip; but if he rallies off another few years of 5 – 8 WARs and 50 ERA-es, then we’ll feel better about objectively putting his streak into an historical perspective.  As of right now, even despite his current run, I’m nowhere near putting Arrieta’s name in with the all-time greats (yes, the title was click-bait, spare me the C.R.A.P.), but, like Jeff in regards to how he feels about Syndergaard, but to a lesser extent, I’m open to it.  And that’s about as far as it goes for me — but I’m so contented to sit here and watch the debate unfold, violently, online.


The Tulowitzki Hypothesis

The hypothesis: Troy Tulowitzki has a longer reaction time to pitches than he used to.  Reaction time, in this sense, refers to the overall time it takes Tulo to decide to swing and then execute the swing.  Perhaps he is only getting slower mentally, perhaps only physically, perhaps a mix of both. Regardless the source of his decline, my hypothesis is that Tulo has been slower to react since the beginning of 2015 than he has over the rest of his career. I posit that Tulo’s decline and the league’s increase in velocity have caused him to pass a “tipping point,” which has kneecapped his production.

Now for the evidence.

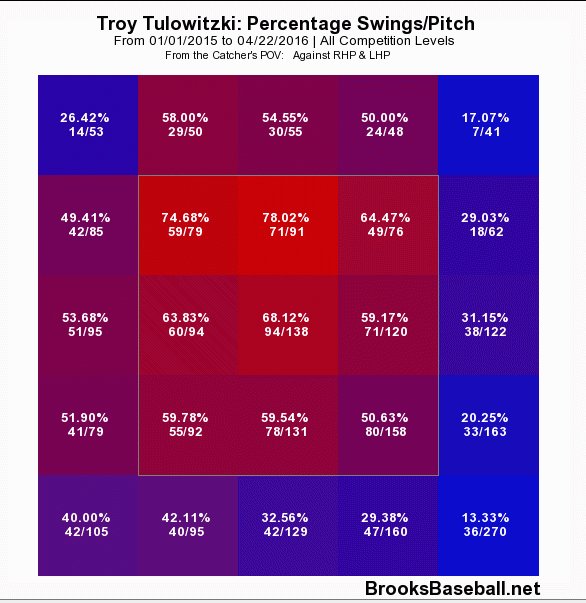
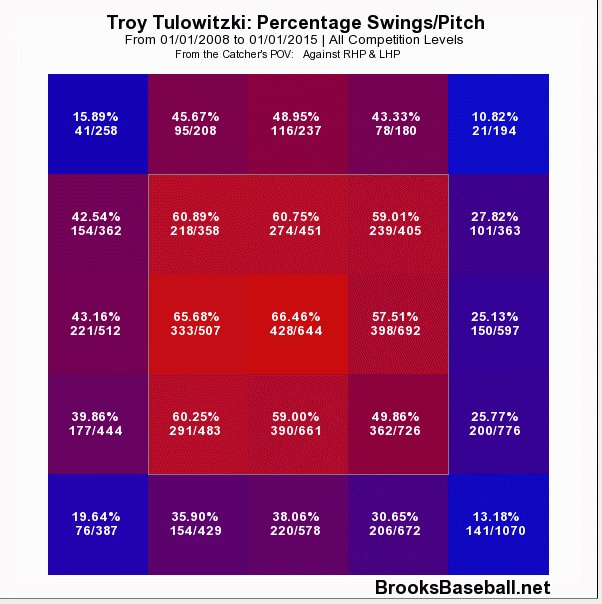
Here is a profile of Tulo’s swing rates from Brooks Baseball.  The data are from 2008-2014, before his decline.

swing per pitch

Figure 1. Swings/pitch 2008 to 2014.

Throughout his career, Tulo has preferred to swing at pitches middle in and up in the zone.  Now consider where he did his damage.

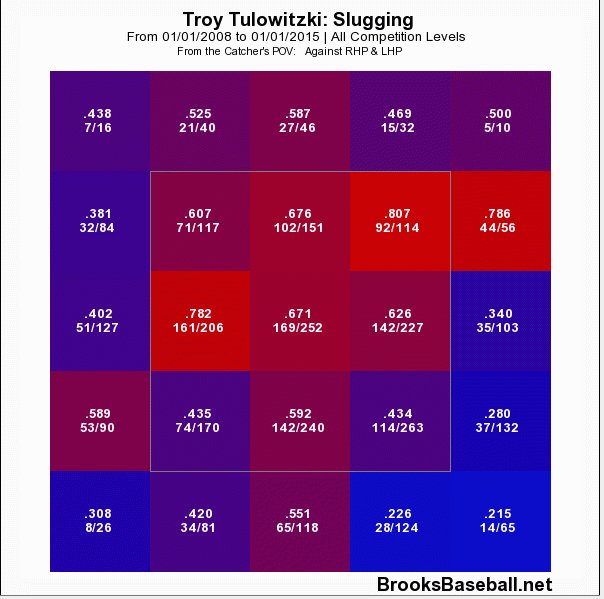
slg pitch
Figure 2. Slugging on contact 2008 to 2014.

Again, Tulo seemed to prefer the ball up.  He was most dangerous in the top two thirds of the zone and he could cover the entire width of the plate.

Location is important because the reaction time required to hit a pitch changes depending on where it is located in the zone.  A pitch gains velocity as it moves up in the zone, or as it moves toward the hitter, while pitches are effectively slower as they move down and away. Historically, Tulo has been most dangerous on pitches in the areas of the zone that require the shortest reaction times to hit.

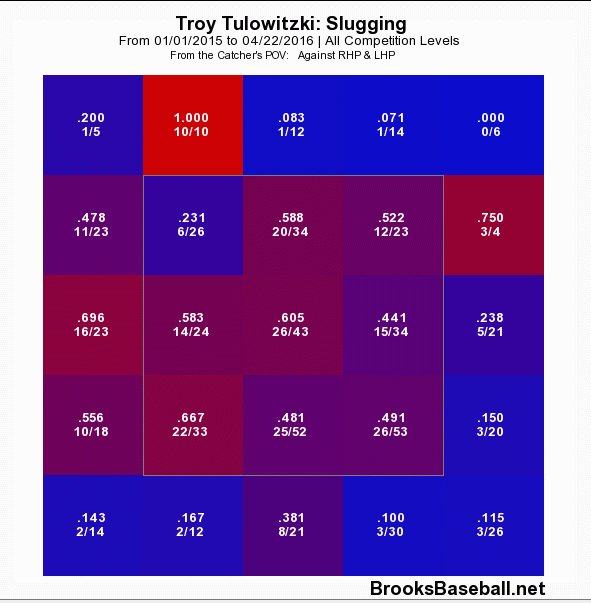
Now consider how productive he’s been since the beginning of 2015.

slg now
Figure 3. Slugging on contact 2015 to present.

Aside from the overall decline in the production in nearly all zones, it is noteworthy that Tulo’s most productive area has shifted from the top to the bottom of the zone.  From 2008 to 2014, Tulo’s production was highest in the top third, second-highest in the middle, and lowest in the bottom third.  That pattern has flipped, as now he’s most productive at the bottom of the zone and least productive at the top.

While these data are consistent with my reaction-time hypothesis, it’s also possible that Tulo has changed his approach to favour pitches down in the zone.

So let’s dig deeper.

Here is a profile of Tulo’s swing rates in the past year.

swing now
Figure 4. Swing/pitch 2015 to present.

If anything, Tulo has doubled down on his up and in approach, swinging at 75% – 78% of pitches up or up and in.  Tulo is swinging much more often at high pitches, and slightly less often at low pitches.  It doesn’t appear that he switched his approach to attack the bottom of the zone.

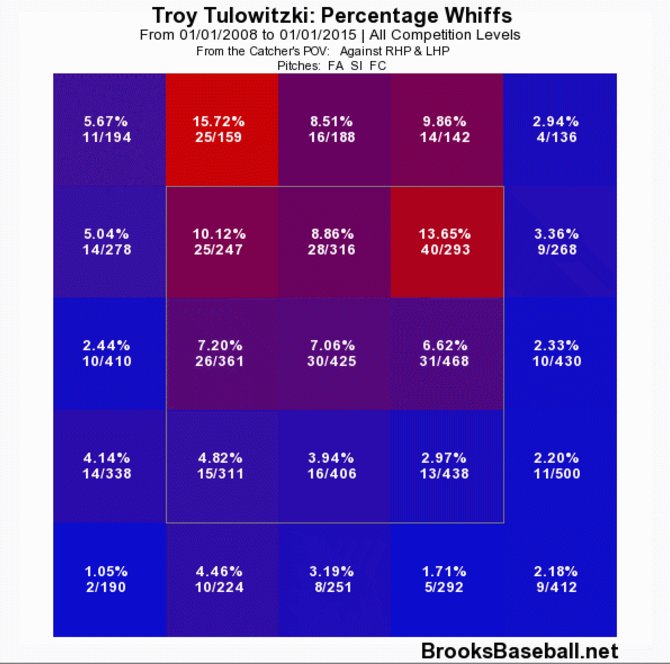
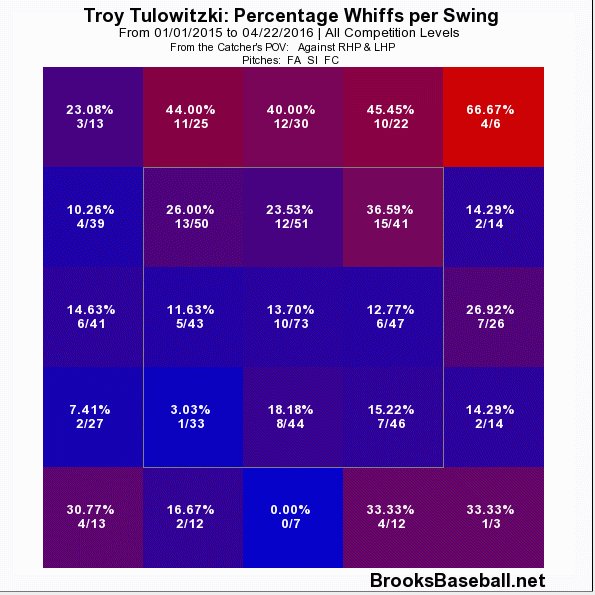
Let’s focus specifically on Tulo’s ability to make contact with the hard stuff. The two figures below show Tulo’s whiff-per-swing rates against all fastballs, the first from 2008 to 2014, the second from 2015 to present.

whiffs then
Figure 5. Whiffs/swing, 2008 to 2014.

whiffs now
Figure 6. Whiffs/swing 2015 to present.

Tulo has basically lost the ability to handle high fastballs. Historically a high-fastball killer, now Tulo can’t seem to catch up.  He swings and misses more than twice as often on fastballs in all three locations at the top of the zone. Let me spell it out: Tulo whiffs 2.57 times more often up and in, 2.77 times more middle-up, and 2.68 times more often up and away. And it gets much worse when you consider up out of the zone: He’s swung and missed 4.6 times more often at pitches on the outer third and just up out of the zone. Yikes.

While consistent with my hypothesis, swinging through high fastballs isn’t the only deficiency I’d expect if a hitter has lost some reaction-time skill.  Pitch recognition and plate discipline are also affected by a hitter’s reaction ability.

Discipline depends on a hitter’s ability to decide quickly whether a pitch is a strike or a ball. Tulo set a career high last year with an O-Swing% of 30.6%, three full points above his previous high in a season of 27.6%.  Tulo is chasing pitches outside the zone more than ever before.

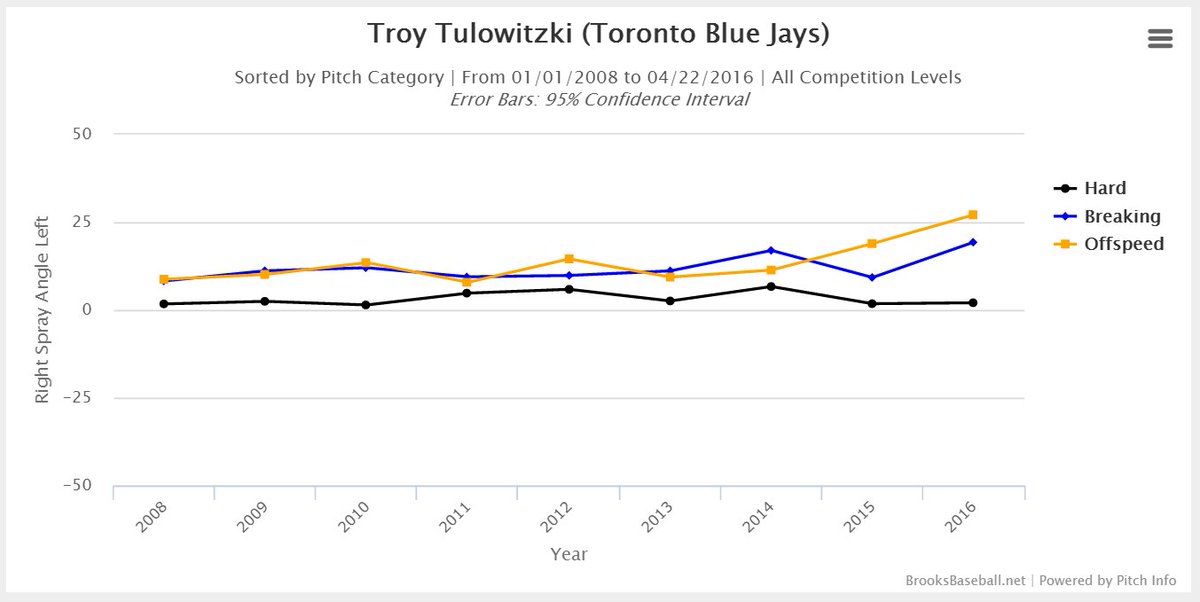
Pitch recognition depends on a hitter’s ability to recognize pitch type in time to adjust his swing. Here is a chart of Tulo’s average spray angle as a function of pitch type.  Spray angle indicates the direction (left field to right field) that balls are hit on average.  Thus, the more positive the average spray angle the greater the tendency to pull that pitch type.  As you can see, Tulo has historically hit breaking balls and off speed pitches with the same spray angle, suggesting that he was able to recognize and wait back equally well for both pitch types.

spray angle
Figure 7. Average spray angle by pitch type, 2008 to present (short seasons in ’12, 14, and ’16).

In 2015 and onward, Tulo has been pulling offspeed pitches much more than breaking balls. The result (which I won’t bother to show you graphically), has been an abundance of roll-over ground balls against offspeed pitches.

Breaking balls are easier to recognize out of a pitcher’s hand than offspeed pitches. So while Tulo is still able to use the earliest information to make an adjustment, he seems unable to make use of later trajectory and spin information that would allow him to recognize and adjust to offspeed pitches.

Maybe this is because his response speed to the later information has slowed, or maybe it’s because Tulo is committing to his swing too early to make the adjustment.  I would guess the latter.

So in summary, the reaction-time hypothesis is supported by evidence suggesting Tulo is most vulnerable when the required reaction time is shortest, he is less able to recognize pitch location in time to lay off, and he is no longer able to adjust to offspeed pitches as well as breaking balls.

A POSSIBLE SOLUTION

I’m a Jays fan and a Tulo fan so I won’t be ending this post with a “Tulo’s washed up” conclusion.  I watch this guy almost every day.  He’s still got the athleticism, the power, the hand-eye, and the swing. That said, the data have me convinced that he needs to make an adjustment.  The first thing I’d try is almost embarrassing to suggest, but I’ll suggest it anyway.  Tulo should swing a lighter bat.

Hear me out. Tulo just turned over the wrong side of the aging curve – especially for a shortstop – and meanwhile the league is throwing faster than ever.  He used to have success with an approach that requires superhuman abilities, and now that he is slightly less superhuman, that approach isn’t working.  Perhaps changing the swing weight of his bat, shaving off an ounce, could allow him to catch up to the pitches he’s not getting to and return him to some semblance of his previous form.

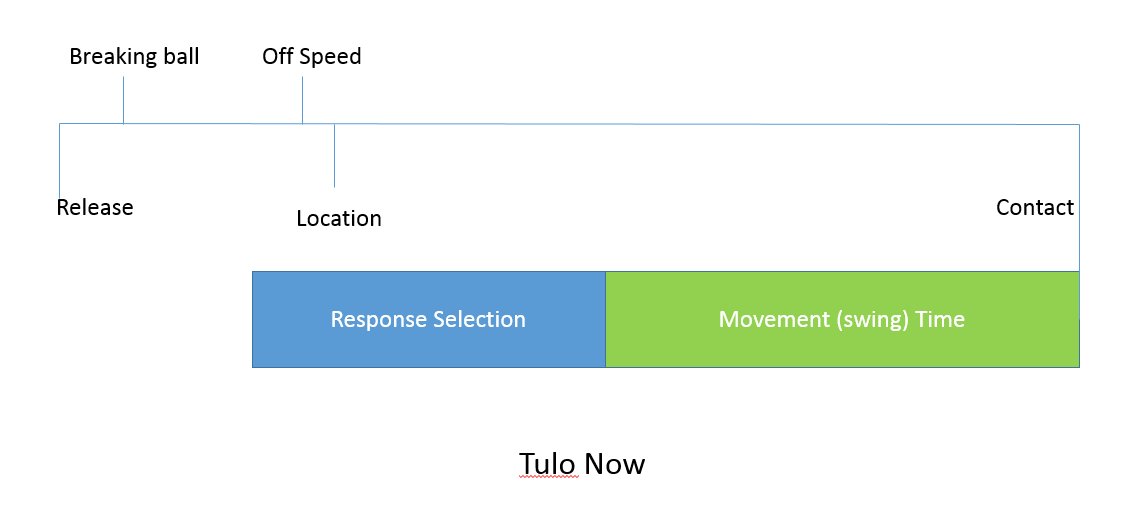
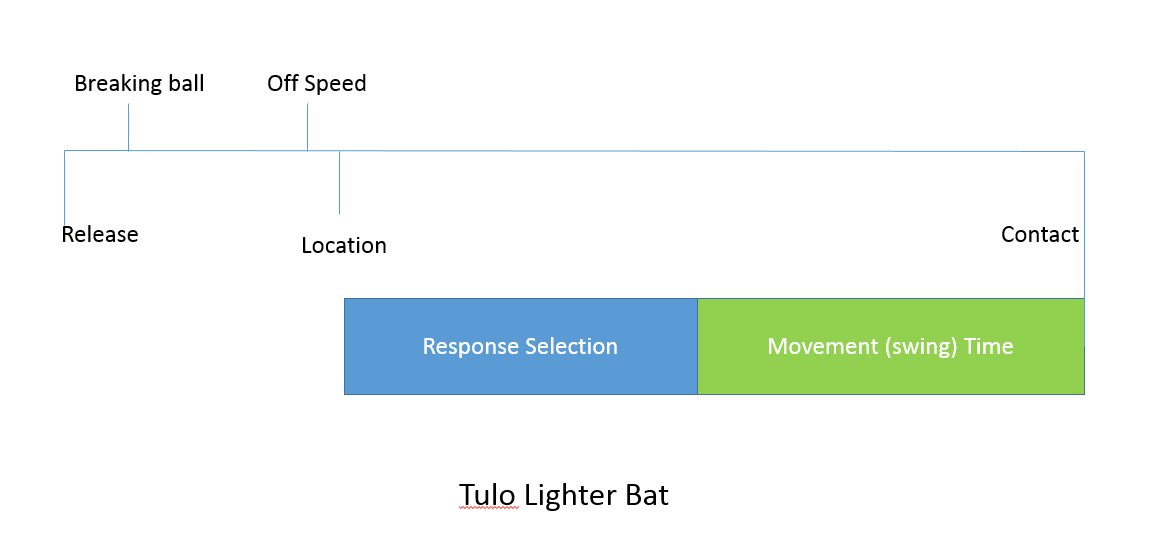
Take a look at the two schematics below (conceptual, not to scale). The full line from Release to Contact represents the timeline of the pitch.  The lines for “Breaking ball,” “Offspeed,” and “Location,” represent the moments when the hitter finally has enough information to process these respective features of the pitch.  Hitters recognize pitch type before location and breaking balls before changeups.  The coloured bars represent the time required to execute the cognitive and physical aspects of the swing.  The decision to swing must be completed by the beginning of the blue bar (response selection), in order for the brain to have enough time to make the necessary commands (response selection) and execute the swing (movement time).

My hypothesis suggests that the length of one or both of the coloured bars has increased for Tulo, while the length of the entire timeline has shortened for him (and everyone else).  I propose that both factors have pushed the blue bar to the wrong side of the deadlines for offspeed and location, causing Tulo to swing at more balls and fail to recognize changeups in time to adjust. The longer reaction time leaves Tulo vulnerable against hard stuff up and in, yet that’s exactly where Tulo made his money throughout the rest of his career. The “Tulo Now” schematic represents things since 2015, while the “Tulo Lighter Bat” figure depicts my proposed solution.

tulo now

tulo light bat

I’m not sure if anything can be done about a longer response selection time, but my hope is that a lighter bat could reduce Tulo’s movement time enough to get him back to the right side of those offspeed and location deadlines.  If Tulo can’t shorten his overall response time, he’s not going to be able to approach the game the same way he has for the rest of his career.  He’ll need to start looking down, looking away, and spitting on high fastballs.  Basically, he’d need to give up on what made him great.

I know trying a new bat might be a hard sell for a guy who won’t give up his 100-year-old beaver tail of a mitt, but I think changing bats might be easier than changing everything else. Including a swing that still looks fantastic.


The Pirates’ Inability to Move Runners

The first week of April in Pittsburgh felt like a National League Division Series in the midst of October with tons of energy and excitement. Francisco Liriano threw six shutout innings with 10 strikeouts and led the Pirates to a game 1 win. In game 2, the Pirates revived some late-inning magic from 2015 and walked off in the 11th on a Jordy Mercer single down the first base line. In game 3, Juan Nicasio showed many that his spring training stats were not a fluke and led the Pirates to a 5-1 win. The Pirates started 2016 with a three-game sweep of the division rival St. Louis Cardinals and “yinzers” were ecstatic. FanGraphs’ very own Jeff Sullivan wrote a piece examining the changes in playoff odds after just one week of play. His chart had the Pirates’ odds increasing by seven percentage points, while the Cardinals’ odds decreased by almost five percentage points. While it was only the first series of the season between the two teams, it still meant something. However, since that series, the Pirates have faced many ups and downs. Let me elaborate.

Before entering the 2016 season, one major concern of a Pirates’ fan could have been the rotation that they decided to bring north, which consisted of Francisco Lirano, Gerrit ColeJon NieseJuan Nicasio, and Jeff Locke. You will not mistake this rotation with the Mets’ fab four or the Indians’ top three anytime soon. The other night, Jeff Locke surrendered 11 hits and eight earned runs in just three innings against a Padres offense who struggled to score a run in their opening series of the season. On Tuesday night, Liriano returned from a “hamstring injury” by giving up two homers and walking five. However, there is light at the end of the tunnel with former number-two overall pick Jameson Taillon and top prospect Tyler Glasnow nearing their debuts. Believe it or not, pitching may not be the Pirates’ primary concern at the moment.

In the past three years, as an avid fan of the Pirates, I have noticed an ongoing inability to move runners and take advantage of any sort of small-ball approach. Therefore, I decided to take a look at the numbers. Through the first 15 games of 2016, the Pirates are last in the league with 9.33 runners left on base per game. Minnesota comes in a distant second with 7.93 runners left on base per game. Now, I am very well aware of the small sample size. It is very easy to be overwhelmed by early-season statistics, such as Gerrit Cole starting with an 0-2 record and a 4.22 ERA, but we are only 15 games into a 162-game season and there are many more important statistics than ERA. While the Pirates are leaving the most runners on base per game, they are also sporting the highest team OBP (.380) in the league. Coming in second is the St. Louis Cardinals with a .348 team OBP. Due to the small sample size, I decided to take a look at the past two seasons where I have also noticed their inability to move runners.

In 2015, the Pirates came in dead last in all of baseball with 7.22 runners left on base per game. However, they sported a top-10 OBP of .323, which was not far behind the league’s best OBP of .340 by the Toronto Blue Jays. Lets take another step back. In 2014, the Pirates finished 29th in the league with 7.35 runners left on base per game. The only team to leave more runners on base that year was the Tampa Bay Rays (7.36). Surprisingly, the Pirates finished third in team OBP (.330) trailing only the Detroit Tigers (.331) and the Los Angeles Dodgers (.333).

Interpret this however you may like, but it is apparent that the Pirates lack a very important skillset of moving runners, or executing successful situational baseball. In the past three years, the Pirates have finished in the top 10 in stolen bases. While this statistic is by no means the only measure of team speed, it is very clear that the Pirates have some speed and athleticism in their lineup among guys like Andrew McCutchen, Starling Marte, Gregory Polanco, Josh Harrison, and Jordy Mercer. These are not guys that should be taken lightly on the base paths. According to Moneyball, Billy Beane and the Oakland A’s went after undervalued position players who had a knack for getting on base, thus, scoring more runs. So far, the Pirates are getting on base more than anybody this year. With better pitching performances from their rotation and moving runners more efficiently, whether that’s through more smallball or just better situational hitting, the Pirates could easily be one of the better teams in the league this year. Don’t lose hope too early, Pittsburgh.


The Mets Offense Lives and Dies With the Long Ball

Recently the New York Mets took the lead in the top of the first inning for the fifth straight game, setting the tone early in their 11-1 victory over the Philadelphia Phillies.  The Mets hitters looked extremely comfortable in the batter’s box, taking aggressive swings at good pitches all game.  The result was 11 runs all scoring through six home runs.  After hitting only two home runs in the first eight games of this season, the Mets have hit 17 home runs over their last five.

Every good team hits home runs, especially timely home runs.  However, great teams don’t need a lot of home runs.  Great teams live by the old adage, get on, get over and get in, meaning, get on base, advance on the base paths and score.

Since the wild card playoff system began in 1995, only two of 21 World Series championship teams finished in the top four in home runs during the regular season (2008 Phillies, 2009 New York Yankees).  However, during the same span of time, eight of 21 World Series championship teams finished in the top four in on-base percentage during the regular season, including 13 champions finishing in the top 10.

Home runs are an exciting, quick confidence boost for a batting lineup.  The only problem for a home-run-reliant team is home runs come in bunches.  Between facing MLB pitching every night and the natural difficulty in hitting a home run, sustaining home runs every game and the corresponding confidence is extremely difficult.

Conversely, a lineup with high on-base percentage forces the pitcher to uncomfortably pitch from the stretch more often and drives up pitch count which helps get the opposing starting pitcher out of the game earlier and into the opposing team’s weaker bullpen pitchers.

Currently, the Mets rank sixth in Major League Baseball with 19 home runs, two behind the third-ranked teams.  However, the Mets rank 21st in MLB in on-base percentage, 20th in batting average and have scored 56.6% of their total runs through home runs (30 of 53 runs).

Comparatively, the St. Louis Cardinals rank third in MLB with 21 home runs.  However, the Cardinals are second in MLB in on-base percentage, fifth in batting average and have scored 44.2% of their total runs through home runs (38 of 86 runs).

Additionally, the Mets are 24th in contact rate (percent of swings on which contact was made) and 29th on O-Contact rate (percent on which contact was made on swings outside the strike zone) according to FanGraphs.  What does that even mean?

A low contact percentage creates fewer balls in play resulting in a lower opportunity for the Mets to get hits and a greater challenge advancing runners along the bases.  The O-Contact rate shows the Mets aren’t hitting bad pitches, particularly two-strike pitches, well, a staple of many great teams (see 2015 Royals, recent Cardinals and Giants teams).  Making high contact percentages with pitches outside the strike zone lowers strikeout rates, forcing opposing pitchers to throw more pitches and puts additional pressure on the fielders to complete more defensive outs.

Additionally, in the nine games the Mets hit one home run or none, they averaged 2.9 runs per game.  In the other four games hitting two or more home runs, the Mets averaged 6.8 runs per game.  Obviously, runs per game will be higher when two or more home runs are hit but the disparity shouldn’t be as high as almost four runs or 2.3 times as high.

I’m not suggesting Mets hitters can’t manufacture runs through singles, extra-base hits and taking extra bases (not only by steals but going first to third on singles).  I’m not suggesting it’s time to panic.  I’m suggesting it’s something to pay attention to as the season progresses.


A Beacon of Hope for Minnesota

As a former No. 1 overall draft pick, No. 1 overall prospect, three-time batting champion, and 2009 American League M.V.P., Joe Mauer seemed destined to dawn a Twins cap in his inevitable Hall of Fame induction. He claimed the title Mr. Minnesota, and the Twins payed him as such when they inked him to an 8-year, $184M contract starting in the 2011 season. However, Mauer’s sudden drop in production following his full-time conversion to first base left many Minnesotans cursing his name and clamoring for the vintage Joe Mauer. As a small market franchise attempting a rebuild, Minnesota desperately needs Mauer to live up to his contract if they plan to contend with their rising young core. While 2016 has started off miserably for the Twins – their division odds have already sunk from 7.6% to 1.5% – a resurgent Mauer provides one bright spot in an otherwise bleak outlook. While the usual sample size caveats apply here, Mauer’s improvements appear more than superficial.

Through the first couple weeks, Mauer has crushed the ball to the tune of a 173 wRC+, and has already surpassed his 2015 fWAR. He has raised his BB% to 12.8, the highest it’s been since 2012, cut his K% down to 8.5, lowest since 2008, and upped his isolated power to .154, its highest mark since his M.V.P. campaign in 2009. While Mauer most certainly cannot maintain his current .371 BABIP, underlying signals suggest that he may have broken out of his two-year slump and regained his All-Star form.

One indicator: his resurgence in batted-ball prowess. So far this season, Mauer’s Hard% is up greater than 10 points over the past couple seasons and has risen back to his previously dominant levels. Similarly, Mauer is pulling the ball more than ever, and is going to the opposite field less than ever before. Perhaps this is a sign of Mauer adjusting to an aging body – as his bat speed diminishes, he might swing earlier to try and get ahead of the ball. Another encouraging sign: his line-drive rate has risen to 33.3%, the highest he’s ever had it, while his fly-ball rate has diminished to 19.4% the lowest he’s ever been at. Considering how much his home park, Target Field, suppresses left-handed power, this seems a wise adjustment to make. On the downside, Mauer’s HR/FB rate and IFH% reside above his expected rates, providing obvious areas for his power and BABIP to regress. However, the overall batted-ball picture remains encouraging.

In addition to batted balls, Mauer is displaying an overall different approach at the plate. His O-Swing% is back to its previous low form while his Z-Swing% and overall Swing%, have sunk to their lowest levels in his career. After Baseball America rated him as having the best strike-zone discipline in the American League in 2012, his chase rates spiked tremendously in 2013 and had remained there since. Now Mauer seems to have regained that lauded discipline. Furthermore, his Zone% has actually dropped each of the past three seasons; this combination of less pitches in the zone and fewer chases out of it explains his rising walk rate. Additionally, Mauer has significantly raised both his O-Contact % and Z-Contact%. Overall, it appears Mauer has become more selective on which pitches he feels he can barrel up, hence the rising contact and line-drive rates.

Now if Mauer truly has made critical adjustments to improve his game, then we should expect to see pitchers alter their approach as well. Baseball is nothing if not a game of adjustments. According to Brooks Baseball, Mauer’s current relative mix of hard, breaking, and off-speed pitches seen remains the same as ever, suggesting that no major adjustments have been made yet. However, if his bat truly is slowing down and these are his adjustments, we should expect to see pitchers start attacking him with fastballs up and in. Currently, Mauer sees roughly 1/3 of his pitches off the plate low and away. Realizing that he won’t chase those anymore, pitchers will presumably begin attacking him in the zone more often. Whether Mauer can turn on these pitches and continue lining the ball the right will determine whether or not these results stick.

In the big picture, small-sample variance likely explains most of Mauer’s current success. However, Mauer does appear to at least be attempting to adjust his approach, hence we should not entirely disregard these results. Up to this point, Mauer has shown significantly more selectivity in which pitches he swings at, particularly in the zone, letting him barrel up the ones he feels he can hit with conviction. As pitchers adjust to his adjustments, we will see whether Mauer has truly made a triumphant return. The Twins desperately hope Mauer can maintain a modicum of these results, as he will earn $23M a year through 2018. Unlikely to go out and make a major free-agent splash, Minnesota needs Mauer to provide value commensurate to his contract if they plan to capitalize on their youth movement. Once (if) Sano, Buxton, Berrios and company develop, the Twins could have a devastating roster led by Mauer. Until then, in a season marred by underperformance and disappointment, the return of Minnesota’s favorite son could provide a potential beacon of hope.


The Gritty Details

“Grit” in baseball has long been a gag for the saber crowd. Fire Joe Morgan was basically one long joke about how gritty David Eckstein was. And there’s good reason to distrust “grit.” Grit, hustle, guts — they’re unquantifiable (sabermetrician attempts to the contrary), often racially coded, and poorly defined skills. (Grit does predict great legal representation, though!)

Yet “grit” has evolved into a buzzword and teachable skill — one that social scientists suggest correlates with success in school, work, and life. Grit is defined by Prof. Angela Duckworth, who pioneered the field of “grit” research, as follows:

We define grit as perseverance and passion for long-term goals. Grit entails working strenuously toward challenges, maintaining effort and interest over years despite failure, adversity, and plateaus in progress. The gritty individual approaches achievement as a marathon; his or her advantage is stamina. Whereas disappointment or boredom signals to others that it is time to change trajectory and cut losses, the gritty individual stays the course.

Duckworth’s research suggests that grittiness corresponds with success in everything from spelling bees to West Point.

So why not in baseball? In a sport where we are constantly prophesizing how players develop, isn’t the predictive power of “grit” something we should be looking at? And can “grit” help us ID players who are more than meets the eye? Read the rest of this entry »