Archive for July, 2015

Is Cameron Maybin Here to Stay?


The scouting report on Cameron Maybin hasn’t changed much since the Detroit Tigers selected him 10th overall in the 2005 amateur draft. “A prototypical five-tool player trying to learn how to turn his potential into performance.” Well here we are ten years later, and the once glorified minor-league prospect appears to finally be tapping into the potential that scouts used to rave about. At age 28, Maybin is blossoming into one of the biggest surprises of the 2015 season and is showing no indications of slowing down. Do we have another Jose Bautista case on our hands? Perhaps to a much lesser extent, but let’s not get carried away just yet.

Will there ever be a way to validate the Tiger’s decision to take him over Andrew McCutchen back in 2005? Of course not, but nine other teams passed on McCutchen as well so that’s not the point. The point is that in 2015, Maybin is proving that he can be a useful, everyday player in the big leagues with the ability to perform slightly better than your league-average center fielder. Through 81 games, Maybin ranks 7th in OBP and 10th in wRC+ among center fielders with at least 200 plate appearances. He is sporting career highs across the board and has given the Braves an unexpected and extremely valuable bargaining chip as the trade deadline approaches.

So what exactly has changed? Maybin has been asked this same question on multiple occasions throughout the season and each time he responds, praise is thrown in the direction of new Braves hitting coach, Kevin Seitzer, who’s hitting philosophy revolves around driving the ball up the middle. Now, I am sure that many other hitting coaches have this same philosophy, but for whatever reason, Seitzer has been able to get through to Maybin and successfully revamp his entire thought process when it comes to hitting. Let’s take a closer look at how.

Seitzer immediately recognized that at 6-foot-3, Maybin had a naturally long swing that was slow through the strike zone. To correct this, he recommended that Maybin start with his hands closer to his body, which would provide a shorter and more compact swing.  This slight mechanical adjustment is allowing him to hit the ball with more authority than ever before. Check out Maybin’s line-drive percentage on a yearly basis since 2010 in the table below.

Year LD%
2010 14.2
2011 15.9
2012 16.1
2013 19.0
2014 17.0
2015 23.6

Maybin’s whole approach to hitting has changed under Seitzer as well. He has never owned a strikeout percentage to write home about and his 2015 mark of 17.4% is no different. However, it’s worth noting that this is down 3.2% from last year, so signs of improvement are not exactly absent in that regard. What’s even more worth noting is that Maybin is walking more than he ever has which is a direct product of his astronomical improvement in situational hitting. Check out Maybin’s walk to strikeout ratio on a yearly basis since 2010 in the table below.

Year BB/K
2010 0.26
2011 0.35
2012 0.40
2013 0.44
2014 0.34
2015 0.55

Maybin is thriving with a .400/.452/.898 slash line with runners in scoring position this year (all career highs), showing that he really is taking Seitzer’s philosophy to heart. For the first time in his career, he seems to have a plan every time he steps into the batters box. He is putting the ball in play to the right side 30.9% of the time in 2015 which is 7.1% better than his previous career high in 2012. Nothing illustrates the change in Maybin’s approach better than the spray charts below. In 2011 with San Diego, which is his best completed statistical season to date, you can see that he was almost exclusively pull happy. The shift in the distribution of hits in 2015 shows that Maybin is succeeding in his effort to shorten his swing and drive the ball the other way.


Can he keep this up? That remains to be seen, however, this does not have the makings of a complete fluke. Surely his BABIP is due to come down eventually, but it’s hard to think that he will revert completely back to his old habits. Maybin said earlier this season that he had always felt like he was missing something when it came to hitting. With the help of Kevin Seitzer, the former North Carolina high school standout has finally found it, and it’s a joy to watch.


Where Have You Gone, Baseball Boulevard?

Baseball Boulevard Logo

Joe DiMaggio’s foot was “parboiled” by a trainer, delaying his Major League debut in 1936. This footnote, no pun intended, occurred in St. Petersburg, Florida and was immortalized with a plaque along Baseball Boulevard.

For some baseball fans, seeing a game in each of the 30 Major League ballparks is a dream. Others take it to the next level, creating checklists that contain minor league ballparks, spring training facilities, museums and historical markers. While professional baseball stadiums are relatively easy to find, baseball-themed museums and memorials are often tucked away in locations far from the beaten path. Frankly, the number of baseball museums and historical markers across the United States and Canada is staggering.

One of the most ambitious baseball historical marker projects ever was installed in St. Petersburg in 1998. The Jim Healey and Jack Lake Baseball Boulevard was named for the two men who campaigned for a Major League team in St. Petersburg. Costing over $47,000, home plate-shaped plaques were installed in chronological order listing a significant event from each year of St. Petersburg baseball from 1914 through 1998. These highlights often had a humorous tenor, recalling not only the cooking of Joltin’ Joe’s foot but Babe Ruth having been chased off of Crescent Lake Park field by an alligator in 1925, a 1940 game played by men riding donkeys and the infamous Sidd Finch hoax in 1985. The trail culminated with a plaque celebrating the arrival of the Devil Rays as the city’s first year-round home team in 1998.

Recently, this author took in a Tampa Bay Rays game at Tropicana Field and set out the next day to walk Baseball Boulevard. Armed with an article from the Tampa Bay Times detailing the route, the course was plotted – at nearly a mile and a half in length – the plaques were to be found at intervals starting at Al Lang Stadium, up 1st Street and traveling down Central Avenue before turning towards Tropicana Field at 13th Street.

Arriving at the starting point, it was apparent that remodeling work was underway at Al Lang Stadium. Named for the former mayor who championed spring training in St. Petersburg, Al Lang Stadium was the spring training home for Major League teams from 1947 through 2008. It is now the home field for the Tampa Bay Rowdies, a professional soccer team with a loud green and yellow color scheme.

The first historical plaque

The first of the commemorative plaques was easily found, highlighting the first spring training game ever held in St. Petersburg, a Chicago Cubs 3-2 victory over the St. Louis Browns at Coffee Pot Park in 1914. Also easy to spot was a marker honoring Al Lang, himself, and the trailhead legend, which reads:

Florida’s love affair with baseball began in St. Petersburg in 1914 when the city’s former mayor, Al Lang, convinced Branch Rickey to move his St. Louis Browns to the Sunshine City for spring training.

For the next 84 years, St. Petersburg collected grand springtime memories. Then, in 1998, the spectrum changed as the Tampa Bay Devil Rays began play and made St. Petersburg their year round home.

We invite you to stroll along Baseball Boulevard and relive a colorful history that highlights the time spent in St. Petersburg by some of the sport’s greatest and most exiting players-stars such as Babe Ruth and Joe DiMaggio of the Yankees, Stan Musial and Bob Gibson of the Cardinals, Tom Seaver of the Mets and Cal Ripken of the Orioles.

The Boulevard also honors the contributions of local heroes who worked tirelessly to bring Major League Baseball to St. Petersburg.

It is named in honor of Jim Healey and Jack Lake, both of whom were instrumental in the construction of Tropicana Field and the city’s success in securing a Major League Baseball franchise for Florida’s West Coast.

Walking north on 1st Street, however, no other plaques were found. Turning on Central to head west, the markers were nowhere to be seen. Having continued to 5th Street, it seemed rather unusual that no plaques or pedestals had yet to be encountered. People on the street were not much help. The first four folks had never even heard of Baseball Boulevard. The fifth person knew that “they moved ‘em” and that was about it.

Accessing the newspaper article again by iPhone revealed, unseen at the bottom of the page, that it had originally been published in the St. Petersburg Times on September 16, 1998. A previously undiscovered article explained that Baseball Boulevard did not garner the attention the planners had hoped and by 2011 several of the concrete pedestals had fallen into disrepair. Faced with costs of repairing and replacing the pedestals, the city decided instead to relocate the plaques to Al Lang Stadium.

Now having returned to Al Lang Stadium, it was clear that no other plaques were on display there. A walk around the entire exterior did not reveal any commemorative markers. Peering into the concourse did not yield any signs of relocation. This was now a full-blown mystery.

Al Lang Stadium facade

A couple of tradesmen were bothered with questions about Baseball Boulevard and neither had any information about the plaques. Just about to leave, with more questions than answers, a carpenter appeared out of nowhere and pointed at the stadium’s façade. “They’re right there, don’t you see them?” in a clear attempt to poke fun at a tourist. “Huh?”

“Come closer,” he said, “you can kinda see the outline of the plaques under that banner.” It was true, the home plates that had been lovingly relocated to Al Lang Stadium were now ingloriously covered by a Rowdies banner.

Outline of covered plaques

It was perfectly clear that the Rowdies did not hold the plaques or the area’s baseball history in high regard. What a shame. A must-see destination for baseball history buffs is now just a shadow of its former self, cloaked in garish green and yellow. Hopefully we will live to see Baseball Boulevard resurrected.


Ode to Willie Bloomquist

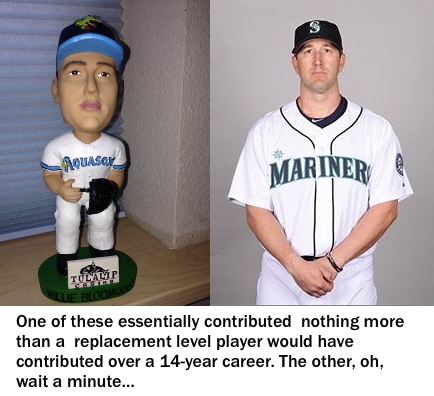
After 14 years in the Major Leagues, longtime utility player Willie Bloomquist was designated for assignment by the Mariners on Thursday. If this is truly the end, you have to agree that Willie Bloomquist had an amazing career when you stop to think about it. He lasted 14 years in the big leagues, played in over 1000 games, had more than 3000 plate appearances, and finished his career with a grand total of 1.0 WAR. As Tom Tango has pointed out many times, Willie Bloomquist has been “Mr. Replacement Level” for many years.

The highest WAR Willie B ever had in one season was 0.7 and that came in a 12-game stint as a September call-up in his rookie year of 2002. He hit .455/.526/.576 that year, thanks in large part to a sky-high .484 BABIP. In his last seven games that season, Bloomquist had a four-hit game, two three-hit games, and two two-hit games. He was the Fred Lynn of the 2002 Mariners (with apologies to Fred Lynn). Lynn had a sizzling 15-game stint in September of 1974 when he hit .419/.490/.698. Lynn, of course, followed up that torrid September with a terrific .331/.401/.566 year in 1975, winning the Rookie of the Year award and the AL MVP. Bloomquist followed up his scalding cup of coffee by hitting .250/.317/.321 over 89 games in 2003.

Imagine if Bloomquist never had that incredible BABIP-fueled 12-games stretch at the start of his career. How much did those 12 games affect the Mariners’ opinion of him, perhaps leading to more opportunities than a career-long replacement level player would normally get? Would he have had the career he had if not for that 12-games stretch of hot hitting?

It seemed destined for Willie Bloomquist to play for the Seattle Mariners. He was originally drafted out of nearby South Kitsap High School in Port Orchard, Washington in the eighth round of the 1996 amateur draft, but he eschewed the Mariners’ offer to go to Arizona State University. With the Sun Devils, he was named ASU On Deck Circle Most Valuable Player, just like Dustin Pedroia, Ike Davis, Paul Lo Duca, and Barry Bonds. That’s like a Mount Rushmore of Arizona State MVPs, plus Willie Bloomquist. At ASU, Bloomquist hit .394, the third-highest batting average in school history, and was the first Sun Devil to have back-to-back seasons with 100 or more hits. College Willie Bloomquist was pretty damn good.

After his junior season, Bloomquist was again drafted by the Mariners, this time in the third round. He signed and began his career with the Everett Aquasox in the Northwest League. He hit .287/.366/.410 that year while primarily playing second base. One of his teammates on the 1999 Aquasox was a 17-year-old Australian named Chris Snelling. Snelling was the youngest player on the team but hit .306/.388/.498 and looked to have a bright future. Unfortunately, he turned out to be the anti-Willie Bloomquist. Snelling was like a meteor that flashed quickly across the sky and disappeared after just 93 games in the big leagues across five injury-marred seasons. Willie Bloomquist was a slow and permanent planet who played 1055 games over 14 years at slightly above replacement level.

In 2000, Bloomquist was moved up to the High-A Lancaster JetHawks in the California League. This was a hitter’s league, with teams averaging 5.3 runs per game. Bloomquist had his best season, hitting .379/.456/.523 with 22 steals in 64 games, then was bumped all the way up from High-A to AAA. He was clearly overmatched and struggled mightily as a 22-year-old in AAA, hitting .225/.249/.277.

In 2001, while the Mariners were winning an amazing 116 games, Bloomquist was sent down to AA and hit .255/.294/.310, although with a career-best 34 steals. Despite his struggles hitting AA pitching, the Mariners aggressively moved Bloomquist up to AAA in 2002. He hit .270/.331/.383, then had that amazing 12-game stretch in September and the legend of Willie B was born.

Being able to play multiple positions was a big part of the baseball longevity of Willie Bloomquist. The only position other than pitcher that he never played was catcher. He never once donned the “Tools of Ignorance” but played at least 47 games at every other position, finishing his career with a negative UZR at every position he ever played. That’s consistency, my friends.

Bloomquist played the first seven years of his career with the Seattle Mariners, hitting .263/.322/.324 over that stretch, good for a .291 wOBA and 76 wRC+. He usually filled in at multiple positions, playing 80 to 90 games per year. He was like that bachelor uncle that always shows up at the family reunion but doesn’t do anything particularly memorable. Crazy aunt Alice will get into a heated argument with cousin Ashley over her too-revealing tank top, while ancient grandpa Ray loudly complains about whomever is currently occupying the White House, but uncle Willie just sits off to the side, casually eating some chips and drinking his beer. Everyone agrees he’s a good guy and nice to have around. If they need someone to man the grill for an hour, Willie’s the guy. If you’ve got a game of horseshoes going, or Bocce Ball or Cornhole or badminton or Frolf, Willie’s game. He never seems to win but isn’t the worst one out there either. He’s just a reliable guy, like mashed potatoes but without the gravy. Sure, you’d much rather have the gravy with the mashed potatoes but you’ll settle for just the spuds if there’s not a better option.

Bloomquist joined the Mariners at the tail end of their last real good stretch of baseball. From 1995 to 2001, the Mariners made the playoffs four times in seven years. Those remain their only four playoff appearances ever. Then Willie Bloomquist showed up in 2002 and they haven’t made the playoffs since (not that it’s his fault). From 2002 to 2008, Willie Bloomquist was reliably Willie Bloomquistian. He never had fewer than 1 WAR or more than 1 WAR in a season. This would hold true for his entire career:

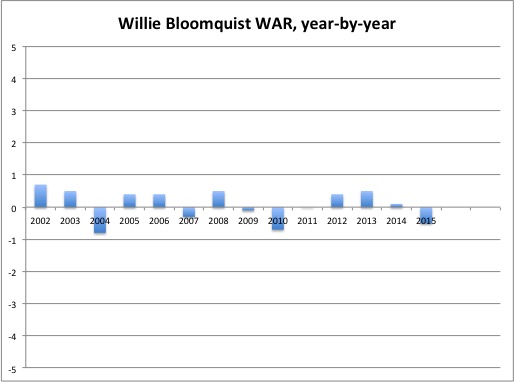
There’s that consistency again. Willie Bloomquist—reliably replacement level. Of course, minor league baseball promotions directors don’t care about WAR, so in 2004 the Everett Aquasox had Willie Bloomquist Bobblehead Doll Night. The resemblance is uncanny:

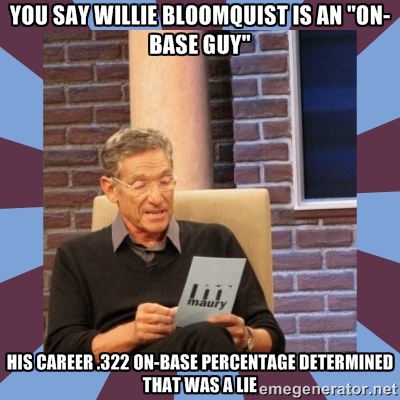
After the 2008 season, Willie B took his talents to Kansas City, signing a two-year, $3.1 million contract with the Royals as a free agent. Through six-plus years in the Major Leagues, Bloomquist had accumulated 1.4 WAR plus an unknown amount of intangibleness that likely added to his value. As Dayton Moore said at the time, “He’s an on-base guy, a speed-type player and a hustler. He’s a Craig Counsell-type player who really plays hard, hustles, and knows how to play.” If you were to bullet-point Moore’s statement, it would look like this:

  • On-base guy
  • Speed-type player
  • Hustler
  • Craig Counsell-type player
  • Plays hard
  • Hustles
  • Knows how to play

That reads like the five paragraph essays I used to write in high school. I always wanted three examples but sometimes couldn’t think of three, so I would bust out the thesaurus and find synonyms (hustler, plays hard, hustles) so I could make the required word count. Bravo, Dayton Moore, bravo. Also, there’s this:

In his first year in Kansas City, Bloomquist played in a career-high 125 games, getting 468 plate appearances and hitting .265/.308/.355. He lived up to his “speed-guy” label by stealing a team-leading 25 bases. He was worth -0.1 WAR, almost exactly replacement-level, but WAR doesn’t measure intangibles, so we really don’t know his true value that year. He may have led the league in Hustle WAR and Knows How To Play WAR while likely finishing second to Craig Counsell in Craig Counsell WAR.

Other than the ample playing time, this 2009 season is the epitome of Willie Bloomquist. His triple-slash line, his walk rate, his strikeout rate, they were all very close to his career numbers. He also played every position except pitcher and catcher that year. Yep, in 2009 Willie Bloomquist was about as Willie Bloomquist as Willie Bloomquist could be.

His second year with the Royals did not go as well and he was sold to the Reds in September of 2010. I don’t know how much a 2010 Willie Bloomquist went for, but hopefully the Reds got a good deal.

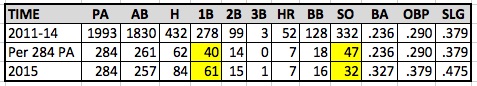
In January of 2011, Willie Bloomquist got another free agent deal, this time signing with the Arizona Diamondbacks for one year. This was another quintessential Bloomquistian season. He played 97 games, had 381 plate appearances, and hit .266/.317/.340 (nearly a match for his .269/.316/.342 career batting line). He was worth 0.0 WAR.

This 2011 season was also the only season Willie got a taste of postseason play. In a five-game Division-Series loss to the Brewers, Bloomquist hit .318/.348/.318 with three steals. Yep, Willie Bloomquist has a career .318 average in the postseason, 10 points higher than Derek Jeter (yeah, I know there’s a difference of 153 games played. It’s not Willie’s fault he didn’t get the opportunities Jeter had. Don’t be a hater).

After Bloomquist’s 0.0 WAR season with the Diamondbacks, he re-signed with the team on a two-year, $3.8 million contract and had seasons worth 0.4 and 0.5 WAR. When Bloomquist’s contract expired after the 2013 season, the Diamondbacks didn’t look like they had room on the roster for Willie B, which led to this headline from the AZ Central: “Arizona Diamondbacks brace for departure of Willie Bloomquist.” I wonder how one braces for the departure of Willie Bloomquist? Does it involve eating chips and drinking beer?

According to the article, the Diamondbacks wanted Willie back for 2014, but the market for his services was moving quickly. “We like him a lot and would love to have him back,” Towers said. “But my sense is there are going to be some clubs after him aggressively early.” Hmm. A free-agent battle for a 36-year-old Willie Bloomquist. Well, I’ll be.

Apparently, the booming market for Willie Bloomquist resulted in the Seattle Mariners outfoxing their competition by signing Bloomquist to a two-year, $5.8 million deal. That’s not a bad chunk of change for “Mr. Replacement Level” (when the Moneyball-like film comes out about “Mr. Replacement Level”, Bloomquist will be played by Ben Foster, the Willie Bloomquist of Hollywood. If you don’t know who Ben Foster is, well, that’s why he’s the Willie Bloomquist of Hollywood).

Bloomquist was close to his typical self in his first season back with the Mariners, accounting for 0.1 WAR despite an ugly .297 OBP (and that was with a .356 BABIP). Once again, he was tabbed to fill in at every position on the diamond except for catcher and center field. He only stole one base, though, and had the lowest walk rate and highest strikeout rate of his career. It almost looked like age was catching up to Willie Bloomquist, but that could not possibly be true because Willie Bloomquist had seemingly not aged in more than a dozen years.

Sadly, it may be the end of The Willie Bloomquist Experience. His intangibles couldn’t make up for a .159/.194/.174 batting line and the Mariners have designated him for assignment. Maybe he will be picked up by another Major League team (or the Phillies) and he’ll bang out a .265/.315/.340 stretch one last time.

Despite his 14 years of ever-so-slightly-above replacement level play, I have to give credit to Willie Bloomquist. He played hard and he was willing to man most any position on the diamond. If you needed a bunt, Willie would bunt. In his early days, he could pinch-run and steal you a bag in a high-leverage situation. He must have been a great guy in the clubhouse to last as long as he did and he may not be done just yet. Jeff Francoeur hasn’t been above replacement level since 2011 and he’s still playing. As long as Francoeur continues to get work, there’s hope for Willie Bloomquist. If he isn’t signed by a Major League team (or the Phillies), he can be proud of what he accomplished in the big leagues.


Hardball Retrospective – The “Original” 1948 Cleveland Indians

In “Hardball Retrospective: Evaluating Scouting and Development Outcomes for the Modern-Era Franchises”, I placed every ballplayer in the modern era (from 1901-present) on their original team. Therefore, Mark Grace is listed on the Cubs roster for the duration of his career while the Dodgers declare Frank “Hondo” Howard and the Diamondbacks claim Dan Uggla. I calculated revised standings for every season based entirely on the performance of each team’s “original” players. I discuss every team’s “original” players and seasons at length along with organizational performance with respect to the Amateur Draft (or First-Year Player Draft), amateur free agent signings and other methods of player acquisition.  Season standings, WAR and Win Shares totals for the “original” teams are compared against the “actual” team results to assess each franchise’s scouting, development and general management skills.

Expanding on my research for the book, the following series of articles will reveal the finest single-season rosters for every Major League organization based on overall rankings in OWAR and OWS along with the general managers and scouting directors that constructed the teams. “Hardball Retrospective” is available in digital format on Amazon, Barnes and Noble, GooglePlay, iTunes and KoboBooks. The paperback edition is available on Amazon, Barnes and Noble and CreateSpace. Additional information and a discussion forum are offered at TuataraSoftware.com.

Don Daglow (Intellivision World Series Major League Baseball, Earl Weaver Baseball, Tony La Russa Baseball) contributed the foreword for Hardball Retrospective. The foreword and preview of my book are accessible here.

Terminology

OWAR – Wins Above Replacement for players on “original” teams

OWS – Win Shares for players on “original” teams

OPW% – Pythagorean Won-Loss record for the “original” teams

Assessment

The 1948 Cleveland Indians         OWAR: 57.9     OWS: 291     OPW%: .606

GM C.C. Slapnicka acquired 52.5% (21/40) of the ballplayers on the 1948 Indians roster. Based on the revised standings the “Original” 1948 Indians outpaced the Red Sox, taking the American League pennant by eight games.

Lou Boudreau set personal-bests with a .355 batting average, 199 base hits, 18 dingers and 106 ribbies. “Old Shufflefoot” earned the 1948 American League MVP award and made his seventh All-Star appearance. Tommy “Old Reliable” Henrich (.308/25/100) topped the circuit with 138 runs scored and 14 triples. Ken Keltner posted career-highs in home runs (31), RBI (119) and runs (91). Larry Doby contributed a .308 BA with 83 tallies in his first full season. Jeff Heath swatted 20 big-flies and hit .319 for the Tribe while Dale Mitchell supplied a .336 BA with 204 base knocks and 30 two-baggers. Five-time All-Star backstop Jim “Shanty” Hegan clubbed 21 doubles and 14 taters.

Larry Doby placed 11th among center fielders according to Bill James in “The New Bill James Historical Baseball Abstract.” Thirteen teammates join him in the top 100 rankings including Lou Boudreau (12th-SS), Bob Feller (12th-P), Al Rosen (14th-3B), Sherm Lollar (31st-C), Tommy Henrich (34th-RF), Ken Keltner (35th-3B), Jeff Heath (44th-LF), Jim Hegan (44th-C), Bob Lemon (48th-P), Ray Boone (69th-3B), Eddie Robinson (86th-1B), Phil Masi (93th-C) and Dale Mitchell (95th-LF).

LINEUP POS WAR WS
Lou Boudreau SS 9.79 34.4
Ken Keltner 3B 6.34 24.93
Tommy Henrich 1B/RF 5.76 28.94
Larry Doby CF 3.34 18.28
Jeff Heath RF/LF 3.25 20.16
Dale Mitchell LF 2.97 20.43
Jim Hegan C 1.7 17.08
Jack Conway 2B 0.13 1.4
BENCH POS WAR WS
Eddie Robinson 1B -0.3 9.18
Dick Kokos RF 0.63 7.03
Phil Masi C 0.46 9.73
Mike McCormick LF 0.4 10.59
Hank Edwards RF 0.36 4.46
Joe Tipton C 0.32 2.97
Pat Seerey RF 0.25 9.75
Cliff Mapes LF 0.18 2.1
Ray Boone SS 0.07 0.28
Al Rosen 3B -0.05 0.02
Ray Murray -0.06 0
Pete Milne CF -0.19 0.07
Sherm Lollar C -0.38 0.4
Johnny Blatnik LF -0.47 8.46
Ralph Weigel C -0.5 1.25

Bob Lemon (20-14, 2.82) paced the Junior Circuit with 293.2 innings pitched, 20 complete games, 10 shutouts and a 1.226 WHIP. Johnny “Bear Tracks” Schmitz earned his second All-Star nod with a record of 18-13 along with a 2.64 ERA while Joe “Burrhead” Dobson (16-10, 3.56) made his lone appearance in the Mid-Summer Classic. Allie Reynolds (16-7, 3.77) battled control problems as he yielded over 100 walks eight times in his first nine seasons. Bob Feller (19-15, 3.56) led the League in strikeouts.

ROTATION POS WAR WS
Bob Lemon SP 7.06 25.52
Johnny Schmitz SP 3.99 22.37
Joe Dobson SP 3.68 19.36
Allie Reynolds SP 3.46 15.58
BULLPEN POS WAR WS
Steve Gromek SW 1.48 9.66
Mike Garcia RP 0.1 0.26
Ernest Groth RP -0.05 0
Hal White RP -0.67 0.77
Bob Feller SP 2.38 16.44
Sheldon Jones SP 2.33 14.58
Satchel Paige SP 1.72 6.79
Denny Galehouse SP 1.49 9.68
Red Embree SP 0.68 4.61
Doyle Lade SP 0.21 4.56
Thornton Lee SP -0.26 0.84
Ray Poat SP -0.89 5.92
Bryan Stephens SP -1.25 1.84


The “Original” 1948 Cleveland Indians roster

NAME POS WAR WS General Manager Scouting Director
Lou Boudreau SS 9.79 34.4 C.C. Slapnicka
Bob Lemon SP 7.06 25.52 C.C. Slapnicka
Ken Keltner 3B 6.34 24.93 C.C. Slapnicka
Tommy Henrich RF 5.76 28.94 Billy Evans
Johnny Schmitz SP 3.99 22.37 C.C. Slapnicka
Joe Dobson SP 3.68 19.36 C.C. Slapnicka
Allie Reynolds SP 3.46 15.58 C.C. Slapnicka
Larry Doby CF 3.34 18.28 Bill Veeck
Jeff Heath LF 3.25 20.16 C.C. Slapnicka
Dale Mitchell LF 2.97 20.43 Roger Peckinpaugh
Bob Feller SP 2.38 16.44 C.C. Slapnicka
Sheldon Jones SP 2.33 14.58 C.C. Slapnicka
Satchel Paige SP 1.72 6.79 Bill Veeck
Jim Hegan C 1.7 17.08 C.C. Slapnicka
Denny Galehouse SP 1.49 9.68 Billy Evans
Steve Gromek SW 1.48 9.66 C.C. Slapnicka
Red Embree SP 0.68 4.61 C.C. Slapnicka
Dick Kokos RF 0.63 7.03 Roger Peckinpaugh
Phil Masi C 0.46 9.73 C.C. Slapnicka
Mike McCormick LF 0.4 10.59 C.C. Slapnicka
Hank Edwards RF 0.36 4.46 C.C. Slapnicka
Joe Tipton C 0.32 2.97 C.C. Slapnicka
Pat Seerey RF 0.25 9.75 Roger Peckinpaugh
Doyle Lade SP 0.21 4.56 C.C. Slapnicka
Cliff Mapes LF 0.18 2.1 C.C. Slapnicka
Jack Conway 2B 0.13 1.4 C.C. Slapnicka
Mike Garcia RP 0.1 0.26 Roger Peckinpaugh
Ray Boone SS 0.07 0.28 Roger Peckinpaugh
Al Rosen 3B -0.05 0.02 Roger Peckinpaugh
Ernest Groth RP -0.05 0 Bill Veeck
Ray Murray -0.06 0 Roger Peckinpaugh
Pete Milne CF -0.19 0.07 Roger Peckinpaugh
Thornton Lee SP -0.26 0.84 Billy Evans
Eddie Robinson 1B -0.3 9.18 Roger Peckinpaugh
Sherm Lollar C -0.38 0.4 Roger Peckinpaugh
Johnny Blatnik LF -0.47 8.46 C.C. Slapnicka
Ralph Weigel C -0.5 1.25 Roger Peckinpaugh
Hal White RP -0.67 0.77 C.C. Slapnicka
Ray Poat SP -0.89 5.92 Roger Peckinpaugh
Bryan Stephens SP -1.25 1.84 Bill Veeck


Honorable Mention

The “Original” 1999 Indians   OWAR: 55.5     OWS: 298     OPW%: .555

The Tribe outdistanced the Royals and White Sox by eight games en route to claiming the 1999 American League pennant. Manny Ramirez (.333/44/165) secured his lone RBI title and finished third in the MVP balloting. Brian S. Giles slammed a career-best 39 circuit clouts, knocked in 115 baserunners and registered 109 tallies while batting .315. Jim Thome topped the leader boards with 127 bases on balls and slugged 33 four-ply swats. Albert Belle walloped 37 round-trippers and plated 117 baserunners. Sean Casey aka “The Mayor” achieved All-Star status with a .332 BA, 42 doubles, 25 home runs and 99 ribbies. Bartolo Colon fashioned a record of 18-5 with a 3.95 ERA.

On Deck

The “Original” 1946 Tigers

References and Resources

Baseball America – Executive Database

Baseball-Reference

James, Bill. The New Bill James Historical Baseball Abstract. New York, NY.: The Free Press, 2001. Print.

James, Bill, with Jim Henzler. Win Shares. Morton Grove, Ill.: STATS, 2002. Print.

Retrosheet – Transactions Database

Seamheads – Baseball Gauge

Sean Lahman Baseball Archive


Best and Worst of the Offseason Acquisitions Thus Far

As we hurtle toward the season’s midpoint, it may be worth pausing to assess how some of last winter’s player moves have turned out. Herewith, the five best and five worst players to date (by fWAR) who changed uniforms during the off season.

Top 5

Josh Donaldson (4.4)

When asked last October whether the A’s would trade Josh Donaldson, an unnamed A’s official said “That would be stupid!” (h/t MLB Trade Rumors). But then suddenly it wasn’t. Maybe Billy Boy really did trade Donaldson in a fit of pique, or maybe the trade was yet another example of the man’s Machiavellian genius. Either way, there’s no getting around the fact that Donaldson is tied for 4th in WAR in the charted universe as of this writing. Donaldson is a key contributor to an MLB-leading offense that has scored 70 more runs than its nearest competitor. Toronto’s mighty +94 run differential bestes even that of the mighty St. Louis “Marked” Cards (+91), and the Blue Jays’ Wins per FBI Interview stands at infinity, blowing away the Cardinals’ ratio. It’s possible that Beane doesn’t regret the Donaldson move; it’s certain that Alex Anthopolous doesn’t.

Max Scherzer (4.2)

Max Scherzer has 130 Ks this season, which would place him 71st on the all time Expos/Nats single season list. And the season, as discerning readers will have already realized, in only half over. The same readers will have divined that Scherzer is on a pace for 260 Ks, which would put him second on the all time list behind Pedro Martinez, who racked up 305 in 1997. Scherzer is absolutely blowing away every one of his career rate stats this season. Can he keep the regression demons at bay until he gets a World Series ring? The Nationals certainly hope so, as do these guys. More evidence for the theory that playing at the top of the free agent market can be costly, yet cost-effective.

Dee Gordon (3.0)

Dee Gordon’s OPS is 60 points above his career average. Dee Gordon’s BABIP is 70 points above his career average. Dee Gordon’s closest comp through age 26, according to Baseball Reference, is Chippy McGarr. So no, it isn’t going to last, but it’s been a fun ride. One can only wish that Gordon’s magical half-season had been in the service of a better cause than this one. To be fair, a variety of defensive metrics are in agreement that Gordon has become an asset at second, and of course he’s got those wheels, so he’ll still have value even when his Inner McGarr ultimately gets the better of him.

Russell Martin (2.9)

The second Blue Jay on this list – yes, this might finally be Anthopolous’ year. Martin’s contract will rapidly move from buzz to hangover, but right now the party is still hot. Only Buster Posey is putting up better numbers behind the plate, and unlike Martin, he’s not behind the plate all the time, instead getting a fair number of starts at first. Like the others mentioned above, Martin is having something of a career year, but his numbers this year aren’t wildly above his career stats (.363 wOBA this year vs. .336 for his career). His BABIP this year (.298) is just a little higher than his career mark (.289). So there’s reason to believe his success will continue as long as he avoids injury. And he’s Canadian.

A.J. Burnett (2.7)

Don’t tell him it’s a young man’s game. Burnett, at age 38, is the 4th oldest starter in the majors, behind Bartolo Colon (42), R.A. Dickey (40), and Tim Hudson (39). He has the highest K/9 among this group (7.7), and by far the lowest FIP (2.97). Burnett’s fastball velo is sitting at 91.1, off of his career mark of 93.5, but it’s not a yawning gap. Burnett is kind of the anti-Scherzer, a bargain free agent that Neal Huntington was able to sign for a 1-year, $8.5m deal. Like Dan Duquette, Huntington has done a good job shoring up his roster with effective store brands such as Jung-ho Kang, Francisco Cervelli, and Burnett. The Pirates have stars too, more than next year’s Orioles will, but they do a better a job than most in making sure that no roster slot gets left behind.

Bottom 5

Matt Kemp (-1.0)

Kemp is putting up the worst triple slash (.244/.279/.365) and ISO (.122) numbers of his career. His defense remains R-rated. The Dodgers are paying Kemp $32 million to play for division rival San Diego. So far, it’s been a stellar investment.

Melky Cabrera (-1.0)

Not all dumpsters have stuff worth diving for. Skim Melk has returned to his bad old (pre-PED?) powerless ways. His ISO is a microscopic .067, lowest of his career and 8th lowest in the Show. Most of the other 7 guys are middle infielders. Rick Hahn has made a valiant effort to paper over the White Sox’ roster holes with veterans until he can rebuild a desolate farm system, but with mixed results. Adam LaRoche and Geovany Soto have been pretty effective, but Cabrera and Emilio Bonifacio have generated outs at the same rate the Dan Ryan generates traffic jams.

Kyle Kendrick (-0.9)

Ok, raise your hand if you think putting a fly-ball, high-contact pitcher in Coors is a good idea.

Pablo Sandoval (-0.6)

In 2011 Panda put up a .315/.357/.552 line. In 2012 he lost 100 points of slugging. In 2013 he lost 30 more. In 2014 he lost 20 points of OBP.  This year, he’s lost 10 more, along with another 15 missing SLG. His UZR/150 is at -26.2, which approximates the performance of an actual panda. This long steady performance collapse looks like something that happens to players in their early to mid-30s, but Sandoval is only 28. As Dayn Perry has noted, “Sandoval’s relationship with basic conditioning is complicated,” and it’s not clear that a manager on the bubble like John Farrell will be able to convince Sandoval to put his shoulder to the workout wheel (uh … the UZR/150 of that metaphor is probably -26.2). Sandoval has through 2019 to find a Red Sox treadmill routine that works for him. Which I’m sure makes Sawx fans ecstatic.

Billy Butler (-0.4)

In 2014 Butler put up a wRC+ of 97, craptastic for a player who has no non-hitting skills of note. This year, his wRC has surged to … 97.  The good news is that he’s held his ground despite playing half his games in the Mausoleum. The bad news is that the ground he’s holding isn’t worth much. At 3 years/$30m, Butler’s contract is reasonable by today’s standards. But it appears that the other Billy may have made a basic roster management error here by signing a middling free agent for middling money. Until the Oakland A’s become the San Jose PayPals, this is the kind of mistake the franchise can ill afford.


Victimized by Infield Hits

We see it every night. A weak groundball to a defensively incapable player, a broken-bat roller behind the mound into no-man’s-land, a slap hit into the vacated area caused by the shift, a tomahawk chop resulting in a dirt-bounce that goes 20 feet upward. Not good enough to be a true hit, not bad enough to be an error. Infield hits are awkward.

“It’ll look like a line drive in the box score,” the broadcasters chirp happily. And while that’s very true, I would argue that infield hits are ESPECIALLY demoralizing for pitchers. Usually, the pitcher made a quality pitch, got the groundball he was looking for, and had little control over the infield defensive positioning or assignments. But because the official scorer ruled the play too difficult for a fielder to make, any runs driven in by the infield hit or resulting later in the inning will be earned.

Infield hits are the result of bad defensive skill, poor defensive positioning, poor use of the shift, sloppy weather conditions, speedy runners, jittery infielders, and/or good old fashioned bad luck. So which pitchers have been victimized the most by infield hits? Let’s look at the numbers for each league.

American League pitchers have allowed 9,650 hits, including 1,166 infield hits (as of June 29). The infield hits/hits rate in the American League, therefore, is 12.1%.

The Athletics’ defense ranks worst in the American League with a -23.9 UZR, and the team’s two best starters suffer a plethora of infield hits allowed. Take out Gray’s 17 infield hits allowed, and his already pristine 0.99 WHIP falls to 0.84 WHIP. Without the infield hits, Chris Sale of Chicago would also see his WHIP drop to a crazy 0.82 WHIP. (The ChiSox need to figure out how to shift.) Keuchel is the king of groundballs (64.5% GB), so infield hits are only natural to him. Same goes for Madson and his 56.4% GB rate. The Yankees’ middle infield has been miserable this year, and the team doesn’t know how to shift properly. Warren, Rogers, and Betances have been the poor-luck “beneficiaries.”

Nate Karns (45.4% GB) and Brad Boxberger (36.6% GB) are the real enigmas here, as the Rays have the second-best defense in the AL. Bad luck? Infielders hate them? Poor use of the shift by Tampa Bay coaches? According to Inside Edge, Rays defenders make only 4% of very difficult plays, labelled “remote.” Since these plays are too difficult to be ruled an error if the defender miffs, these balls in-play are often ruled infield hits (if, of course, they occur on the infield). For the curious, the Yankees are dead last (1.2%), and the Blue Jays are first (19%).

Zach Britton’s rate really jumps out, but it is most likely a result of very few hits allowed overall and, as with all the relievers, a small sample size. Britton has only allowed 28 hits on the season, and only 17 have left the infield. Dominant.

National League pitchers have allowed 9,892 hits, including 1,174 infield hits (as of June 29). The infield hits/hits rate in the National League, therefore, is 11.8%.

Noah Syndergaard (16.6% infield hits/hits) just missed this list, so that’s three Mets starters who have allowed way more infield hits than the average NL starter. The Mets have already taken Wilmer Flores off shortstop, but Eric Campbell (-1.1 UZR) and Daniel Murphy (-2 UZR) aren’t helping either. Brett Anderson (68.7% GB rate) is the most predictable pitcher on this chart, but Alex Wood and Shelby Miller are not, especially since 2B Jace Peterson and SS Andrelton Simmons flash the leather on a nightly basis. (Do the Braves  suffer from the Dee Gordon effect or just from poor use of the shift?)

The Cardinals infield has been below average defensively (Matt Carpenter -1.6 UZR; Mark Reynolds -1.6 UZR; Jhonny Peralta -1.1 UZR), which partially explains Lynn and Rosenthal. Starlin Castro (-3.4 UZR) and Arismendy Alcantara (-2.0 UZR) have not helped out Hendricks or Strop defensively either. Benoit is on the wrong team defensively to have a career-high ground ball rate (43.6%).

Finally, who has been stingy with infield hits? For the American League:

And for the National League:

Just something else Max Scherzer has been amazing at in 2015.


Mike Moustakas Is Reverting Back to Mike Moustakasness

Coming into this season, the major league career of Mike Moustakas had been underwhelming. Underwhelming is probably kind, really. After being the second overall pick in the 2007 draft (behind David Price), Moustakas progressed through the minor leagues with consistently above average seasons. Before reaching the major leagues in the middle of the 2011 season, Moustakas had a minor league batting line of .282/.327/.503. From 2008 to 2011, Moustakas was ranked 18th, 13th, 80th, and 9th on the Baseball America Top 100 Prospects list.

Then he reached the Major Leagues. In his first three-and-a-half seasons with the Royals, Moustakas proved to be a below-average major league hitter, starting with an 84 wRC+ in 89 games during his rookie year, followed by 90, 77, and 76 wRC+ seasons from 2012 to 2014. Over this stretch, Moustakas hit .236/.290/.379, good for a .293 wOBA and 82 wRC+. His wRC+ placed him 177th out of 186 hitters with 1500 or more plate appearances. From 2011 to 2014, Moustakas had been a worse hitter than Ruben Tejada, Jeff Francouer, and Kurt Suzuki, among others.

This season has been a whole new world for Moustakas. He is currently hitting .328/.379/.478 and has a 141 wRC+. After being below average for the first four years of his career, he is now hitting at a well above average rate.

So what has changed?

The first glaring thing to notice is Moustakas’ .350 BABIP. In his first four seasons, Moustakas had a BABIP of .260. This sky-high BABIP for Moustakas explains much of his success this season. He isn’t hitting for any more power than he did before. His rate of doubles, triples, and home runs in 2015 are right in line with his rate of extra base hits previously. He’s also walking less often than he had in the past (and striking out less often). The difference in Mike Moustakas from 2011-2014 and Mike Moustakas in 2015 is a big increase in the number of singles and a decrease in strikeouts. The chart below shows Moustakas’ 2011-2014 numbers pro-rated to his current 284 plate appearances (as of June 25). As you can see by the columns highlighted in yellow, the “new” Mike Moustakas has 21 more singles and 15 fewer strikeouts than the “old” Mike Moustakas would have.

I took his current stats and adjusted his .350 BABIP down to his pre-2015 career mark of .260, with all of his “eliminated” hits being singles, and his batting line drops to .251/.306/.401. This shows just how much BABIP is influencing Mike Moustakas’ breakout season. That .251/.306/.401 line is better than his pre-2015 career mark of .236/.290/.379, but it’s not that much better. It would only be a slight improvement and nothing like what he is actually doing this year.

So, Moustakas’ BABIP is the main reason for his success this season. Looking at his walk and strikeout rates, we find that he’s walking slightly less often than he had previously (5.4% this year compared to 6.4% from 2011-14). His strikeout rate is also down, from 16.7% coming into this season to 11.1% so far this year. Perhaps he is focusing more on making contact than he had in the past. This would fit in with what looks to be a philosophy of the franchise. The Royals have struck out less often this year than any team in baseball. Since 2010, the Royals have been the hardest team to strike out in four seasons (including 2015) and near the top of the list in strikeout avoidance in the other two seasons. For his part, Moustakas has steadily dropped his strikeout rate from 20.2% in 2012 down to this year’s 11.1%.

Early in the year, Jeff Sullivan wrote about Moustakas’ first opposite field home run . . . ever. He pointed out that Moustakas was hitting the ball to the opposite field during spring training much more often than he ever had. The Kansas City Star had an article in February about Moustakas working on hitting to the opposite field to combat the infield shift, which he had seen more of in 2014 than in previous seasons. In May, an article at Grantland continued with this theme, pointing out that Moustakas was leading the league in opposite field hits at the time and had dropped down a couple bunts against the shift in April. With this in mind, perhaps Moustakas’ .350 BABIP in 2015 is due to his newfound ability to hit to the opposite field?

With almost three months of the season in the books, we can look at some batted ball data. When it comes to hitting the ball to the opposite field, Moustakas is going the other way much more often than he had in the past.

Moustakas has hit the ball the other way 31.4% of the time in 2015, compared to 21.7% of the time in the four previous seasons. He’s hit the ball to center just about as often as ever, so all of that opposite field contact has meant fewer balls hit to his pull field. As for soft, medium, and hard hit percentage, his profile hasn’t changed much; just a slight increase in hard hit percentage.

Along with more balls being hit the other way, Moustakas has hit more balls on the ground. You’d expect a big guy like Moustakas to hit the ball in the air with power, which he did better than he ever had during the post-season last year when he hit five home runs in 55 plate appearances. Instead, this season Moustakas is hitting the ball on the ground more often. So far, it’s working.

Considering that Moustakas is hitting better than he ever has, perhaps he’s figured something out and this is the new Mike Moustakas, a guy who hits the ball on the ground and to the opposite field more often than he ever did and the result is a shiny .350 BABIP.

Except it doesn’t look like this is the case when you take a closer look. Moustakas may have been a new man during spring training and in the first part of the year but he’s looking more like his old self recently.

Using monthly splits means slicing up data into arbitrary points, I know, but it’s not hard to see a reverting to old form when looking at Moustakas’ monthly opposite field percentage numbers. He hit the ball the other way 39% of the time in April, around 31% of the time in May and 23% of the time in June so far. His directional hitting numbers in June are all fairly close to his pre-2015 numbers. It looks like Moustakas was doing something different early in the year but that is no longer the case.

The interesting thing is that he’s continued to be productive and continued to post a high BABIP (.377 in April, .301 in May, .373 in June). He’s also hit the ball hard more frequently in June (36.2%) than he had in April (26.8%) and May (24.0%) and he’s continued to hit more ground balls than he had in previous seasons.

I don’t know how to find data on how often teams are shifting against Moustakas and if that information is broken down by month. The Grantland article referenced above pointed out that he had been shifted against 70.7% of the time in 2014 and just under 60% of the time in 2015 (the article was posted on May 5) and suggested that his ability to hit to the opposite field in April may have resulted in teams shifting less often. If this is true, then his reversion back to pulling the ball in June could be Moustakas adjusting to the adjustments of the opposing defense. It could be that Moustakas began the year facing a shifted defense a high percentage of the time and responded by hitting to the opposite field (39% of the time in April). Then teams may have gone away from the shift against Moustakas sometime in May and Moustakas has responded by pulling the ball more often (going opposite field just 23% of the time in June). This is speculation, of course, since I don’t know the shifting patterns of defenses facing Moustakas.

On the other hand, it could be that the BABIP-Gods are smiling down upon him so far this year and all of this batted ball talk is meaningless. Personally, I’m tempted to lean this direction. Moustakas is currently 18th out of 161 qualified hitters in BABIP. Of this group of hitters, Moustakas is 81st in line drive percentage, 88th in infield hit percentage, and 100th in hard-hit percentage. He’s also hit infield flies at a very high rate (16.5% IFFB%), with just 10 hitters popping out more often than Moustakas. There are just too many indicators suggesting he won’t continue to have a .350 BABIP, especially if he’s no longer taking advantage of shifted defenses by hitting the ball to the opposite field like he did early in the season.

For their part, ZiPS and Steamer see improvement but not earth-shattering improvement. For the rest of the season, they project a .289 and .280 BABIP, respectively, with wOBAs of .322 and .324, making him a slightly above-average hitter going forward (104 wRC+ and 106 wRC+). That’s not as bad as the old Mike Moustakas but it’s not all that new-and-improved either.


Hit More Fly Balls, Wilson Ramos!

Wilson Ramos is currently third on the Nationals with 7 home runs. He has done that on 41 fly balls, for a HR/FB rate of 17.1%. But Ramos has also hit the ball on the ground in play 103 times. Throw in his 37 line drives and that’s a ground ball rate of 56.9%. For a guy as slow as Ramos, how can that be good?

Ramos has always hit the ball on the ground, however. His career ground ball rate is 54.3%. He has a career average of .206 on those grounders. That is below average, as you’d expect.

Meanwhile, he hits fly balls 27.5% of the time for his career, and homers on 16.6% of his flies. That’s better than the career rates of Jose Bautista (16.5%), Todd Frazier (15.8%), Adam Jones (15.2%), Adam LaRoche (15.0%). It’s better than a lot of players who are known for their power.

The difference, of course, is the in the fly-ball rates. Bautista has a career 45.5% FB% mark. Frazier’s is 40.8% for his career. Jones, 33.4%. LaRoche, 41.2%. And there’s Ramos with a paltry 27.5%.

But here’s possibly the most startling statistic: of 703 qualifiers since 2002, Wilson Ramos ranks 57th in HR/FB and 648th in FB%.

Ramos clearly has power just from watching him, and when he gets the ball in the air, he can hit it out. When he hits it on the ground, his speed makes him less likely than most to reach base.

So why is he hitting the ball on the ground more than half the time?

There might be a good answer to that question, but if he starts to hit more fly balls, there might be a rather less good answer to this question:

Why didn’t he start doing this sooner?

(Cross-posted at federalbaseball.com)