Archive for July, 2015

Introducing the ODIEs Projection System

Projecting baseball players has been a hobby of mine for the past 2 seasons. I would like to openly thank FanGraphs for the ease of accessing data to build a system for projections, as well as inspiration start this project from Tom Tango, Dan Syzmborski, Jared Cross (and team at Steamer) and all of the great researchers here at FanGraphs for pushing me to learn and try new things in creating a projection system.

The ODIEs (Oden Decision & Information Enhancement system) of projecting players is not all that dissimilar from Steamer and ZiPS found here at FanGraphs. My methodology for creating hitter and pitcher projections are as follows:

1. Weighted average of the last 3 years of player data depending on service time. Minor League Equivalencies are done for players with less than 3 years of service time.

2. Regressed stats based on league, park, and position type (C, 1B/3B, 2B/SS, OF, and SP/RP)

3. Adjusting for Age

4. Adjustments for Pitcher Velocity and Hitter Contact (Soft, Medium, & Hard)

5. Rest of Season Projections are weighted by Pre-Season and Actual stats for the 2015 season. I also readjust Rest of Season projections based on the criteria in point #4.

The major difference (that I can tell) in the ODIEs system to other successful systems is the incorporation of how stats are regressed and the adjustments for Velocity and Hitter Contact.

The files below will take you to the projections for both Hitters and Pitchers – here are some details to note:

1. There are three tabs for Pre-Season Projections, Rest of Season Projections (updated as of 7/23 games), and Total Projections using Real Data and Rest of Season Projections.

2. Each tab has a Criteria Search function that you can manipulate data in, the “Classification” column will change based on the results of your entries.

3. Fantasy Points, Points per game, PAR, and PAPAR values are all based on Ottoneu points scoring

I hope these projections are of use to anyone in Fantasy leagues, interested in player analysis, or anyone looking to push me to create the best projection system I can.

Link to Hitter Projections: https://www.dropbox.com/s/kyfr4i19nsn6hc4/ODIES_Shared_Hitters.xlsx?dl=0
Link to Pitcher Projections: https://www.dropbox.com/s/8t4ovkouir8f2sf/ODIES_Shared_Pitchers.xlsx?dl=0

Thanks, and I welcome and feedback or questions on this project.


A Quick and Dirty Attempt to Find Justin Upton’s Trade Value

Players like Justin Upton aren’t usually available at the trade deadline. Upton ranks 35th in wOBA (.353) and 47th in WAR (8.9) between 2013 to the present.  Also of note, Upton is in his walk year.

So, how many players like Justin Upton have been traded in the past 10 years? I did a quick scan of deals made in June and July since 2005 and I found four similar players who were traded in their walk years.

1. Hunter Pence PHI->SF, 2012 (68th wOBA (.347) and 68th WAR (8.7), 2010-2012)

2. Carlos Beltran NYM->SF, 2011 (19th wOBA (.379) and 74th WAR (8.1), 2009-2011)

3. Matt Holiday OAK->STL, 2009 (4th wOBA (.410) and 6th WAR (18.2), 2007-2009)

4. Mark Teixiera ATL -> LAA (15th wOBA (.396), 17th WAR (14.8), 2006-2008)

The Mets received Zack Wheeler in return for Beltran and the Athletics received Brett Wallace in return for Holliday. Baseball America ranked Wheeler the 55th best prospect pre-2011 and Wallace was ranked 40th pre-2009. In the following years, pre-2012 and pre-2010, respectively, Wheeler was ranked 35th and Wallace was ranked 27th.

The Mets and Athletics did well in each trade. They received top prospects and non-deteriorating prospects (they were not losing value as prospects during the year they were traded for). This is evidenced by the ranking of Wheeler and Wallace in the season following the trade.

The Pence and Teixiera trades did not net the Phillies or Braves prospects. Each team received a major league asset, using “asset” in the loosest of ways.

The Phillies received Nate Schierholtz, who had totaled .9 WAR up to that point in 2012. They also received Seth Rosin, an A Ball pitcher, and Tommy Joseph, a AA catcher. Essentially, they received a replacement level player and organizational depth. 

The Braves received Casey Kotchman. Kotchman had totaled 2.1 WAR in 2008 with the Angels before the trade. He managed 3.7 WAR the year before. The Braves could not expect Kotchman to live up to his past billing (he was Baseball America’s 6th ranked prospect pre-2005), however, from the most optimistic perspective, they may have expected him to be worth 2 WAR per year over the remaining four years of team control. At least this is my best attempt to get in the head of the Braves’ front office seven years after the fact.

Now, I’ll attempt to determine Justin Upton’s trade value based upon these past trades.

Kevin Creagh and Steve DiMiceli published a study on Point of Pittsburgh that analyzed the value and future performance of prospects based on their ranking in the Baseball America’s Top 100 (the ranking was determined by the final appearance of the prospect in the rankings).  The article has a lot of information you should read regarding the dollar value of prospects and their potential to bust, but for purposes of this article, I am concerned with a prospect’s projected WAR over the six years of team control.

Hitters that rank between #26-50, which is Brett Wallace, project to have an average of 6.8 WAR. Pitchers ranked between #51-75 project to have 3.8 WAR. However, based on Wheeler’s fast rise up Baseball America’s list, I’ll factor in that pitchers ranked between #26-50 project to have 6.3 WAR. The average of the two is 5 WAR, which is the value I’ll place on Wheeler at the time the Mets traded for him.

Justin Upton is not Matt Holliday, circa 2009, and he is not quite Carlos Beltran, circa 2011, although he is much less of an injury risk than 2011 Beltran (who would go on to spend time on the DL for the Giants in 2011). Therefore, I project that the Padres should receive between 3.8-5.0 WAR in return for Upton. The return should scale up towards the higher side of that projection based upon an active and interested market for Upton.

Below is a list of potential Upton suitors and their prospects that appeared in Baseball America’s Top-100 rankings before the season began. The rank of the prospect is in parenthesis, followed by their Creagh and DiMiceli projected WAR. The prospects in bold represent the most likely return for Upton, however I included some prospects that are possibilities, but project to have more WAR value than should be expected in return for Upton.

Mets – Brandon Nimmo (45, 6.3), Dilson Herrera (46, 6.3), Amed Rosario (98, 4.1). I excluded Kevin Plawecki (63) and Michael Conforto (80) due to their major league role and rise to prominence, respectively. 

Pirates – Jameson Taillon (29, 6.3); Austin Meadows (41, 6.8); Josh Bell (64, 5); Reese McGuire (97, 4.1)

Cubs – C. J. Edwards (38, 6.3); Billy McKinney (83, 4.1)

Giants – Andrew Susac (88, 4.1)

Orioles – Dylan Bundy (48, 6.3); Hunter Harvey (68, 3.4)

Rays – Daniel Robertson (66, 5); Willy Adames (84, 4.1)

Royals – Raul Mondesi (28, 6.8), Brandon Finnegan (55, 3.4), Kyle Zimmer (75, 3.4), Sean Manaea (81, 3.5)

Twins – Jose Berrios (36, 6.3); Nick Gordon (61, 5); Alex Meyer (62, 3.4)

Astros – Mark Appel (31, 6.3)

A.J. Preller should feel (somewhat) vindicated regarding the Justin Upton portion of his winter experiment if he can get a player he likes that resembles the players on this list. However, it remains to be seen if he will chase after something safer, like the Braves in 2008, or squander an asset like the Phillies in 2012. In that case, he’s probably better off going all-in on the Padres he built for 2015.


Hardball Retrospective – The “Original” 1946 Detroit Tigers

In “Hardball Retrospective: Evaluating Scouting and Development Outcomes for the Modern-Era Franchises”, I placed every ballplayer in the modern era (from 1901-present) on their original team. Therefore, Minnie Minoso is listed on the Indians roster for the duration of his career while the Giants declare Hack Wilson and the Mariners claim Ichiro Suzuki. I calculated revised standings for every season based entirely on the performance of each team’s “original” players. I discuss every team’s “original” players and seasons at length along with organizational performance with respect to the Amateur Draft (or First-Year Player Draft), amateur free agent signings and other methods of player acquisition.  Season standings, WAR and Win Shares totals for the “original” teams are compared against the “actual” team results to assess each franchise’s scouting, development and general management skills.

Expanding on my research for the book, the following series of articles will reveal the finest single-season rosters for every Major League organization based on overall rankings in OWAR and OWS along with the general managers and scouting directors that constructed the teams. “Hardball Retrospective” is available in digital format on Amazon, Barnes and Noble, GooglePlay, iTunes and KoboBooks. The paperback edition is available on Amazon, Barnes and Noble and CreateSpace. Additional information and a discussion forum are offered at TuataraSoftware.com.

Don Daglow (Intellivision World Series Major League Baseball, Earl Weaver Baseball, Tony LaRussa Baseball) contributed the foreword for Hardball Retrospective. The foreword and preview of my book are accessible here.

Terminology

OWAR – Wins Above Replacement for players on “original” teams

OWS – Win Shares for players on “original” teams

OPW% – Pythagorean Won-Loss record for the “original” teams

Assessment

The 1946 Detroit Tigers         OWAR: 58.3     OWS: 303     OPW%: .599

GM Jack Zeller acquired 42.5% (17/40) of the ballplayers on the 1946 Tigers roster and fellow front office executive Mickey Cochrane added 35% (14/40). Based on the revised standings the “Original” 1946 Tigers topped the Junior Circuit in OWAR but finished two games behind the Red Sox.

The Tigers’ ferocious rotation featured future Hall of Famer Hal Newhouser (26-9, 1.94). “Prince Hal” led the circuit in victories for the third consecutive season, collected his second straight ERA title and paced the League with a 1.069 WHIP. Newhouser finished runner-up in the MVP race following back-to-back MVP Awards in 1944-45. Dizzy Trout recorded 17 wins and fashioned an ERA of 2.34. Johnny Sain (20-14, 2.21) returned from military service and notched at least 20 victories in four of the next five campaigns. Fred Hutchinson (14-11, 3.09) and Virgil Trucks (14-9, 3.23) bolstered the back-end of the rotation. Schoolboy Rowe contributed an 11-4 record with a 2.12 in 16 starts.

ROTATION POS WAR WS
Hal Newhouser SP 9.36 32.87
Dizzy Trout SP 7.4 26.31
Johnny Sain SP 5.61 25.08
Fred Hutchinson SP 4.37 18.35
Virgil Trucks SP 3.26 16.57
BULLPEN POS WAR WS
Jake Wade RP 0.71 3.5
Art Herring RP 0.06 5.83
Johnny Gorsica RP -0.04 0.94
Rufe Gentry RP -0.33 0
Tommy Bridges RP -0.5 0.02
Schoolboy Rowe SP 3.67 13.83
Rip Sewell SP 0.99 8.5
Lou Kretlow SP 0.3 1.23
Art Houtteman SP -0.27 0.11
Stubby Overmire SP -0.33 2.88
Ted Gray SP -0.54 0
Hal Manders RP -0.66 0.13

In his penultimate campaign Hank Greenberg clubbed 44 circuit clouts and knocked in 127 runs to lead the American League in both categories for the fourth time. Rudy York (.276/17/119) eclipsed the century mark in RBI for the sixth time in his career. Roy Cullenbine posted a .335 BA with a .477 OBP while fellow outfielder Barney McCosky batted at a .318 clip.

Greenberg placed 8th among first basemen according to Bill James in “The New Bill James Historical Baseball Abstract.” In addition to “Hammerin’ Hank,” seven ballplayers from the 1946 Tigers ballclub registered in the “NBJHBA” top 100 rankings including Hal Newhouser (36th-P), Rudy York (56th-1B), Virgil Trucks (61st-P), Birdie Tebbetts (64th-C), Roy Cullenbine (68th-RF), Barney McCosky (70th-CF) and Hoot Evers (100th-LF).

LINEUP POS WAR WS
Roy Cullenbine RF 6.04 25.25
Barney McCosky CF 1.56 14.22
Hank Greenberg LF/1B 6.76 30.62
Rudy York 1B 2.19 21.74
Mike Tresh C 0.63 7.81
Johnny Lipon SS 0.14 0.97
Don Ross 3B 0.11 4.23
Mark Christman 2B/3B -1.02 8.28
LINEUP POS WAR WS
Les Fleming 1B 2.34 12.6
Hoot Evers CF 1.82 10.26
Dick Wakefield LF 1.52 14.7
Chet Laabs RF 1.25 8.67
Frank Secory LF 0.29 1.63
Pat Mullin RF 0.21 5.52
Birdie Tebbetts C 0.14 7.2
Bob Swift C 0.07 2.93
Mickey Rocco 1B 0.07 2.18
Ned Harris -0.01 0
George Archie 1B -0.07 0.07
Johnny Groth CF -0.16 0.07
George Metkovich RF -0.22 7.62
Gene Desautels C -0.45 2.1
Anse Moore LF -0.54 1.15


The “Original” 1946 Detroit Tigers roster

NAME POS WAR WS General Manager
Hal Newhouser SP 9.36 32.87 Jack Zeller
Dizzy Trout SP 7.4 26.31 Mickey Cochrane
Hank Greenberg 1B 6.76 30.62 Frank Navin
Roy Cullenbine RF 6.04 25.25 Mickey Cochrane
Johnny Sain SP 5.61 25.08 Mickey Cochrane
Fred Hutchinson SP 4.37 18.35 Jack Zeller
Schoolboy Rowe SP 3.67 13.83 Frank Navin
Virgil Trucks SP 3.26 16.57 Mickey Cochrane
Les Fleming 1B 2.34 12.6 Jack Zeller
Rudy York 1B 2.19 21.74 Frank Navin
Hoot Evers CF 1.82 10.26 Jack Zeller
Barney McCosky CF 1.56 14.22 Mickey Cochrane
Dick Wakefield LF 1.52 14.7 Jack Zeller
Chet Laabs RF 1.25 8.67 Mickey Cochrane
Rip Sewell SP 0.99 8.5 Mickey Cochrane
Jake Wade RP 0.71 3.5 Mickey Cochrane
Mike Tresh C 0.63 7.81 Mickey Cochrane
Lou Kretlow SP 0.3 1.23 George Trautman
Frank Secory LF 0.29 1.63 Jack Zeller
Pat Mullin RF 0.21 5.52 Mickey Cochrane
Birdie Tebbetts C 0.14 7.2 Frank Navin
Johnny Lipon SS 0.14 0.97 Jack Zeller
Don Ross 3B 0.11 4.23 Mickey Cochrane
Bob Swift C 0.07 2.93 Mickey Cochrane
Mickey Rocco 1B 0.07 2.18 Jack Zeller
Art Herring RP 0.06 5.83 Frank Navin
Ned Harris -0.01 0 Jack Zeller
Johnny Gorsica RP -0.04 0.94 Jack Zeller
George Archie 1B -0.07 0.07 Jack Zeller
Johnny Groth CF -0.16 0.07 George Trautman
George Metkovich RF -0.22 7.62 Jack Zeller
Art Houtteman SP -0.27 0.11 Jack Zeller
Stubby Overmire SP -0.33 2.88 Jack Zeller
Rufe Gentry RP -0.33 0 Jack Zeller
Gene Desautels C -0.45 2.1 Mickey Cochrane
Tommy Bridges RP -0.5 0.02 Frank Navin
Ted Gray SP -0.54 0 Jack Zeller
Anse Moore LF -0.54 1.15 George Trautman
Hal Manders RP -0.66 0.13 Jack Zeller
Mark Christman 3B -1.02 8.28 Mickey Cochrane


Honorable Mention

The “Original” 1915 Tigers     OWAR: 52.4     OWS: 299     OPW%: .598

Detroit edged Boston by a single game to secure the American League pennant in 1915. Ty Cobb (.369/3/99) swiped a career-high 96 bases while accruing 51 Win Shares and 9.5 WAR. “The Georgia Peach” claimed his ninth consecutive batting title and topped the leader boards with 144 runs scored, 208 safeties and a .486 OBP. Bobby Veach (.313/3/112) delivered League-bests in RBI and doubles (40). Ossie Vitt registered 116 tallies. Hooks Dauss established a personal record with 24 victories.

On Deck

The “Original” 1983 Cardinals

References and Resources

Baseball America – Executive Database

Baseball-Reference

James, Bill. The New Bill James Historical Baseball Abstract. New York, NY.: The Free Press, 2001. Print.

James, Bill, with Jim Henzler. Win Shares. Morton Grove, Ill.: STATS, 2002. Print.

Retrosheet – Transactions Database

Seamheads – Baseball Gauge

Sean Lahman Baseball Archive


Devon Travis, Sign Stealer?

Devon Travis has been a pleasant surprise for the Jays this season, as he’s hit better than anyone could have expected out of the gate.  Despite a horrible month of May when he tried to play through a shoulder injury, he’s hit to a 129 wRC+ so far with solid defense at 2nd.  Additionally, he may be helping the Jays in other ways, as it seems as though he may be involved in stealing signs.

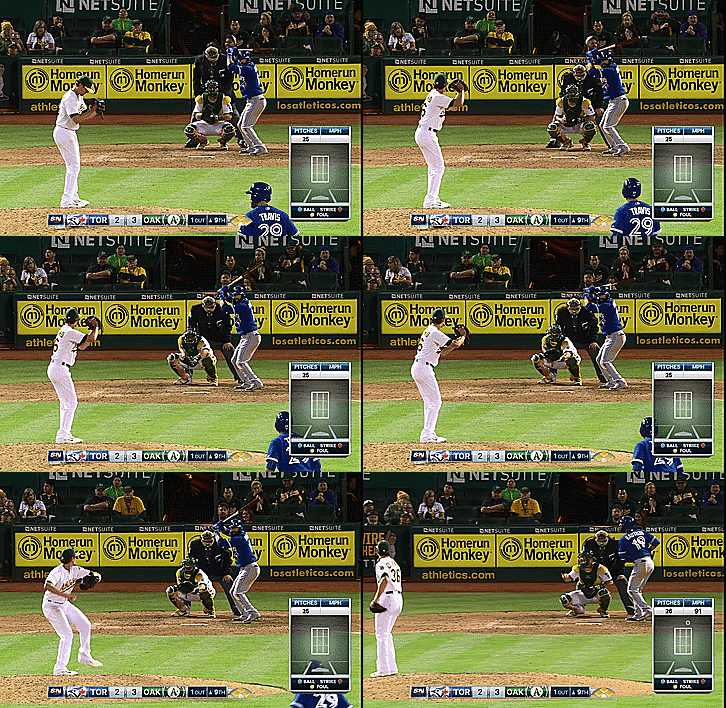
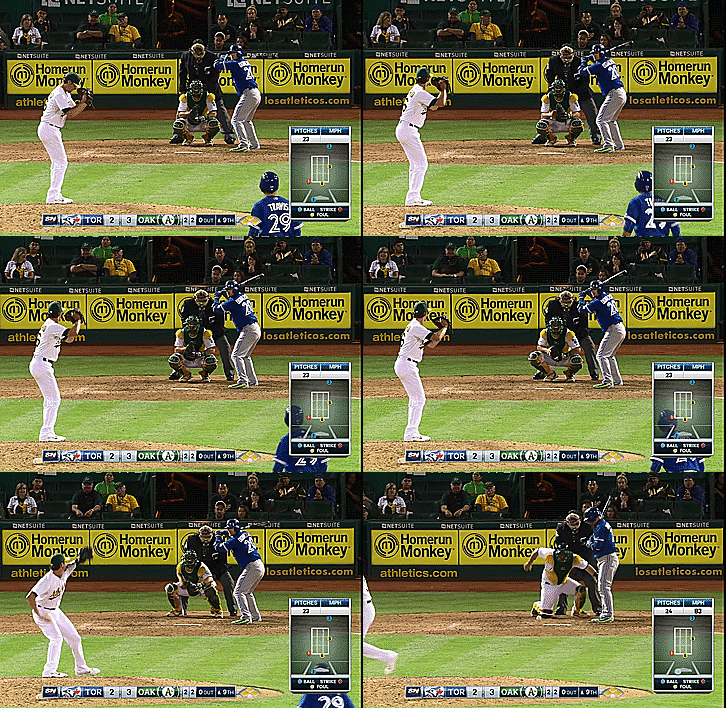
I was watching the Jays game against Oakland July 22nd, and after Devon Travis hit a double in the top of the 9th inning off of A’s closer Tyler Clippard, I began to notice Travis making some obvious movements at 2nd base.  Sometimes, I would see him clap his hands together enthusiastically; other times, I would see him hop up and down a few times. I then paid attention to the pitches that were subsequently thrown, and noticed a pattern: Whenever Travis would clap his hands, Clippard would throw a fastball, and whenever Travis would hop, Clippard would throw an offspeed pitch.  I decided to go back to the MLB.tv game archive to confirm what I thought I had seen live, and here is what I found:

Batter – Jose Reyes

Travis did not make any motions during the first five pitches to Reyes (likely, he was learning the signs). On the sixth pitch, he clapped, but Clippard stepped off and they ran through the signs again.

Batter – Josh Donaldson

Like with Reyes, Travis did not make any motions right away, as he looked at four pitches to get the signs down. The fun starts with pitch five:

Travis Motion – Clap

Clippard then steps off, followed by:

Travis Motion – Clap

Pitch – Fastball (92 mph)

Pitch six:

Travis Motion – Hop

Pitch – Offspeed (83 mph)

Pitch seven:

Travis Motion – Hop

Pitch – Offspeed (76 mph)

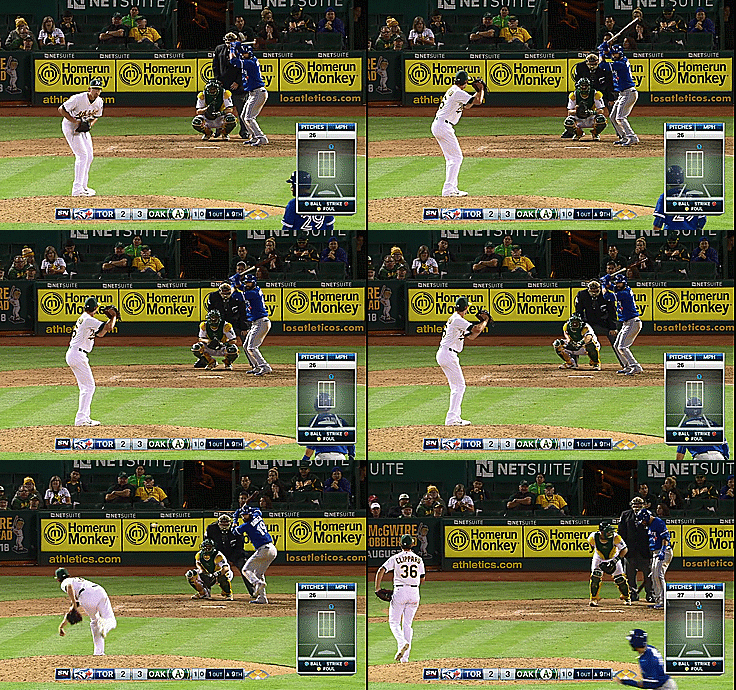
Batter – Jose Bautista

Pitch one:

Travis Motion – Clap

Pitch – Fastball (91 mph)

Pitch two:

Travis Motion – Clap

Pitch – Fastball (90 mph)

Sadly, after the second pitch to Bautista, the catcher visited the mound, and for the remaining three pitches in the at bat (which Bautista walked, moving Travis to third base) Travis did not make any motions (again, he probably figured they changed the signs).

So what we’re left with is five pitches (three fastballs, two offspeed) where the pattern holds up, and logical times when Travis does not clap or hop (i.e. after first reaching second base and after the mound visit when the signs could change). To me, given all the evidence, I don’t think the actions by Travis are coincidental, and I’m pretty certain he was stealing signs.

I was curious if this was a one-time thing, or something that Travis has done in the past, so I had a look at some other games in July in which Travis reached second base and was there for a few batters (i.e. long enough for him to pick up the signs).  Unfortunately, I wasn’t able to spot any patterns that would indicate he was stealing signs in those games that I checked.

As a Jays fan, Devon Travis is already one of my favourite players, as he’s having a fantastic rookie season at a position that has long been a black hole for the Jays.  Now, he’s given me further reason to appreciate him, and a definite incentive to watch his at-bats and times on base a little more closely from now on.


A Case For Wei-Yin Chen Ownership

I’m not going to tell you anything you can’t find out for yourself.  This is just a little research on Mr. Chen.  Alternative title would’ve been Chen Music, but I couldn’t find proof of an increase in high and inside fastballs.  Anyways:

Wei-Yin Chen’s surface level numbers have been great this year:

18 GS,   2.86 ERA,   1.12 WHIP,   93 K/116.1 IP

The thing is, he’s been just as good dating back to Jul 1st of 2014:

33 GS,   2.88 ERA,   1.14 WHIP,   164 K/209.2 IP

His peripherals over that time have declared him lucky and say that this success in unsustainable.  His FIP, xFIP, and SIERA for each half have been quite different from the ERAs he’s put up.


FIP xFIP SIERA ERA
JUL – SEPT 2014 3.37 3.68 3.79 2.89
APR – JUL 2015 4.09 3.85 3.78 2.86


Look, I get it, he doesn’t strike out even 20% of the batters he faces and he can struggle with the long ball.  But the Orioles’ defense is ranked 3rd in the league by UZR, and 3rd by UZR/150.  Ahead of the Orioles are the Rays and the Royals.  Each of these teams are outperforming their ERA indicators by a decent amount.

FIP xFIP SIERA ERA
Royals 3.80 4.09 4.03 3.54
Rays 3.86 3.81 3.66 3.59
Orioles 4.01 3.91 3.76 3.73


This does not mean that every pitcher on each of these teams is outperforming their peripherals but it’s obvious (and not because of that table) that defense helps pitchers’ numbers.  I also understand that Camden Yards is a little bit more of a hitters’ park than Kauffman and Tropicana, but that shows up in Chen’s numbers as he has surrendered HR at the rate of 1.29/9 IP at home and 0.89/9 IP on the road (July 3rd 2014 – present).  To be fair, I don’t know if 112 IP and 97.2 IP (home and away, respectively) are large enough sample sizes compared to his full body of work to be worth anything, but let’s say they are, and let’s see what Chen has done differently over his last 209.2 IP compared to his first 422 big league innings.


K% BB% K-BB% GB FB LD PU HF/FB SOFT MED HARD
209.2 19.2 5.2 14.1 40.3 39.5 20.2 10.5 10.1 20.6 53.0 26.5
422 18.2 6.3 11.9 37.2 40.7 22.1 11.1 11.5 14.9 54.2 30.9
DIFF 1.0 -1.1 2.2 3.1 -1.2 -1.9 -0.6 -1.4 5.7 -1.2 -4.4

(209.2 denotes the last 209.2. IP by Chen, spanning from July 3rd, 2014 to his last start against the Yankees, and the 422 is the 422 IP prior to July 3rd of last season, which encompasses the rest of his career)

Even though his ground ball rate doesn’t lead to much confidence in terms of sustainability in that soft contact management, he still is inducing pop-ups at an above-average rate.  So whether it’s a change in sequencing or it’s just as easy as working ahead in more counts, there has been some variation in his pitch usage…another table.

FB SL CB CH
203.1 66.4 17.5 6.2 9.9
422 65.8 13.6 7.4 13.1
DIFF 0.6 3.9 -1.2 -3.2


Obviously he’s traded some curveballs and change-ups for sliders.  His fastball has become increasingly more valuable in 2015 at 8.9 runs above average, compared to 3.3 runs above average from 2014 which was his previous high.

The last thing he’s done better is pound the zone early in counts which has led to a slight decrease in batters’ plate discipline against him.

F-STRK SWING OSWING ZSWING CONTACT SWSTRK
203.1 65.1 50.8 33.3 69.4 82.2 8.9
422 59.0 49.1 30.3 68.8 82.9 8.3
DIFF 6.1 1.7 3.0 0.6 -0.7 0.6


(Almost) Everywhere you want to see improvement there is improvement even if you have to look through a magnifying glass.  Granted, this could be Chen adjusting to the league and now the league will adjust to him.  It would be perfect for him to just cleanly split from the success he’s been having after the all star break and after this piece.

In conclusion, it’s hard to know what to make of Chen as a fantasy option in the long term because he is experiencing a deflated BABIP and a higher LOB% than he has in the past.  Is it all about the luck??  I’m not too bullish on him; the tweaks he has made, while they have led to some slightly positive results, do not warrant picking him up in a dynasty league, but if you’re behind in starts or innings Chen seems to be a solid option for QS/ERA/WHIP this season if he can thwart off the regression monster.  After all that, I did not recommend him in his start against the Yankees and their .325 wOBA (results on that game were meh – it was a QS, but he gave up 10 H in 6.1 IP, 3 ER, and struck out 3) but he’s at Tampa (94 wRC+) after that.  Projecting ahead, he’d face the Tigers (113 wRC+ which is best in the majors, but they could be selling some pieces and they will still be without Miguel Cabrera), and the Athletics (99 wRC+)who are also sellers.  After that it’s likely the Mariners and their 92 wRC+; I’d take that 4 start stretch.  Something to scratch your Chen about.


Comprehensive Contact Quality Model Using MLBAM Batted-Ball Data (Version 0.0)

Contact quality is a recurring sabermetric theme.  Much discussion over the last decade has centered around how we interpret Voros McCracken’s groundbreaking analysis, where he showed that the majority of variance in a pitcher’s ERA was driven by the rates at which he recorded strikeouts, walks, and home runs allowed.  This led to the conclusion by many that the batting average on balls in play (excluding homers) was largely outside of a pitcher’s control, and further research has probed the influence of team defense, home ballpark, and other outside factors on differences in BABIP.

Nevertheless, pitchers like Dallas Keuchel and Chris Young seem to have above-average success in “pitching to contact”,  even after allowing for outside factors.  To better understand such outliers from the standard fielding-independent pitching model, I have developed a new bottom-up  framework to analyze the quality of contact allowed, using the newly-available batted-ball data from MLB Advanced Media (via Baseball Savant).  This model takes all batted balls (including homers) and calculates the expected run value based upon how hard the ball was hit (“exit velocity”) and the estimated angle at which it left the bat (“vertical angle”).  In addition to the contact quality model, I’ve also developed a parallel model to estimate the defense-independent expected run value from batted-ball data (yes, contact quality and defense-independent run value are two different things.)

Relationship to FIP

The key difference between the Comprehensive Contact Quality Model and FIP is the integration of expected home runs allowed into the analysis.   Various metrics such as xFIP have attempted to account for the volatility in HR% by normalizing this rate as a fixed percentage of fly balls allowed.  A different perspective is to treat home runs as one extreme in a broad spectrum of contact quality:

           Swinging strike < Foul tip < Weakly-hit fair ball < Well-hit fair ball

This spectrum ranks how well the hitter has “squared up” on the ball, with better-struck balls further to the right. Home runs can be considered a subset of well-hit fair balls, where the likelihood of actually becoming a four-bagger depends primarily upon the distance travelled, which itself is a function of exit velocity, vertical angle, and a host of other factors.   So, when we talk about a pitcher’s ability to limit the long ball, what we’re really talking about is his ability (if any) to prevent the ball from being hit hard at an optimum angle to leave the park.

With that brief introduction, let’s outline the framework for valuing the contact quality on any batted ball.  First, for balls hit in the air:

Step 1  – Estimate the Probability of a Home Run

For this first iteration of the model, I made the following simplifying assumptions:

  • Exactly 1/30 of all outfield fly balls are hit in each MLB ballpark
  • The direction of these balls is distributed 20% LF to LC, 30% LC to CF, 30% CF to RC, and 20% RC to RF
  • Outfield dimensions are as currently posted in Wikipedia

Also since distance in the MLBAM data is measured to the assumed landing point, we also need to adjust for the height of the outfield wall.   To do this, I used Dr. Alan Nathan’s excellent trajectory calculator to estimate the complete distance traveled by a ball that is W feet above the ground when it passes over the outfield wall, where W is the height of the wall.   Note that this distance will be further for line drives than it will be for high flies, so the necessary distance for a home run will depend upon both the listed distance to the wall and the vertical angle of the batted ball.

[Caution – next section is somewhat technical; you can safely skip and not miss the gist of this article]

One problem with the MLBAM data found on Baseball Savant is that batted-ball angles are only available for home runs.  For other batted balls, we can use the fact that we have both the batted-ball velocity and distance to back-solve for the vertical angle:

1.  Make grid of distance = f(exit vel, angle), using the default settings in Dr. Nathan’s trajectory calculator:

(Key values shown below – columns are vertical angle, rows are exit velocity)

0 5 10 15 20 25 30 35 40 50 60
60 49 79 111 138 159 173 182 186 185 169 137
65 54 91 129 159 182 198 207 210 208 188 152
70 60 105 148 182 207 223 232 234 231 208 166
75 66 120 169 207 233 249 258 259 254 227 180
80 72 136 192 233 260 276 284 284 277 246 194
85 79 155 217 260 288 304 311 309 301 265 207
90 87 175 244 289 317 332 338 334 324 283 220
95 95 198 272 318 346 361 365 360 347 302 233
100 105 223 302 349 376 389 392 385 370 320 245
105 115 249 332 380 406 418 419 410 393 338 256
110 127 277 363 411 436 446 445 434 415 355 268
115 141 307 394 442 466 474 471 458 437 371 278
120 156 338 426 472 495 502 497 482 458 387 288

2.  Distance peaks at a certain “optimal” vertical angle then decreases.  This means that there are 2 possible solutions for the vertical angle when doing a lookup based upon distance and exit velocity.  Lacking any other information, I used the batted-ball type recorded by the Baseball Scoresheet stringers to guide which value to use:

LD uses lower of the two angles, PU uses higher of the two, FB uses mean of the two

This becomes our estimate of vertical angle on the batted ball.

[End of technical note]

Now, for each of the 30 MLB ballparks, we can use the combination of distance and vertical angle to estimate the probability of a homer, assuming the pull/center/opposite mix assumed above (note – version 0.0 of this model does not reflect batted ball direction).  After averaging across all ballparks, we get a grid of home run probabilities for any outfield fly ball:

0 5 10 15 20 25 30 35 40 50 60 Actual
300 0.0% 0.0% 0.0% 0.0% 0.0% 0.0% 0.0% 0.0% 0.0% 0.0% 0.0% 0.0%
310 0.0% 0.0% 0.0% 0.0% 0.0% 0.0% 0.0% 0.0% 0.0% 0.0% 0.1% 0.0%
320 0.0% 0.0% 0.0% 0.0% 0.1% 0.1% 0.1% 0.1% 0.2% 0.2% 0.3% 0.1%
330 0.0% 0.0% 0.1% 0.2% 0.3% 0.4% 0.5% 0.7% 1.0% 1.4% 1.7% 0.6%
340 0.0% 0.0% 0.2% 0.6% 1.3% 2.5% 3.9% 5.0% 6.0% 7.4% 8.2% 1.7%
350 0.0% 0.0% 0.9% 4.4% 8.1% 11.1% 13.2% 14.7% 15.9% 17.6% 18.5% 3.2%
360 0.0% 0.1% 6.0% 13.4% 18.7% 22.1% 24.3% 25.9% 27.1% 28.8% 29.8% 11.1%
370 0.0% 0.4% 15.3% 24.0% 30.4% 34.0% 36.3% 38.0% 39.2% 41.0% 42.0% 15.3%
380 0.0% 2.7% 25.7% 36.8% 43.0% 46.3% 48.3% 49.9% 51.0% 52.8% 53.8% 29.1%
390 0.0% 10.0% 36.1% 50.0% 55.2% 58.7% 61.3% 63.2% 64.8% 67.0% 68.3% 40.7%
400 0.0% 19.0% 47.8% 63.5% 70.1% 74.5% 77.5% 79.8% 81.5% 84.0% 85.3% 54.1%
410 0.0% 28.1% 61.8% 80.1% 86.6% 90.0% 91.7% 92.9% 93.7% 94.8% 95.4% 76.3%
420 0.0% 37.6% 78.0% 92.2% 95.2% 96.4% 97.0% 97.5% 97.9% 98.2% 98.3% 90.3%
430 0.0% 50.1% 88.9% 96.6% 97.7% 98.3% 98.7% 98.8% 98.9% 99.0% 99.1% 94.8%
440 0.0% 64.6% 93.5% 98.0% 99.0% 99.4% 99.5% 99.6% 99.7% 99.7% 99.8% 96.7%

Step 2 – Estimate BABIP if Not a Home Run

One big benefit of hitting the ball over the fence is that virtually no chance of making an out.  For balls hit in the air to the outfield, however, there typically three guys whose goal it is to catch the ball in order to get the batter out.  Now while a little bit of extra loft on a hard-hit OF fly can improve the chance of a dinger, for balls that stay in play the relationship between BABIP and vertical angle is essentially linear (using first-half 2015 data):

    BABIP if hit in the air to OF = .9698 – .0256 * MIN(37.5, angle)

We will use this in conjunction with the next step to determine the run value of a non-homer fly/popup/liner.

Step 3 – Estimate Expected Run Value If A Hit (Non-HR)

For balls not caught by the outfielder, the chances for an extra-base hit vary by vertical angle and also increase for higher exit velocities.  Regressing the first-half 2015 data (using hits to the outfield only) results in this estimate:

RV if hit to OF =  -1.06 + 0.0206*velocity – 0.00006*velocity^2 + 0.0223*angle – 0.000318*angle^2

We can now calculate the contact-quality run value as:

     CQRV = (1.38 x HR Probability) + (RV if hit to OF x (1 – HR Probability))

Contact Quality Run Values for Ground Balls

For ground balls, the expected run value increases with increasing exit velocity.  We can estimate the CQRV directly from the following regression equation:

CQRV = 0.35-0.0174*velocity+0.00014*velocity^2, if velocity > 65; else CQRV = -0.19

Note that the expected run value is set to -0.19 for velocity less than 65 MPH.  This is because the run expectancy actually improves for grounders hit at a very low speed (basically dribblers and slow rollers).  Because this is a model of contact quality, we are not going to penalize the pitcher for poor batted-ball luck when the actual quality of contact is low.

This leads us to a discussion of the last key feature of the model….

Contact Quality vs. Expected Batted-Ball Result

The CQ model is designed to produce higher run values for better quality of contact.   However, as discussed in Tony Blengino’s enlightening series on batted-ball outcomes, real-life BABIP doesn’t improve continuously with higher batted-ball velocity, but instead actually decreases over the stretch between balls hit relatively shallow and balls hit to the deeper parts of the outfield.  The CQ model calculates BABIP as a function of vertical angle in order to avoid rewarding pitchers for the better-struck balls that fall into the “donut hole” near the depths where outfielders normally position themselves.

I chose vertical angle to model BABIP for the CQ framework because of its close relationship to hang time, which in turn is a key component of the likelihood of the outfielder making the putout.  In reality, batted-ball location also plays an important role in determining whether a fielder can range into position to catch the ball.  To model this more realistic BABIP, I estimated what proportion of balls hit a certain distance would be reachable by one of the three outfielders, given a certain amount of hang time (note – hang time can be estimated by Dr. Nathan’s trajectory calculator based upon exit velocity and vertical angle).    For example, an arc 320 feet from home plate is roughly 502 feet long from foul line to foul line.   If we assume that each outfielder can cover 52 feet in 3.0 seconds, then we can draw a circle with a 52 foot radius from each fielder’s initial position and estimate the overlap between the arc and these circles to be about 237 feet.  So we assign a 47% chance (237 divided by 502) of catching a fly ball hit 320 feet with a 3.0 second hang time.  If we increase the hang time to 4.0 seconds, the coverage circles now have an 87 foot radius, and 479 feet of the arc are covered, for a 95% chance of an out.

Here is how the more realistic BABIP varies based upon both batted-ball distance and hang-time.  Note the “donut hole” for balls hit around 300 feet with hang times in the neighborhood of 4 seconds.

           1.0            1.5            2.0            2.5            3.0            3.5            4.0            4.5            5.0
200    1.000    1.000    1.000    1.000    1.000    1.000    0.711    0.400    0.005
210    1.000    1.000    1.000    1.000    1.000    0.925    0.589    0.318          –
220    1.000    1.000    1.000    1.000    1.000    0.761    0.523    0.217          –
230    1.000    1.000    1.000    1.000    0.889    0.666    0.485    0.161          –
240    1.000    1.000    1.000    0.960    0.772    0.618    0.353    0.136          –
250    1.000    1.000    0.971    0.828    0.696    0.528    0.254    0.061          –
260    1.000    0.932    0.857    0.757    0.646    0.403    0.180          –          –
270    0.919    0.863    0.802    0.717    0.555    0.314    0.120          –          –
280    0.886    0.838    0.783    0.678    0.468    0.258    0.073          –          –
290    0.884    0.834    0.762    0.598    0.419    0.217    0.035          –          –
300    0.918    0.823    0.721    0.579    0.413    0.218    0.038          –          –
310    0.956    0.853    0.741    0.588    0.414    0.211    0.020          –          –
320    0.941    0.916    0.857    0.663    0.470    0.263    0.059          –          –
330    0.943    0.919    0.891    0.807    0.556    0.330    0.104          –          –
340    0.962    0.936    0.908    0.869    0.714    0.444    0.205    0.029          –
350    1.000    0.967    0.931    0.883    0.830    0.576    0.315    0.118          –
360    1.000    1.000    0.985    0.911    0.843    0.726    0.434    0.212    0.043
370    1.000    1.000    1.000    0.977    0.870    0.783    0.559    0.317    0.144
380    1.000    1.000    1.000    1.000    0.933    0.799    0.691    0.428    0.248
390    1.000    1.000    1.000    1.000    1.000    0.856    0.712    0.525    0.339
400    1.000    1.000    1.000    1.000    1.000    0.956    0.759    0.603    0.420
410    1.000    1.000    1.000    1.000    1.000    1.000    0.866    0.716    0.487
420    1.000    1.000    1.000    1.000    1.000    1.000    1.000    0.749    0.574
430    1.000    1.000    1.000    1.000    1.000    1.000    1.000    0.827    0.637
440    1.000    1.000    1.000    1.000    1.000    1.000    1.000    0.944    0.704

This neatly explains why fly balls hit at 85 MPH often result in an out, while line drives hit that hard are most often base hits.

Angle 0 5 10 15 20 25 30
Distance          79        155        217        260        288        304        311
Hang Time        0.7        1.4        2.2        2.9        3.5        4.1        4.5
BABIP    1.000    0.669    0.229    0.032          –

If we substitute the hang-time based BABIP for the vertical-angle based BABIP used in the CQ model, we obtain a batted-ball-data expected run value that is more realistic and truly fielder-independent.  Unfortunately, this metric (let’s call it BBRV) doesn’t do as well as CCRV in measuring the actual quality of contact, since it rewards a pitcher allowing an 85 MPH/25 degree angle fly (.032 expected BABIP) more than a pitcher who gives up a 75MPH/25 degree bloop (.537 expected BABIP).

In short, we can see that fielding-independent pitching consists of two parts:  contact quality allowed, and batted-ball luck.

Some Actual Results…

Well, with all that said, what does CCRV version 0.0 tell us about pitchers so far in 2015?

First, let’s look at the actual run expectancy above average allowed on batted balls (using linear weights).  Here are the top 5 and bottom 5 through the first half of 2015:

Sonny Gray         (18.9)
Zack Greinke         (18.8)
Dallas Keuchel          (16.3)
Jacob deGrom          (12.1)
Chris Young          (11.5)
Ian Kennedy            20.4
CC Sabathia            21.5
Kyle Lohse            21.7
Kyle Kendrick            22.2
James Shields            23.0

No real surprises for those who’ve followed this year’s FIP/BABIP outliers (though Greinke’s never been this successful on batted balls – maybe he’s the guy who’s heisted Kyle Lohse’s secret formula for contact management.)

Now, let’s look at CQRV:

Pitcher CQRV Expected Run Value Actual Run Value
Sonny Gray              (8.8)              (9.2)            (18.9)
Brad Ziegler              (7.1)              (6.5)            (11.2)
Clayton Kershaw              (6.6)              (3.2)                7.3
Brandon Maurer              (6.4)              (6.1)            (10.0)
Alex Wilson              (6.0)              (6.9)              (3.3)
Kyle Lohse                13.7                12.9                21.7
Jerome Williams                14.3                16.0                18.7
Phil Hughes                16.9                16.4                17.5
Josh Collmenter                17.6                18.6              14.0
Kyle Kendrick               23.3                22.5               22.2

The only mildly interesting name in the bottom five is Phil Hughes, who has returned to allowing a high HR% after conquering the gopher ball in 2014.  In the top five, we see saber-fave Brad Ziegler, whose ridiculous .177 BABIP/0.45 HR/9 combo is driven far more by low contact quality than by batted ball/defensive luck.  We also see two very surprising names at #4 and #5.   Brandon Maurer has allowed a .238 BABIP along with just 1 HR in 44 innings, thanks to a career high 27% soft hit percentage alongside a career low 21% hard hit percentage.  Alex Wilson has likewise improved his contact management numbers (25% soft hit/21% hard hit) to drive a .270 BABIP with just 2 longballs allowed.

Finally, it’s interesting to note Clayton Kershaw’s numbers.  Despite having a BABIP north of .300 for the first time since his rookie season, Kershaw has been well above average in terms of stifling contact quality.  But, between having fewer fly balls than average dying in the outfield “donut holes” (3 runs) and other batted-ball/defensive factors (10 runs), Kershaw has been a few runs worse than average on balls in play. (Not that he needs any help to remain brilliant).

Conclusion

I have chosen to call this version 0.0 of the CCQM framework because in essence this is as much a “proof of concept” as a potential tool.   Two key areas will require continuous research and review to fully power up this model.

First, the raw data used to develop the model is new and evolving.  As more MLBAM data becomes publically available, there will be a more robust historical track record of fundamental physical stats behind every play made, which will improve the reliability of the model.

Second, the framework itself needs to be tested further to make sure that any variables that truly affect contact quality are considered.  For example, I consciously chose to not include batted-ball direction as a factor for this first version of the model in order to avoid extra complexity.  In effect, this was equivalent to a null hypothesis that pitchers cannot influence batted-ball direction.  It would be foolish not to test the validity of this assumption for future iterations of the model to see if there are pitchers who consistently show the ability to improve their performance by influencing the batted-ball direction, all other factors being equal.

My hope is that the CCQM model sparks a fresh round of discussions on the whole notion of contact quality, leveraging this whole new generation of metrics at our disposal.

Chalk to Chalk

When preparing for the baseball season we will practice by playing intersquads to ensure we get as many live at-bats and innings as possible. Since it would not be affordable to hire umpires for our daily practices our assistant coaches will rotate umpiring behind the pitching mound. We have a big squad, I am talking 31 pitchers alone on the team, so in the interest of not playing until the sun rises the strike zone will expand quite a bit. It is easy for me to look great when our coaches will call strikes the hitters normally take. Offense can be limited during these practices as pitchers tend to dominate and hitters often are walking away frustrated.

Following the Nationals and Dodgers matchup on Sunday, Bryce Harper expressed his displeasure with umpire Bill Miller’s strike zone. In a recent ESPN article Harper explained “when you’re getting 6 inches off the plate, its tough to face” (Zack Greinke). Was Harper just trying to downplay the performance that Greinke put on or is there merit to the comments Harper said?

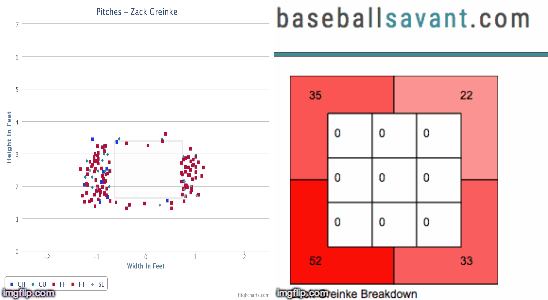
During the July 19th game between the Dodgers and Nationals, Zack Greinke had 10 pitches called for strikes outside the strike zone.

Here is Greinke’s pitching plot courtesy of Brooks Baseball:

So Harper is not incorrect by saying that Greinke was the beneficiary of some balls being called strikes. This year, Greinke has thrown 1905 pitches according to Baseballsavant.com and of those 142 pitches (7.45%) have been called strikes outside the strike zone. Currently, Greinke has the 5th most called strikes outside the strike zone only behind Dallas Keuchel, Jon Lester, Yovani Gallardo and Mike Leake.


Looking at the man behind the plate, Bill Miller, he has the highest percentage of called strikes outside the strike zone at 17.5%. Since 2010 Bill Miller has ranked in the top two for umpires in called strikes outside the strike zone four times with an average of 16.9%.

Well if that wasn’t enough to convince you that Bryce Harper was on to something, let’s look at Yasmani Grandal. Grandal, according to StatCorner.com, and taking catchers who have caught over 2000 pitches, has the 3rd highest percentage of strikes called outside.

Possibly Greinke and catcher Yasmani Grandal game-planned knowing Miller was behind the plate so they exploited his tendency. It could possibly be that on that day Greinke was a beneficiary of his normal game plan. This year of the 1905 pitches 1262 of them have been outside the strike zone. An umpire with a large zone, a fantastic pitch-framer behind the dish and a pitcher who lives outside the zone sounds like a recipe for strikes being called outside the zone.

In the end, sorry Bryce, that is just how baseball works — the zones are never the same.


Is A.J. Pollock Really This Good?

A.J. Pollock is, at the moment, one of the best fantasy outfielders in major league baseball.  He’s 4th according to the ESPN player rater but since most of you and I don’t REALLY know what that means, let’s say it a different way.  He is one of only four players with at least a .290 AVG, 10 HR, and 15 SB.  Still, whenever I talk with anyone about Pollock’s performance, the consensus opinion on him is more of a resonating question: “Is A.J. Pollock really this good?”  Let’s attempt to answer that.  Dating back to the beginning of 2014,  Pollock has played in 161 games.  We could round that up to 162 games, especially since players rarely play every single game of a season, and call it a full season, but I’m going to go the extra mile here and pull the last game from his 2013 campaign to have a constant 162 games for this exercise.  The stat line he has produced is impressive.


G   PA   H   AB   R   2B   3B   HR   RBI   SB   BB   K  HBP   SF   AVG   OBP   SLG   OPS
162   657   181   603   99   37   8   18    67   33   46  103    3    4 .300 .351 .477 .827

Let’s lower the bar a little bit so that we can find more players in THIS search: how many other players over their last 162 games have hit at the very minimum: .290, 90 R, 15 HR, 60 RBI, 25 SB?  The answer is 1, and that man is Starling Marte.

  G   PA   H   AB   R   2B   3B   HR   RBI   SB   BB   K   HBP   SF   AVG   OBP   SLG   OPS
  162   652   181   596   90   36    3    22   88   33   36   148     16    2   .304   .358   .485   .843

I’m not sure if that makes Marte a fair comparison.  We can compare them, but Marte delivers more line drives and raw power than Pollock does.  Marte, despite having a paltry 19.3% FB rate, has averaged 312 feet on his fly balls this year, 4th best in the majors, allowing him him to post an absurd 29.5% HR/FB rate – and we’re not even ready to get into park factors yet.  Pollock is just a bit more refined than Marte, posting a better BB rate and K rate than Marte has, by, obviously, swinging at better pitches to hit.

2015   BB%     K%     OSWING%     ZSWING%     SWING%     CONTACT%
  Pollock     7.4   15.6        31.2        59.1      44.3        82.7
  Marte   5.3   24.1        38.9        77.8      56.8        74.5

Pollock, too, has a fine average fly ball distance.  It’s 295 (a number he’s increased each year), which is good for 39th overall, smack dab in between Adam LaRoche to the north and Nolan Arenado to the south.  But Pollock has also been incrementally improving his BB/K ratio over the last three years, bringing it from 0.40 to 0.47 this year.  It could be as simple as that – a good player that has made strides in his approach at the plate, but I can’t just leave it at that.  Despite these improvements, albeit, very small ones, his batted ball profile looks right around league average.


2015   LD%    GB%    FB%    IFFB%    HR/FB    IFH%    BUH%    PULL    CENT    OPPO    SOFT    MED 
Pollock 19.4 51.4 29.1 12.3 13.5 10.5 100 36.7 36.3 27.0 17.4 50.2
League AVG 20.9 45.4 33.6 9.4 10.7 6.7 24.3 39.0 35.6 25.5 18.6 52.9

Pollock is fast, so hitting a lot of ground balls works in his favor.  He’s been able to have higher than average IFH and BUH percentages in each of the last three years because of his speed.  However, despite being a below average line drive hitter this year, and throughout his career, he is less susceptible to BABIP fluctuations than other high frequency GB hitters like Alcides Escobar, Elvis Andrus, Jean Segura, because Pollock produces a hard hit rate higher than the league average – he is an authoritative hitter.  Curious though, that with his below average LD rate, this is the case.  So his hard hit% is driven by either hard contact on fly balls or ground balls relative to league average.  Since he has an IFFB% above league average I’m going to predict that he’s a high authority GB hitter.  There’s logic in that, right?


  2015   GB   AVG     HARD  GB   PULL GB      CENT GB     OPPO GB     FB AVG     HARD FB     PULL FB     CENT FB     OPPO FB  
  Pollock    0.301   23.1   46.9   41.3   11.9   0.234   35.8   19.8   34.6   45.7
League AVG   0.234   17.1   52.9   34.1   13.1   0.223   36.2   22.2   38.0   39.8

He’s right at about league average for hard hit fly balls, but he does seem to have a hard hit ground ball percentage markedly higher than league average.  In fact, his 23.1% hard hit GB rate is 18th best in the league.  The 17 players in front of him have combined for an average line of:

    2015   H   AB     R     HR     RBI     SB     AVG     LD%     GB%     FB%     HARD%  
  Top 17     84   300   41    13     45     3    .280    20.4    44.5    35.1      33.7
  Pollock     100   334   58    11     42    19    .299    19.4    51.4    29.1      32.4

The list also includes names like Tulo, Miguel Cabrera, Posey, Pederson, Upton, Donaldson, Trout, Jose Abreu, and Yoenis Cespedes.  It’s guys that we generally perceive to be hard contact hitters, or I guess, more specifically, power hitters.  But he’s 18th on the list and produced a quality hard hit ground ball rate last year, too.

But, he still has a league average hard hit fly ball rate and a below average line drive rate.  These are reflected in his numbers compared to the league.

  2015     LD%     LD AVG     GB%     GB AVG     FB%     FB AVG  
  Pollock     19.4     0.667   51.4     0.301   29.1     0.234
  League     20.9     0.684   45.4     0.234   33.6     0.223

Lastly, he plays in Chase Field, which, throughout its history, has been a hitters park.  From 2008-2014 it had an adjusted park factor of +111.  For right handed hitters (and left handed hitters) like A.J. Pollock, it has had only positive affects, but this table is solely for righties:

  HR     3B     2B     1B     AVG     OBP     SLG     R  
  1.09   1.45   1.14   1.00    1.04    1.03    1.07   1.11

Put Pollock in a neutral park and his numbers for the last 162 games would theoretically look like this:

  G   PA   H   AB   R   2B   3B   HR   RBI   SB   BB   K   HBP   SF   AVG   OBP   SLG   OPS
162   657   174  603   89   33    6    17    60   31   46   103     3    4   .288   .340   .448 .788

I was kind of hoping to see more signs that Pollock is experiencing more luck.  Not because I don’t like Pollock, I love him as a baseball player and I’m sure he’s a fine person, but because of the questions regarding the sustainability of his play in the first half of the 2015 season by many of my peers.  The answer to, “is he really this good”, is that he is pretty darn close and I can see him performing to any of the projection systems’ expectations the rest of the way (ZiPS, Steamer, or Depth Charts).  He should experience some fluctuation in BABIP because of his GB rate, but so far he really hasn’t – and again that’s partially due to the authority with which he hits them.

In terms of finding a player closest in comparison to Pollock, Marte might be a pretty decent choice.  If I can just brainstorm using the cloud technique, I would probably have, with A.J. Pollock’s name in the middle: Starling Marte, Jason Heyward, Christian Yelich, Charlie Blackmon, Brett Gardner, and Lorenzo Cain as smaller clouds extending off the big, middle cloud.  Here are stats based on the last 162 games played.


PLAYER   PA   H   AB   R   HR   RBI   SB   BB   K   HBP   SF   AVG   OBP   SLG   OPS
Yelich   709   181   628   91    9    56   22   75   155      4    1   .288   .367   .390   .757
Cain   641  180   592   91   11   66  39   37  128      8    4  .304   .351   .448   .799
Heyward   636   163   576   76   12   60  22   51   96      4    4   .283  .343  .403  .746
Blackmon   698   179   628   87   18   66   36   41  123    19    5  .285  .345  .436  .781
Gardner   707   162   611 108   21   72  22   70  147     6    6  .265  .343  .458  .801
Marte  652   181   596   90   22   88  33   36 148    16    2  .304  .358  .485  .843


This group kind of works as a spectrum.  I see the players on the extreme north and south columns least like Pollock and the players in the middle most like Pollock.  There is no one player to compare A.J. Pollock with that is playing currently, although Mitch Webster would be a pretty good historical comparison using his ages 26 – 28 seasons.

Mitch Webster ages 26-28 162 G AVG:

  G   PA   H   AB   R   HR   RBI   SB   BB   K   HBP   SF   AVG   OBP   SLG   OPS
  162   656   165   580   94    15    60   36   62   87      5    5   .283   .354   .441   .795

Probably too high of a walk rate, but that looks pretty good.

The average season of the group above would look like this:

  G   PA   H   AB   R   HR   RBI   SB   BB   K   HBP   SF   AVG   OBP   SLG   OPS
  162   674   174   605   91    16    68   29   52   133     10    4   .288   .352   .437   .789

A little too high of a K rate, but that also looks pretty good.

And finally A.J. Pollock ages 25-27 162 G AVG

  G   PA   H   AB   R   HR   RBI   SB   BB   K   HBP   SF   AVG   OBP   SLG   OPS
  162   618   163   567   89    15     57   25    43   101      3    3   .287   .339   .449   .788

In conclusion, A.J. Pollock is very close to this good if he’s not actually THIS GOOD and I think these players are pretty good comparisons.  And hopefully Pollock has more long lasting success than Mitch Webster.  In a time when speed/power combo players are in decline, what Pollock is doing is clearly elite in that sense.  What I really would like to see would be the history of authoritative ground ball hitters with good speed who have played in parks that have buoyed their power numbers.  Unfortunately, I don’t have access to batted ball profiles for hitters throughout history – how many Pollocks does it take to gather that information?


Why the Darlings of the AL are Not Ready for a Playoff Push

The 2015 MLB season has been filled with plenty of surprises thus far. The Twins have maintained their hot start, and currently hold the first wildcard spot in the AL. The NL Central has been highly competitive, with three teams in position to make the playoffs should the season end today. The Padres have been a huge disappointment (although I never fully bought into them), and may be sellers at the deadline just seven months after making the biggest splashes of the winter. Sleeper picks Cleveland and Seattle might as well have been asleep the first half of the year, both putting together extremely underwhelming performances and effectively ending their postseason hopes.

But no over- or under-achieving organization quite took the league by storm like the Houston Astros. They began the year hotter than any team in baseball besides St. Louis, finishing May with a record of 32-20 and a four-game lead over the second-place Angels. In their last 43 games, however, it has been a much different story. They have gone 20-23, enduring one seven-game losing streak in June, and they began the second half on a six-game losing streak (also losers of 8 of their last 9). Back in mid May, amidst all the frenzy over the already anointed playoff bound Astros, I began to wonder what was propelling this team to victory. It was clear that although their starting pitching doesn’t blow anyone away with immense velocity or stuff, they had a set of guys who were displaying that they knew how to pitch and could hold their own in a MLB rotation. Here are the splits on the Astros’ starting pitching, using May 31st as the divider.

Months ERA FIP K/9 BB/9 BABIP LOB%
March/April-May 4.08 3.75 6.45 2.46 0.298 70
June-All Star Break 4.03 3.54 8.04 3.13 0.299 70


I made sure that only active players on the Astros’ roster were included due to the fact that there are many insignificant players whose numbers would have been included in the splits because of spring training. The ERA and FIP numbers are very similar, as are the BABIP and LOB% stats. The two interesting changes are the increase in strikeouts and the simultaneous increase in walks. Walks lead to runs, and since the Astros have not been great offensively, the more free passes given out the more likely they will be playing from behind in games. While Dallas Keuchel has been extraordinary, and Lance McCullers has been solid as a rookie, their rotation doesn’t seem to have enough to strike fear into opposing team’s hearts (see 1990’s Atlanta Braves).

They do however appear to have a solid bullpen, possessing the 4th best ERA at 2.67 and the 4th best LOB% at 80%. Their recent scuffles have them at an overall record of 49-42, currently a half game back of the Angels. According to the computers, they have a 55.3% chance of making the playoffs in some capacity this year, and are expected to finish with a record of 84-78 — good enough to win a wild card spot. The computer’s calculations aren’t always perfect, so it is safe to say that there is definitely a margin of error here, although I cannot say for certain what that number might be (probably ±3-4 wins). Regardless of what the analysts are saying, I believe they WILL NOT make the postseason. Why? Because history is not on their side.

After a lot of hard work entering in all of the numbers by hand, I finally have created a table that houses several statistics from all playoff teams starting in 1995 when the wild card was introduced. Take a look at these numbers:


Name BA ISO K% BB% OBP
2015 Astros 0.240 0.178 24.8 8.2 0.307
1995-2014 Postseason Avg. 0.269 0.163 17.2 9.1 0.340
1995-2014 Postseason Min. 0.238 0.113 12.7 6.3 0.310
1995-2014 Postseason Max. 0.293 0.204 22.6 12.0 0.373


If the season were to end today, and the Astros made the playoffs, they would have some heavy outliers among the last 20 years worth of playoff teams. They would have the second lowest batting average, the highest K%, and the lowest OBP. Their ISO is well above average, but the fact that they run such a low OBP means that those extra base hits won’t increase their expected run totals very much; you need guys on base to score runs. Their average walk rate is to be expected based on the lineup they have assembled. They have a lot of what I would call “hackers,” guys who go up and take massive cuts trying to crush the ball — Chris Carter, Evan Gattis, Luis Valbuena, and Colby Rasmus to name a few. The only way this lineup gets worse in the ‘K’ department is if you bring Adam Dunn back from the dead and trade for Mark Reynolds. My point is simple: there has never been such a boom or bust type of team to make the playoffs, at least not one this extreme. Even if they were to acquire a frontline starting pitcher like Johnny Cueto or Cole Hamels, I do not believe that their lineup would be able to support the pitching staff enough to catapult them into the postseason.

Only time will tell what happens with the darlings of the MLB this season. They have a strong core, and a bright future, with many top prospects making their debut this season and even more right on the doorstep. Jeff Luhnow has done an incredible job building this team, and there is no doubt that they will be contenders in the AL West for many years to come. Yet, while they are not the same Astros of recent memory, they are not quite ready to make the postseason. This may not be a bad thing, though. As Yogi Berra once said, “You can observe a lot by watching.”


The Cleveland Indians as a Fringe Playoff Contender

It’s been a disappointing year thus far for the Cleveland Indians. They are currently 42-46 heading into the All-Star Game, and are in 4th place in the competitive American League Central division. They are underperforming their BaseRuns projection by 4 wins, meaning the computers view this team as much more of a playoff threat than they actually have been thus far. Although they have the third-highest remaining projected winning percentage in the AL at .532, their rough first half has them only finishing with about 81 wins. As wide open as the wild card race is, a .500 finish would clearly not be enough. What has happened to everyone’s preseason sleeper team? Besides Sports Illustrated jinxing them of course.

Well as expected, they have had stellar starting pitching from the likes of Corey Kluber, Carlos Carrasco, Trevor Bauer, and Danny Salazar, and even have gotten good outings recently from under the radar prospect Cody Anderson. Everyone knew they had a bad defense, but many thought that the Indians’ offense could support the great starting pitching enough to propel them into the postseason. Thus far, however, that has not been the case. They are at league average or below in almost all offensive categories. They are not a power hitting team by any means, and have the 10th lowest FB% in the MLB, which makes sense seeing as to hit for power you need to get the ball in the air. However, they still run the 7th lowest BABIP in baseball, which insinuates that they have a lot of hitters who tend to roll over a lot. Lo and behold, they are 3rd in Pull %, and have a lefty heavy—heavy being an understatement—lineup.

Essentially, the Indians have amassed a lineup with a bunch of pull-happy hitters who don’t hit for much power, which doesn’t work in a league that nowadays uses the shift religiously. I think all Cleveland fans know where I’m going with this, because the phrase has been overused by Tribe fans for almost a decade now. Yes, Cleveland is lacking an impact right-handed bat. Brewer’s prized prospect Matt LaPorta was supposed to be that guy when the Indians traded C.C. Sabathia for him and others—including player to be named later Michael Brantley. However, his MLB career was as successful as Kim Kardashian’s first marriage. Ironically or not, Milwaukee has another player that I believe can push the Tribe over the hump; his name is Carlos Gomez.

The 29 year old native of the Dominican Republic, known for his fiery personality, has been extremely productive for the Brew Crew since 2011, racking up 18.4 WAR in that 4 year span. With Milwaukee sitting at the halfway point with the second worst record in all of baseball, they will most definitely be sellers at the trade deadline. I recently tweeted FanGraphs’ Jeff Sullivan asking him if Gomez would be dealt, to which he responded, “Gomez is probably moving. Lucroy not.” That doesn’t mean it is set in stone, but that shows that there is a decent chance he gets traded. Let’s just assume for arguments sake that the Indians and Brewers have mutual interest in being trade partners. Why should the Indians’ make the move?

One plus is that Gomez wouldn’t be a rental. He is under contract through 2016, and is only set to make 9 million dollars next year. If you consider 1 WAR to be worth roughly 7 million dollars, Gomez’s average of 6.6 WAR per year the last two seasons would be a huge bargain for the Tribe. With the contracts of David Murphy and Ryan Raburn likely to be coming off the books next year, an extra 9 million dollars on the payroll will be inconsequential for the notoriously conservative Dolan family. Gomez also would provide a major upgrade from primary Tribe center fielder, Michael Bourn. I have included a chart that compares their averages from the last two seasons. Why two seasons? Because that’s when Bourn signed with Cleveland, where he has not been the same player he once was.

Name Avg. WAR Avg. wRC Avg. RISP Avg. DEF Avg. ISO Avg. SLG Total PA
Bourn 1.3 53 0.298 -3.3 0.101 0.360 1,062
Gomez 6.6 93 0.298 17.2 0.208 0.492 1,234


It is easy to see who has been the more valuable player. The reason I included ISO and SLG was to demonstrate Gomez’s excellent power, not necessarily to compare it to Bourn’s (because that is not the type of hitter he is). Gomez would provide a major upgrade defensively – where the Indians struggle – and at the plate, where he is a key catalyst in manufacturing runs. Gomez has created almost 40 more runs per season than Bourn the last two years. If you take into account how every 10 runs scored or given up equates to a win or a loss, those extra 40 runs would essentially add on about 4 more wins to the Indians win total (assuming those averages hold up throughout the 2015 season). So that would take the roughly 81 win Indians and make them an 85 win team; better yes, but still not a playoff contender.

Although Bourn and Gomez have been equally as good with RISP, this season has been a different story; Bourn is hitting .216 in 68 PA and Gomez is hitting .381 in 65 PA with RISP. The Indians have the 7th worst average with RISP this season at .230, with the MLB average being .255. For a team that struggles to score runs, this would be a huge difference. Slotting Gomez in the lineup everyday behind a guy like Michael Brantley would also take a ton of pressure off of him to carry the team day in and day out.

So what does this all mean? Could Carlos Gomez really propel the Tribe into October baseball this season? Probably not. Here are their season splits against teams above and below .500.

               Wins Losses Winning Percentage
Teams ≥ .500 24 32 0.429
Teams < .500 18 14 0.563


They struggle against good teams, and beat bad ones. That is not the mark of a playoff team. In the last 74 games of the season, the average winning percentage for teams they play is .515. While I fully believe the team could make a strong second half push – I actually believe they will make the playoffs – it is not likely. Still, a trade for Carlos Gomez would not only aid them in the second half of this season, but for next season as well. Clevelanders are sick of hearing “we’re building for the future.” The Indians have an extremely strong core, one that is young and locked into team-friendly contracts. It is time to win now, because they would hate to look back years from now like a reminiscent ex-lover and say, “That was the team that got away.”