Archive for March, 2015

Making the Case Against Baseball in Montreal

Through a lot of backroom deals and schemes, which are beautifully illustrated in Jonah Keri’s Up, Up, and Away, mayor Jean Drapeau was finally able to get Montreal, and Canada, a professional baseball team. The Expos were the first baseball franchise to be situated outside of the US. They were part of Major League Baseball from 1969 to 2004; in 2004 they relocated to Washington and became the Washington Nationals.

Throughout most of its history, baseball in Montreal has been a struggle, not just on the field but also off it. In fact, just getting a suitable stadium for the team was a headache. The Expos had to play their first seven years in a Triple-A ballpark called Jarry Park, which could only seat 28, 500 people. The stadium was less than ideal, it wasn’t a dome, and due to Montreal’s cold weather, many games in April and September had to be played on the road.

In 1977, however, the Expos finally got a new Stadium, Olympic Stadium. The unfortunate part, however, for the Expos, was that the primary designs of the stadium were for the Olympics and not baseball. In fact the Stadium, while a dome, was a disaster, in not just its facility but it’s location. It was located completely out of the way, and far from downtown. Charles Bronfman, owner and majority shareholder, often tried to get a new stadium in downtown Montreal, but was never successful. This was probably one of the most significant impediments in the Expos success as a franchise.

The Expos were often poor on the field, but more importantly, they were poor as a business, creating very little revenue (as compared to other major league franchises). They were also, as it seemed, always rebuilding, never being able to sign valuable free agents, and never having a high payroll. There attendance also wasn’t exactly great.

What now follows is an evaluation, of the Expos historical value as a franchise. The problems? Well there are several, one and perhaps the most important to remember, is that teams are privately owned, and therefore are not obliged to disclose any of their financial information. This makes evaluating a team’s overall value very difficult, but not impossible.

Most of you are probably familiar with Forbes. The problem, however, is that I was only able to find Forbes data from 1990 to 2014. I also was only able to find data on payroll, from 1985, on-word, leaving me essentially only with attendance to look at from 1969 to 2004. Attendance, and let me make this clear, is not the best way of measuring a franchise’s value, but since it’s the only data source I could find before 1985, I thought I’d use it. So, below is a chart comparing the Expos attendance history to league average.

MTL A

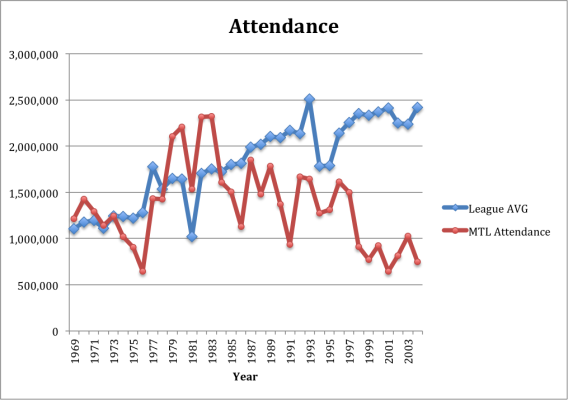
For most of its history, the Expos attendance was below average. A couple of other important elements to note are that in 1981, it was a labor-shortened season. That’s why you see the league wide drop in attendance. In 1998 also, while the league attendance was starting to rise, the Expos dropped dramatically. Perhaps this had something to do with the trade of Pedro Martinez to the Red Sox, in the 1997 offseason. Perhaps it had something to do with the franchise rebuilding, yet again, or perhaps there was still some lingering frustration from the 1994 season. None of this is certain, what is however is after 1996, Expos fans stopped showing up.

The goal though is not to gain a sense of attendance, but rather to get a sense of the franchise’s value. Attendance, in that matter has a number of shortcomings. It doesn’t tell us anything about the overall expenses, revenues, ticket sales, TV deals, income, ect… Rather, what it does is give us a sense of the fan’s interest in the team (though not entirely as it doesn’t consider TV ratings). While there seems to have been a significant interest in the team in the mid to low 80’s, the overall interest in the team tends to have been very minimal.

As I’ve mentioned because teams are privately owned enterprises, I had to rely on Forbes value system, which is only available from 1990 on-wards. This will skew the data. For example, from 1979 to 1990 was the Expos most successful era. During that time they only had two losing seasons, which coincided with their first and only playoff berth in 1981.

That being said, a team’s success on the field does not always translate to value. We should therefore not assume that since the Expos had good teams from 1979 to 1990 that the team’s value had risen significantly, if at all. Just take a look at the Rays and the A’s, both teams have won a lot of games, the last few years, and yet Forbes still ranks them among the lowest teams in value.

Also many of you might be wondering what goes into Forbes’ valuation process? How accurate is it? These are valuable questions and concerns. While there isn’t a ton of information out there on these issues, John Beamer did write an article in 2007, for The Hardball Times, which takes a look at how accurate Forbes’ valuation is and what goes into it. If you’re too lazy to read it, than just understand this, “The variance between the purchase price and the Forbes’ valuation averaged 20%…” also “The primary axis of valuation is team revenue, which includes things such as ticket sales, TV money, sponsorship, revenue sharing, concessions, parking and a myriad of other schemes that franchises use to wheedle money from their fans”.

In determining the value, Beamer looked at “recent deals” which ranged from years 1992 to 2006 where only two team values were past 2004 (Brewers and Nationals). Considering most of the data we will be looking at will be from years 1990 to 2004, Beamer’s valuations should not be considered outdated.

So considering that Forbes’ main valuation process is through revenue, that’s where we’ll go next. Below is a chart that compares Montreal’s revenue from 1990 to 2004, compared to league average. An element to note, the 2002 data for revenue was not available, that’s why you will notice a break in the graph.

MTL R

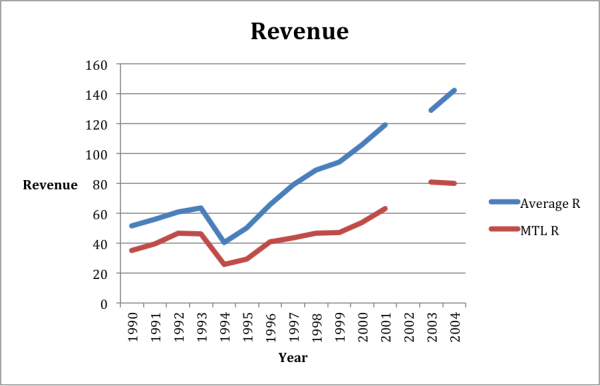
As you can probably tell, Montreal was always, below average when it came to revenue, and the gap seemed to be getting wider and wider as the years went on. It is also very disappointing that the 2002 data point was not available. There seems to be some kind of break or shift that happened that year, which would have been interesting to look at.

Even though revenue is the major contributor to value, it also states in Beamer’s article that “Major League Baseball franchises are typically valued at somewhere between 2-3x revenues”. To see the evidence of this, again read John Beamer’s article.

So now lets get to the moment you’ve all been waiting for, the Expos franchise value, compared to league average. I also included the median in the chart below. Why? Well in order to avoid teams that are skewing the data too heavily one way or another, such as the Yankees, the median seemed like a useful tool to add, although as you will be able to tell, there wasn’t a significant difference between the median and average.

MTL V

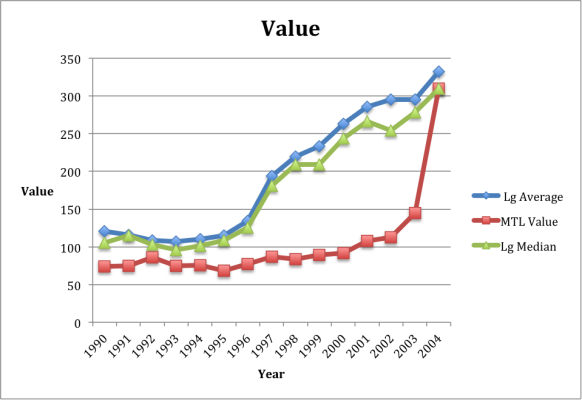
A lot of you might notice the sudden increase in value for the Expos, in 2004. Well, the Forbes’ valuations for 2004 came after the 2004 season. Thus the franchise was going to officially be the Washington Nationals, which immediately increased the team’s overall value.

Some of you at this point might be wondering how can value increase so significantly? Well, in order to understand what this means, I recommend you read John Beamer’s The Value of Ball Clubs (Part 1) and go to the valuation 101 section. If you don’t want to do that, then I’ll just summarize the concept. Basically what one is trying to do, in valuing any type of business, is trying to work out the value of today, in conjunction with the amount of cash flow a business or team will provide it’s owners in the future.

Ok, now that you got that, let’s look at one final chart, I promise! Here we’ll look at the Expos overall franchise value beginning with 1990, but will also include the Nationals value until 2011, in order to see how the move to Washington has paid off.

Expos to Nats

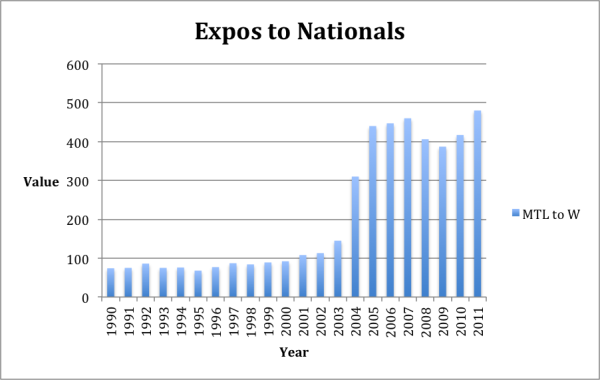
Now look at that huge increase in team value. Basically what Major League Baseball did, was turn one of it’s least profitable teams into an above average team. In fact, from 2003 to 2004 the team’s value changed 114 %. This was by far the biggest change in one-year value of any franchise. The next highest one-year percentage change, for 2004, was the Phillies at 39%. In fact, since Forbes has made their data available I have never found a one-year value % change as high as this one.

This looks like pretty damming evidence of the Expos franchise, and it is. Montreal’s first crack at a Major League Franchise was not a successful one. This, however, does not mean that it wasn’t important. Montreal was the first Canadian franchise to ever get a baseball team and it opened the doors for a team to come to Toronto.

That being said,, the prospects of Montreal getting a new team does look bleak, even after Rob Manfred’s comments, “Montreal’s a great city. I think with the right set of circumstances and the right facility, it’s possible.” Manfred’s comments were positive, when addressing Montreal, however, they were relatively vague. The notion of the right set of circumstances, for example, could mean anything. Also, for Montreal to get a team another team needs to re-locate and when addressing a team’s relocation, a popular team has been the Tampa Bay Rays.

The problem is that the Rays aren’t moving anytime soon. As Eric Macramalla points out in his article, Dream Killer: Sorry Expos Fans, The Tampa Bay Rays Aren’t Moving To Montreal. Basically the Rays aren’t going anywhere because they signed a Use Agreement, which “prevents the team from moving out of Tropicana Field and calls for potentially catastrophic monetary damages should the Rays abandon the stadium before its deal is up in 2027”. As for baseball expanding, well I haven’t exactly herd or read that baseball expects to expand anytime soon, so it doesn’t look like that is going to happen.

Then there’s the right facility, well just about every owner of the Expos has tried unsuccessfully to get a new stadium, and one downtown. At this point (and this is my opinion and should be taken that way), Montreal would need to construct a stadium downtown in order for them to receive a team. Which, given its history of incompetence in that matter seems unlikely.

Finally, could Montreal someday get a baseball team? Yes, when that will be, I don’t know, probably not anytime soon. Therefore Expos fans should not be holding their breaths. At this point, as it concerns a Major League Baseball Franchise there really is no evidence that Montreal can sustain a successful team. That being said, if I were Major League Baseball, I’d start by installing a Minor League Team and see how it goes. If it’s successful and fans are showing up, then perhaps re-consider.

References:


  1. John Beamer Articles for The Hardball Times: Part 1 http://www.hardballtimes.com/measuring-managing-the-value-of-ballclubs-part-1/
  2. Part 2: http://www.hardballtimes.com/measuring-managing-the-value-of-ballclubs-part-2/
  1. SABR Business of Baseball Committee, which provided most of the Forbes data. Also a great source of economic data, for baseball research.
  2. Eric Macramalla’s article “Dream Killer: Sorry Expos Fans, The Tampa Bay Rays Aren’t Moving To Montreal”.
  3. The Biz of Baseball for providing additional Forbes data.
  4. Ben Nicholson-Smith article Manfred: Return to Montreal ‘Possible’ for MLB, for the Manfred quote.
  5. Jonah Keri’s Up, Up, and Away.
  6. Attendance data was found at Baseball Reference.

2014 Projection Review (Updated)

Update: The previous version of this post, published last week, contained a data error that has now been fixed. Steamer/Razzball and Pod projections have been added and the hitter sample has been corrected from the prior version of this article.

Welcome to my 5th annual forecast review.  Each year, every projection submitted to me at http://www.bbprojectionproject.com is tested for error (RMSE), overall predictive power (R^2), and is then ranked.  I present both RMSE and R^2 because both have their uses. RMSE is a standard measure of forecast error, but this metric penalizes general optimism/pessimism about the run environment, even if a forecast has low error after controlling for the bias. For instance, Marcel is very good at predicting the run environment and the FanGraphs Fans are pretty terrible, so Marcel will usually have a better RMSE than the Fans. On the other hand, R^2 serves as a better test of the relative performance of players by ignoring any general biases in the forecasts that are pervasive in the forecasting system. Marcel tends to be lower in this metric versus other systems due to its rigid formula, whereas more sophisticated methods like ZIPS or Steamer tend to do better.

Comparisons are based on the set of players that every system projected. This amounts to 70 pitchers and 141 hitters for 2014. This is certainly limiting, but there is an inherent tradeoff in the number of projection systems that can be analyzed vs. the number of players that are projected by all systems. My policy is to consider as many projection systems as possible, as long as the number of players doesn’t get too low.

Now, on to the contest!

This year certainly saw some interesting results.  By the R^2 metric, the best forecaster for hitters (Dan Rosenheck) only published forecasts for hitter categories–evidently there’s some benefit in specialization when it comes to projecting baseball players. The best pitcher forecasts came from Mike Podhorzer’s Pod forecasts.  The best composite score came from my own personal forecast brew, which is computed based on an algorithm that estimates weights of other main-line forecasts. In a sense, this is not an original forecast, so I now note forecasts that I know use other forecasts as inputs with an “*” (I realize that to some degree, most everyone calibrates their forecasts to what they see other people doing). The next two forecasts are also of this same type, the AggPro and the Steamer/Razzball forecasts. The top “structural” forecast was Pod, followed by ZIPS, Rotovalue, and CBS.

In terms of RMSE, Dan Rosenheck ran away with the hitters, and my weighted average did the best among pitchers.  The top overall performers across categories were MORPS, Marcel, Rotovalue, and AggPro.

Overall, there are a few interesting comparisons to be made between projection systems across different years. Among the open-source stats community, Steamer vs ZIPS is always interesting to watch. In prior years, Steamer has been better. This year, however, ZIPS made huge gains and beat Steamer.  Marcel, had a typical year—with a very favorable ranking on RMSE but not R^2. The FanGraphs Fans had a down year, finishing near the bottom in most metrics.  CBS Sportsline is the top forecast by a major media company, which in general, tend to do poorly. Finally, most every projection submitted beat the naïve previous-season benchmark, where the 2014 forecast is simply the actual performance in 2013.  At least we’re all doing something right.

Thank you again to all who submitted projections. I invite anyone who is interested to submit their top-line hitter and pitcher projections to me at larsonwd@gmail.com.  You projection will be put up on http://www.bbprojectionproject.com as soon as I receive it, unless you want me to embargo it until the end of the season, which some people choose to do because of fantasy baseball or other proprietary reason.  All the code (STATA) and data for these evaluations are available upon request. If I’m using the wrong versions of anyone’s projections (which can happen!), please let me know.


R^2 Rankings:

Place Forecast System Hitters Pitchers Average
N/A Dan Rosenheck* 1.60 1.60
N/A Beans 5.00 5.00
1st Will Larson* 6.60 5.25 5.93
2nd AggPro* 8.40 6.25 7.33
3rd Steamer/Razzball* 6.20 9.00 7.60
4th Pod 11.20 4.75 7.98
5th ZIPS 10.00 7.25 8.63
6th Rotovalue 9.00 8.25 8.63
7th CBS Sportsline 10.20 8.00 9.10
8th ESPN 9.40 10.50 9.95
9th Steamer 9.60 11.50 10.55
10th Fangraphs Fans 13.60 9.00 11.30
11th Rotochamp 7.60 15.25 11.43
12th Razzball 11.60 12.25 11.93
13th MORPS 13.20 11.00 12.10
14th Clay Davenport 14.60 11.50 13.05
15th Cairo 8.20 18.00 13.10
16th Marcel 16.60 10.00 13.30
17th Bayesball 9.80 20.50 15.15
18th Guru 16.80 14.00 15.40
19th Oliver 16.40 15.00 15.70
20th Prior Season 20.40 18.75 19.58


RMSE Rankings:

Place System Hitters Pitchers Average
N/A Dan Rosenheck* 1.40 1.40
1st MORPS 4.20 8.50 6.35
N/A Beans 6.50 6.50
2nd Marcel 8.00 7.00 7.50
3rd Rotovalue 8.60 7.00 7.80
4th AggPro* 7.60 8.25 7.93
5th ZIPS 9.60 7.75 8.68
6th Clay Davenport 6.60 10.75 8.68
7th Steamer 7.80 11.00 9.40
8th Cairo 4.80 14.00 9.40
9th Steamer/Razzball* 9.80 10.00 9.90
10th Will Larson* 15.60 4.75 10.18
11th Guru 7.80 13.00 10.40
12th Rotochamp 10.20 11.50 10.85
13th Bayesball 7.20 15.25 11.23
14th Pod 15.80 8.75 12.28
15th Razzball 16.20 13.00 14.60
16th Oliver 14.40 15.25 14.83
17th ESPN 18.40 11.50 14.95
18th CBS Sportsline 17.40 13.50 15.45
19th Fangraphs Fans 19.40 13.25 16.33
20th Prior Season 20.00 20.50 20.25


RMSE, Hitters:

system r rank hr rank rbi rank avg rank sb rank AVG
Dan Rosenheck* 19.22 1 7.07 1 20.91 1 0.024 2 6.24 2 1.40
MORPS 20.56 2 7.70 3 22.35 2 0.027 13 6.13 1 4.20
Cairo 21.55 3 7.87 6 22.53 3 0.025 9 6.30 3 4.80
Clay Davenport 21.91 6 7.92 7 23.74 8 0.025 8 6.33 4 6.60
Bayesball 22.47 9 8.24 10 24.03 10 0.022 1 6.39 6 7.20
AggPro* 22.64 12 8.23 9 23.34 6 0.024 3 6.42 8 7.60
Steamer 22.58 10 8.22 8 23.37 7 0.025 7 6.41 7 7.80
Guru 22.62 11 7.74 4 23.76 9 0.025 6 6.88 9 7.80
Marcel 21.67 4 7.62 2 22.76 4 0.027 16 7.04 14 8.00
Rotovalue 22.03 7 7.77 5 23.02 5 0.026 10 7.07 16 8.60
ZIPS 22.11 8 8.46 11 25.30 14 0.024 4 6.94 11 9.60
Steamer/Razzball* 23.87 13 8.73 13 24.75 13 0.024 5 6.35 5 9.80
Rotochamp 21.73 5 8.49 12 24.60 12 0.026 12 6.93 10 10.20
Oliver 24.67 16 9.26 18 26.86 16 0.026 11 6.94 11 14.40
Will Larson* 24.88 17 8.75 14 24.37 11 0.029 19 7.08 17 15.60
Pod 24.23 14 9.10 16 26.54 15 0.035 21 7.04 13 15.80
Razzball 24.57 15 8.90 15 27.45 19 0.027 14 7.14 18 16.20
CBS Sportsline 26.28 19 9.94 21 26.90 17 0.027 15 7.06 15 17.40
ESPN 25.88 18 9.88 20 27.25 18 0.028 17 7.32 19 18.40
Fangraphs Fans 27.20 21 9.24 17 28.98 21 0.029 18 7.62 20 19.40
Prior Season 26.56 20 9.39 19 28.77 20 0.033 20 7.84 21 20.00


R^2, Hitters:

system r rank hr rank rbi rank avg rank sb rank AVG
Dan Rosenheck* 0.267 1 0.329 1 0.181 1 0.373 2 0.679 3 1.60
Steamer/Razzball* 0.143 12 0.270 5 0.150 8 0.325 5 0.689 1 6.20
Will Larson* 0.162 10 0.263 8 0.165 5 0.320 6 0.676 4 6.60
Rotochamp 0.227 2 0.268 7 0.127 15 0.293 9 0.675 5 7.60
Cairo 0.166 7 0.259 10 0.165 4 0.288 12 0.659 8 8.20
AggPro* 0.129 15 0.269 6 0.141 11 0.352 3 0.660 7 8.40
Rotovalue 0.164 8 0.272 3 0.167 2 0.278 14 0.574 18 9.00
ESPN 0.166 6 0.253 12 0.166 3 0.273 16 0.656 10 9.40
Steamer 0.130 14 0.260 9 0.135 12 0.317 7 0.661 6 9.60
Bayesball 0.144 11 0.235 17 0.148 9 0.424 1 0.655 11 9.80
ZIPS 0.180 4 0.244 14 0.124 16 0.347 4 0.652 12 10.00
CBS Sportsline 0.162 9 0.243 15 0.151 7 0.266 18 0.682 2 10.20
Pod 0.183 3 0.271 4 0.128 14 0.111 21 0.641 14 11.20
Razzball 0.128 16 0.281 2 0.159 6 0.256 19 0.639 15 11.60
MORPS 0.174 5 0.217 19 0.132 13 0.288 13 0.636 16 13.20
Fangraphs Fans 0.103 19 0.255 11 0.116 18 0.289 11 0.657 9 13.60
Clay Davenport 0.134 13 0.237 16 0.143 10 0.271 17 0.622 17 14.60
Oliver 0.065 21 0.223 18 0.101 20 0.289 10 0.648 13 16.40
Marcel 0.119 17 0.250 13 0.122 17 0.275 15 0.515 21 16.60
Guru 0.118 18 0.210 20 0.109 19 0.311 8 0.555 19 16.80
Prior Season 0.094 20 0.206 21 0.093 21 0.197 20 0.525 20 20.40


RMSE, Pitchers:

system W rank ERA rank WHIP rank SO rank AVG
Will Larson* 4.77 2 0.992 6 0.148 10 56.62 1 4.75
Beans 4.82 4 0.983 3 0.148 11 58.88 8 6.50
Marcel 4.90 8 1.003 11 0.143 4 57.93 5 7.00
Rotovalue 4.83 6 0.978 2 0.151 17 57.26 3 7.00
ZIPS 5.06 15 0.965 1 0.139 1 60.06 14 7.75
AggPro* 4.94 9 0.992 7 0.144 7 59.18 10 8.25
MORPS 4.71 1 1.026 18 0.149 13 56.69 2 8.50
Pod 4.82 5 0.995 10 0.144 8 59.75 12 8.75
Steamer/Razzball* 4.89 7 1.004 12 0.150 15 58.20 6 10.00
Clay Davenport 4.78 3 1.015 15 0.148 12 59.80 13 10.75
Steamer 4.94 10 1.006 14 0.150 16 57.89 4 11.00
ESPN 5.40 18 0.994 8 0.141 3 63.31 17 11.50
Rotochamp 5.04 14 0.989 4 0.145 9 64.18 19 11.50
Razzball 5.25 17 0.990 5 0.149 14 62.89 16 13.00
Guru 4.96 12 1.055 19 0.144 6 61.96 15 13.00
Fangraphs Fans 5.56 20 1.005 13 0.141 2 64.09 18 13.25
CBS Sportsline 5.47 19 0.995 9 0.143 5 67.18 21 13.50
Cairo 4.96 11 1.022 17 0.170 21 58.76 7 14.00
Oliver 5.12 16 1.019 16 0.151 18 59.73 11 15.25
Bayesball 5.04 13 1.082 20 0.163 19 59.11 9 15.25
Prior Season 5.64 21 1.157 21 0.169 20 64.99 20 20.50


R^2 Pitchers:

system W rank ERA rank WHIP rank SO rank AVG
Pod 0.229 1 0.174 9 0.302 5 0.134 4 4.75
Beans 0.184 5 0.196 3 0.269 10 0.136 2 5.00
Will Larson* 0.194 3 0.199 2 0.269 11 0.133 5 5.25
AggPro* 0.190 4 0.190 6 0.287 7 0.121 8 6.25
ZIPS 0.137 12 0.207 1 0.331 2 0.102 14 7.25
CBS Sportsline 0.222 2 0.176 8 0.330 3 0.079 19 8.00
Rotovalue 0.158 9 0.183 7 0.242 16 0.179 1 8.25
Fangraphs Fans 0.122 16 0.161 13 0.372 1 0.125 6 9.00
Steamer/Razzball* 0.167 8 0.192 4 0.254 14 0.111 10 9.00
Marcel 0.137 13 0.146 14 0.302 6 0.122 7 10.00
ESPN 0.146 11 0.171 11 0.309 4 0.101 16 10.50
MORPS 0.181 6 0.112 18 0.236 17 0.134 3 11.00
Steamer 0.128 15 0.192 5 0.254 13 0.104 13 11.50
Clay Davenport 0.177 7 0.120 15 0.252 15 0.117 9 11.50
Razzball 0.154 10 0.174 10 0.257 12 0.097 17 12.25
Guru 0.115 17 0.106 19 0.281 9 0.109 11 14.00
Oliver 0.133 14 0.119 16 0.225 18 0.107 12 15.00
Rotochamp 0.079 20 0.170 12 0.283 8 0.037 21 15.25
Cairo 0.115 18 0.118 17 0.178 19 0.097 18 18.00
Prior Season 0.088 19 0.028 21 0.164 20 0.102 15 18.75
Bayesball 0.077 21 0.103 20 0.159 21 0.060 20 20.50


The Fans Versus the Depth Charts

By now it’s common knowledge that the projections created by the Fans here at FanGraphs are much more optimistic than Steamer or ZiPS or the combination of Steamer and ZiPS used in the Depth Charts. Of course, this isn’t totally fair because of the difference in projected playing time. The Fans project more playing time for most players so those players will generally be projected for more WAR. The Depth Charts can be altered at any time by the people behind the curtain to reflect current injuries or changes in playing time estimates, while the Fans projections have been coming in for the last couple months and don’t accurately reflect recent changes in expected playing time. Still, I thought it would be interesting to look at the Fans versus the Depth Charts to highlight the players with the largest difference in WAR when comparing the two. This information is from Friday the 13th, so the Depth Charts may have had some changes since then. There are 326 players with projections from the Fans and the Depth Charts.

To get this party started, consider the graph below. This graph shows the difference between the Fans projected WAR and the Depth Charts projected WAR for each player in increment of WAR from -1.0 to 2.6. The players on the far left, at -1.0 WAR, are projected for 1.0 less WAR by the Fans than the Depth Charts. The thick line above 0.0 is the dividing point between negative WAR and positive WAR. There were 19 players projected for the same WAR by the Fans and the Depth Charts.

This shows very clearly that the majority of players are projected by the Fans to have more WAR than the Depth Charts are projecting for that player. Can you guess the identity of the player on the far right, the guy who is projected for 2.6 more WAR by the Fans? He’s a FanGraphs’ favorite. It’s *Mookie Betts! A little to his left, at 2.2 more WAR, is Steven Souza. On the other end, the two hitters projected for 1.0 less WAR by the Fans are Mark Trumbo and Drew Stubbs.

*Mookie Betts is projected by the Depth Charts to have 371 PA with a .275/.343/.416 batting line. The Fans project him for 633 PA with a .294/.368/.435 line. The Fans also project him to have better fielding and base running numbers.

The pie chart below shows the breakdown of players projected for less WAR, the same WAR, and more WAR by the Fans. As you can see, 80% of the players are projected for more WAR by the Fans than the Depth Charts.

As mentioned above, the Fans project more playing time for most players than the Depth Charts project. The graph below shows the breakdown by plate appearances when comparing the Fans to the Depth Charts.

Again, not surprising. The Fans consistently project more playing time. The breakdown for plate appearances shows that 79% of the players were projected for more plate appearances by the Fans. This matches up well with the WAR projections, as 80% of the players were projected for more WAR by the Fans. Individually, the three players projected for the greatest difference in plate appearances by the Fans are Danny Espinosa (+296), Jon Singleton (+279), and Robbie Grossman (+277). The four players to the extreme in the other direction are Jake Marisnick (-151), Marcus Semien (-151), Maikel Franco (-145), and Brendan Ryan (-130). The Fans don’t expect these four players to get the kind of playing time the Depth Charts are projecting. Just for fun, the players who have the most similar projections for plate appearances are Marcell Ozuna (-2), Nick Franklin (+1), Justin Turner (+1), and J.D. Martinez (+2).

It’s not all about playing time, though. To find out how much of the higher projection of WAR by the Fans is due to playing time and how much is based on actual production on the field, I adjusted the Fans’ WAR projections to the same number of plate appearances being predicted by the Depth Charts and created the following graph and accompanying pie chart.

Even after adjusting to an equivalent number of plate appearances, the Fans are projecting 75% of the players to have more WAR than the Depth Charts are projecting. This shows that the Fans are consistently projecting hitters to perform better. They are also projecting these hitters to be better fielders and base runners than the Depth Charts are projecting. Consider the table below that shows the average line for these hitters based on the Depth Charts and based on the Fans.

The Fans are projecting these players for an average of 49 more plate appearances and a better hitting line across the board, along with better Fld and BsR and about 0.6 more WAR per hitter.

Let’s look at some individual players, starting with the true oddballs: the players the Fans like much LESS than the Depth Charts. These are the adjusted numbers, meaning that the WAR projected by the Fans is adjusted to the number of plate appearances projected by the Depth Charts. These are the players for whom, playing time being equal, the Fans like much less than the Depth Charts.

All nine of these players are projected by the Fans to hit worse than their Depth Charts projection would suggest and six of the nine players are projected to be worse fielders. I’d say the most surprising player on this list would have to be Mike Trout. As good as the Fans believe Trout will be, the Depth Charts like him even more. Based on raw numbers, Trout is projected for 8.6 WAR by the Depth Charts and 8.2 WAR by the Fans, but the raw numbers show Trout projected by the Fans for 686 plate appearances. In the chart above, Trout’s plate appearances are adjusted down to the 644 projected by the Depth Charts, which drops his WAR to 7.7 and creates a difference of -0.9 WAR. The WAR difference can be attributed to a worse projected wOBA (.401 to .411) and worse fielding.

Other notes on these players:


  • The Depth Charts project a .339 wOBA for Mark Trumbo, while the Fans have him at .321. Last year, Trumbo finished with a .308 wOBA. The year before, he was at .322. His career mark is .326 and he’s had a wOBA of .339 or more just once in his four years as a regular (or semi-regular) player. The Fans might end up being more accurate on Trumbo than the Depth Charts.
  • Drew Stubbs has a projected wOBA of .313 by the Fans and .327 by the Depth Charts. He had his best-hitting season last year with a .358 wOBA, all of it Coors Field inflated (.431 wOBA at home, .276 on the road).
  • Torii Hunter will be 85 years old this year (not really) and it looks like the Fans are pegging him for age-related decline, with a projected wOBA of .319 compared to the Depth Charts’ .327. Hunter hasn’t had a wOBA below .330 since 2003. The Fans are also projecting Hunter to be even worse in the field than the Depth Charts expect.


So, what players do the Fans REALLY like? Which players are projected for significantly more WAR by the Fans than the Depth Charts? Again, the following numbers are adjusted, meaning the players’ plate appearance totals are adjusted to their Depth Chart projections. With this adjustment, FanGraphs’ favorite Mookie Betts is not the most-liked player. Instead, Mr. Steven Souza rises to the top, with his former teammate, Michael Taylor, right there with him, and Joc Pederson rounding out this trio of young Fan favorites.

The Fans project all of these players to hit better, field better, and have better (or equal, in the case of Michael Cuddyer) base running numbers than the Depth Charts are projecting. In the case of Michael Taylor, the Fans are VERY optimistic, projecting a .336 wOBA compared to a .290 wOBA expected of the Depth Charts. The numbers for Taylor are based on just five fans, though, so take this with a giant grain of salt.

Eight of these nine players are young, have little major league experience, or both. Michael Cuddyer is the lone veteran. Cuddyer is coming off back-to-back years with wOBAs of .396 and .414. Of course, those seasons were in Colorado, where Cuddyer took full advantage of the park’s friendliness to hitters. Last year, Cuddyer had a .533 wOBA at home and .324 on the road. In 2013, it was a slightly more reasonable .427/.369 split. He will call Citi Field home this year and the Depth Charts are forecasting a .329 wOBA, while the optimistic Fans see Cuddyer posting a .352 mark.

Souza, Taylor, Pederson, Pompey, and Castillo have almost no major league track record to speak of yet the Fans are projecting them all to be above-average players. It’s very likely that these players will be drafted higher than they should be in the fantasy world. Everyone likes the shiny new toy, but young and inexperienced players generally take time to develop into fantasy assets.

Here is the next group of players liked much more by the Fans projections than the Depth Charts (again, adjusted to equal playing time based on the Depth Charts projections):

This group of players has a few with limited major league experience, such as Kevin Kiermaier, Joe Panik, Jose Ramirez, and Jorge Soler, but also includes a few players who have four or more big league seasons under their belts (Kyle Seager, Lorenzo Cain, Francisco Cervelli). Almost all of these players are projected by the Fans to hit, field, and run better the Depth Charts would suggest. One very notable number on this chart is the relative optimism of the Fans for Wil Myers on defense.

Going back to Kyle Seager, the Fans are projecting a career-high wOBA for Seager, at .354. His career mark is .333. He’s increased his wOBA in each year of his major league career, from .306 to .321 to .337 to .346. The Fans see another increase, while the Depth Charts are projecting regression back to his 2013 mark.

Other notes of interest:

  • The Fans project Kiermaier to equal his wOBA from last year’s 108 games with the Rays (.333 last year, projected for .332). The Depth Charts have him at .304.
  • The Fans like Josh Rutledge to be close to his career .312 wOBA (projected for .314), but the Depth Charts have him way down at .284.
  • In less than a half-season of playing time, Joe Panik had a .317 wOBA last year. The Fans have him projected for a .312 wOBA, while the Depth Charts see much more regression, down to a .291 mark.
  • In his two seasons in the bigs, Wil Myers has posted a .357 wOBA and a .275 mark. Of course, he dealt with injuries last year, which likely contributed to that disappointing performance. The Depth Charts are projecting a .329 wOBA for Myers this year, while the Fans have him with a .345 wOBA. Both projections are worse than what Myers did in his rookie year but much better than what he did last year.
  • Soler was crazy-good in 24 games last year (.386 wOBA). The Depth Charts have him regressed down to a .339 wOBA, while the Fans have him projected for a .364 mark.
  • In 785 career plate appearances, Francisco Cervelli has a career .327 wOBA. The Fans are projecting him for more of the same (.325), while the Depth Charts don’t think he’ll come close to that (.300).


Okay, last group. After adjusting to equalize the playing time, the following players are projected for 1.2 more WAR by the Fans than the Depth Charts:

Here we’re starting to see a few bigger names, like Joe Mauer, George Springer and Adam Jones.

  • Joe Mauer has a career .372 wOBA but is coming off a season that saw him with the second-lowest mark of his career, at .322. In the two previous seasons, Mauer had wOBAs of .376 and .383. The Fans are projecting a .357 wOBA, while the Depth Charts are not that optimistic, projecting a .338 mark.
  • George Springer’s career wOBA (.352) is between his 2015 Depth Charts projection (.346) and Fans projection (.366).
  • Adam Jones has reached his 2015 Fans projected wOBA of .355 just once in his career, back in 2012.
  • Jedd Gyorko hit .249/.301/.444 with a .325 wOBA in 2013, then followed that up with a .210/.280/.333 (.275 wOBA) season last year. The Fans see a return to his 2013 glory days (.328 wOBA), while the Depth Charts see improvement (.308 wOBA) but not to the level of two years ago.

The Fans projections are optimistic on most players, but the players listed on the three charts above are the players that the Fans like most of all. Many of them are young with limited major league playing time. It will be interesting to see how accurate the Fans are on these players at the end of the season.


Analyzing David Wright With Just One Swing

2014 was a disappointment for David Wright, posting his lowest career numbers in almost every offensive category: OBP, SLG, OPS, ISO, wRC+, wOBA, and WAR. Cries of Wright being washed up began springing up immediately – he’s a 31-year-old who saw significant drops in almost every offensive category possible. However, everything might not be as it seems.

Wright injured his left shoulder early in the season and tried to play through it before finally getting shut down in September. Here’s Wright’s home run chart for 2014.

Now here’s his home run chart for 2012-13.

Do you notice a difference? Wright did not hit a single home run to right or center field the entire season last year, and that’s always been something of a trademark for him. The injury to his front shoulder had a clear effect on his opposite field power, and that effect (or lack thereof) was apparent in yesterday’s Mets-Nats spring training game, where Wright did this.

Now that right there is something that Mets fans haven’t seen since Wright’s 2013 season, where he did it rather regularly, such as this home run against Craig Kimbrel.

Look at those two swings: the exact same swing, both demolishing the ball to the same spot of the field. By all accounts, David Wright is healthy. His shoulder is 100% and he’s in The Best Shape of His Life. In baseball, you never want to use a sample size of one to draw a conclusion, but when Captain America comes into the season showing off the trademark power he didn’t show in the Mets’ previous 162 games, there’s plenty of reason to get excited.

Just look at this swing. That’s the swing of a man ready to put America (and the Mets) on his back.


Comparing Ben Revere to Nook Logan

Note: Post was written on March 12. Truths may be falsehoods by the time you read this.

So Nook Logan was trending on FanGraphs this morning. Still is, in fact, as of this writing—he is eighth on the “Major League Players” list, sandwiched between Clayton Kershaw and Yasiel Puig—and that piqued my interest. So I looked at his FanGraphs profile. Upon this inspection, I found that Logan seems to compare quite favorably to another center fielder who started with an AL Central team and moved to a NL East team: Ben Revere. Logan, from a quick glance at his stats, appears to have good speed, but no power and a good glove, but no arm: all traits possessed by Mr. Revere.

First, let’s establish each of these characteristics.

Logan stole exactly 23 bases in each of his two full seasons: 2005 with Detroit and 2007 with Washington. Revere has played three full seasons, with at least 34 steals in each of those seasons, plus another 22 in an injury-shortened 2013. So maybe Revere has more speed. According to their Speed Scores (Spd), where Logan is rated at a 7.4 and Revere at a 7.0, Logan is faster, or at least utilizes his speed better. Both are “Excellent” scores, though, and the FG glossary tells us to look at UBR, so we do. “Hmm,” we say. “Revere has a much higher UBR than Logan.” And yes, this is true. And yes, Revere also has higher values in everything related to base running. So we’ll say that Revere is a far superior baserunner despite Logan’s slightly better speed.

“No power” is not hard to determine. Logan has never had an ISO above .089. Revere has only had two ISOs above .100, and he hit a combined one home run in those seasons (his first two minor-league seasons). He was just hitting and running, and getting a lot of triples. Such is the life of a minor-league speedster. But I will take this time to mention something: Revere has a career K rate of 9.1%, only rising above ten percent three times—once in the minors, once in his “cup of coffee” 2010, and once in his injury-plagued 2013. His walk rate, though, is bad. Like really bad. Like it was barely above the amount of fat in my milk last season bad. Logan, on the other hand, had a better (and more consistent) walk rate, hovering around six percent his entire career (save for an 8.6% rate his rookie year). But he struck out a ton. Or, rather, he struck out a normal amount, then got sent down by the Tigers and started striking out a lot more, and continued to strike out at high rates after being dealt to the Nats. I don’t know what to make of this data, but it is a dissimilarity.

Now we turn our attention to a section I didn’t mention in what an English teacher might call my thesis sentence: batted-ball rates. Both men hit a high amount of ground balls, over 50 percent in all but one season (Logan’s short 2006 campaign, when he hit only 46.7% ground balls, is the lone exception). This doesn’t give us the full picture: while Logan certainly hit his fair share of grounders, he also hit a fair amount of fly balls, checking in at 29 percent for his career, with a 7.9% infield fly rate. Revere, on the other hand, hit so many ground balls that it might be considered unhealthy if he weren’t so doggone fast. Revere has managed to hit about one-seventh of his BIP in the air, and only 3.4 percent of that has been represented by popups. So, um, Logan hit more fly balls, but the same amount of home runs (two). Say what you want about the fact that he would have four in Revere’s sample size.

And now, defense: the hardest part to talk about, because there are so many ways to statisticize (that can’t be a word) it and none of them have become the “standard” method of measuring defensive contributions. First, we’ll only be discussing Logan’s and Revere’s performance in center field, because it is their primary position and also because they have played a not-dissimilar amount of games at that position. First of all, when normal people (I’m weird, you’m weird, everybody’m weird) talk about defense, they think of errors and assists, probably. Or just they think of how many times they saw that one guy make that one catch—you know, the one where he dives, makes the catch, makes another, leaping, catch at the wall, and then throws out all twelve baserunners, including the guy going from fifth base to shortstop, saving the game and making it onto the Top Ten playlist seven hundred million times. Okay, that was a lot of mumbo-jumbo that basically meant, “normal people don’t think in terms of UZR and TZL, they think in terms of highlight plays and errors”.

And now, the actual discussion of defense. Logan had eight assists, 11 errors, and a .985 FLD% in 306 games. Revere had 13 assists, 13 errors, and a .986 FLD% in 362 games. So it can be said that both are players who do their job mostly, but also have little to nothing in the way of arm strength. ARM thinks that they’re basically the same player, but UZR thinks that Logan is eighty times better at defense than Revere, so okay. They have very similar Fielding values, though. ¯\_()_/¯

So yeah, maybe this served no point, but I like writing semi-pointless things about semi-obscure players. Maybe you can expect more of the same in the future.


Dodgers Bullpen: Waiting for Kenley

With the news that Kenley Jansen is going to miss 8-12 weeks with surgery on his landing foot, the Dodgers are going to need to find someone to close games for them possibly until mid-May. Over the past five seasons, Andrew Friedman has cobbled together bullpens in Tampa that ranked 11th in WAR in the majors. Not stellar, but definitely better than the 24th place the Dodgers have ranked over that same span. Has he given Don Mattingly the right mix to fill the hole left by Jansen, or is he going to go out and add a Rafael Soriano or Francisco Rodriguez through free agency, or will he reach out to the Phillies and try to make a deal for Jonathan Papelbon?

They have a number of holdovers in the mix in Pedro Baez, J.P. Howell, Brandon League and Paco Rodriguez. Friedman has added a plethora of relief arms in former Ray Joel Peralta, Chris Hatcher, Juan Nicasio, and Sergio Santos. After we look at Jansen, we’ll sift through this pile and see who might emerge as the early-season closer, and see if there are any cheap strikeouts or holds.

Kenley Jansen

Prior to undergoing surgery that will shelve him for 8-12 weeks, Kenley Jansen was considered a top closer. He still should be after he gets his boot off and gets back to unleashing his 94 mph cutter against the masses. He’s basically a one-pitch pitcher, as he throws the cutter 88.9% of the time, mixing in the odd slider and sinker.

He’s been one of the most consistent pitchers in baseball over the past three seasons, however, there is a troubling trend:

K% BB% FIP BABIP LD%
2012 39.3 8.7 2.40 .221 18.8
2013 38.0 6.2 1.99 .273 24.1
2014 37.7 7.1 1.91 .350 27.6

You’ll notice the K%, BB% and FIP are fairly consistent, but the BABIP and LD% have increased 58.4% and 46.8% over the past two seasons respectively. Not a good recipe for success. He’s going to need to get that LD% back to a more respectable level. If he can do that, then the BABIP should follow. He has no issues emasculating righties, as he held them to a .229 wOBA and struck out 47.5% of them, placing him second behind Aroldis Chapman in that category. If he can get the cutter inside to lefties instead of trying to backdoor it so often, maybe he can break a few more bats. He’s getting groundballs 45.1% of the time against lefties, but they touched him for a .378 BABIP.

vs Lefties Away/Off Middle In/Off
Usage 47% 27% 26%
BAA .393 .343 .253

If he can keep them from extending against it, he should have even more success.

Joel Peralta

One of the names being bandied about as a possible Jansen replacement is Joel Peralta. Andrew Friedman brought him over after seeing him up close in Tampa. Last year he had batters chase more than most pitchers did, with an O-Swing% of 35.5%. They also swung at less pitches in the zone, with a 64.2% Z-Swing%. How much of that was thanks to the framing skills of Jose Molina and Ryan Hanigan? When Yasmani Grandal is behind the plate, he’ll enjoy the same benefits, but when A.J. Ellis is back there, the zone is going to be smaller.

His 4.41 ERA in 2014 is not one you would expect to see from a guy who could be racking up a few early saves. A 3.11 xFIP and 2.54 SIERA are a little closer to what you’d expect to see from your ninth-inning guy. He’s got a three-pitch mix, with a four-seamer, curve, and splitter, with the splitter being the most effective of the three. If you’re looking for the saves that will be sopped up with Jansen out, I don’t think you’re going to find them here.

Brandon League

Brandon League used a 94 mph sinker and 86 mph splitter to generate an inordinate number of groundballs last year. Hitters didn’t have any problem making contact with the sinker, as they only had a 5.0% whiff rate on the pitch, but when they did put it in play, they smashed it into the ground 71.8% of the time. His overall 67.5% GB% was second amongst relievers last year.

League isn’t going to get many outs via the strikeout, as he only had a 13.9% K rate. Not what you want out of someone pitching the late innings for you. His walk rate of 9.9% isn’t that hot either, but he mitigated it by inducing the most double plays in the majors amongst relievers. Considering the group assembled here, you could do worse with League closing out April and early-May games.

J.P. Howell

Most bullpens would love to house a guy who posts a 1.33 ERA in 47.3 innings, especially a lefty who can retire both RHB and LHB. If you do what we all hate, and take out 1.7 innings against the Cubs in September where he surrendered six earned runs, that’s what you have. He boasts a sinker-curve combo that entices his foes to keep the ball on the ground 57.5% of the time.

One might look at his 49 innings in 68 appearances and see LOOGY. In fact, he was deployed against lefties 52.3% of the time and held them to a 167/284/227 line. Math would tell you he faced righties the other 47.7% of the time, and they only slashed 193/301/284 against him. He has shown he can handle both, and maybe this year you’ll see him get at least three outs in more than 28 of his 68 appearances.

If you’re in a league that likes holds, you could do worse than the 27 he posted in 2014. It will depend how he’s used, however. 2014 saw him come in to a pLI of 1.33, as opposed to 0.81 in 2013. Maybe that was Mattingly realizing what he had, or maybe it was him having to fill the size 14 spikes of Paco Rodriguez(spike size simply an estimate,) but it was a huge leap from the 11 holds he accrued in 2013 under the same regime.

Pedro Baez

Pedro Baez used his 96 mph four-seamer to his advantage in 20 innings in 2014. Using it three quarters of the time, he produced a tiny 0.88 WHIP. Don’t count on that again this season though, as it was fueled by a .197 BABIP. His 19.6% K% and 5.4% BB% aren’t shabby, but don’t expect him to be seeing to many high-leverage opportunities in the early going, if he even breaks camp with the Dodgers. Until he gets a secondary pitch that hitters fear, they’re going to be teeing off on his flaming arrow.

Chris Hatcher

You won’t find many short relievers who display a legit four-pitch mix, especially guys who were calling the pitches as recently as 2010. He throws a four-seamer and a sinker, both at 96 mph, and deviates with a couple of 88 mph offerings in his slider and splitter. The least-used pitch is the slider, at 17%, with the four-seamer topping out as at 42%.

In 56 innings with the Marlins after being recalled in late May, he posted a 25.9% K rate, coupled with a 5.2% BB rate. Not too shabby. His 3.38 ERA isn’t anything special, but his 2.56 FIP is almost a run better. If he can solve his homesickness (5.34 road ERA), and couple that with a stellar 1.32 home ERA, you may have a late-inning stud on your hands here. The difference could be as simple as dumb luck, with a 57.9% road LOB% and a 90.9% home LOB%, even with similar .337 and .313 BABIPs respectively.

With Jansen out, if the Dodgers stay in-house and let the dominoes start to fall, Hatcher could be one to get behind for 70+ innings and 80 or more whiffs. Keep an eye on him in the spring, if he goes west from Camelback Ranch, he could be a cheap source of goodness for you. If they bring in Chamberlain, Rodriguez, Papelbon or another name, however, he could find himself back in AAA. Which would not be smart.

Paco Rodriguez

Remember when Paco Rodriguez burst onto the scene with his Statue of Liberty motion, liberating his way to a 2.32 ERA and 20 holds in 2013? What happened last year? Well his ERA went up to 3.86, but both his FIP and xFIP went DOWN by 0.16 and 0.31 respectively. Maybe his LOB% going from 81.8% to 68.5%, combined with his BABIP exploding from .210 to .324 had something to do with it?

Sure he threw 40 innings less at the Major League level in 2014 and he lost 2 mph off his already pedestrian 89.6 mph fastball, but I’d expect something closer to 2013, if Mattingly hasn’t totally soured on him. He should get you more than a strikeout an inning, and if Howell falters or gets hurt, Rodriguez will be there to sop up those innings.

Sergio Santos

Remember when so many of us rushed to grab him last year because he was going to be closing in Toronto? Five April saves in the first two weeks of the season were pretty hot, but then his history of arm troubles bounced back to take him totally out of fantasy relevance. IF, he has a healthy spring and breaks camp with the Dodgers as an NRI, and IF, you’re in a crazy-deep mixed league, maybe you look to him for some holds. Promise yourself though, that if these unlikely events manage to come together, that you drop him like he’s hot at the first poor outing. Decreased velocity won’t be the first sign, because he actually ticked up one mph across the board through May, before taking two steps back. Nobody wants to see a guy hurt, but be on the lookout for warning signs if you’ve decided to roster him.

Juan Nicasio

The erstwhile Rockie starter seems to be primed for a shift to the pen. He ticked up a couple miles an hour after the Rockies gently placed him there in the second half of 2014, and was able to ditch his change. If he’s able to locate 95 and then subtract ten mph with a slider, that could be a dangerous weapon in the pen. He threw more than one inning a few times in Colorado, let’s see if Mattingly chooses to deploy him in the same way. With a 15.0 K%-BB% in relief, he’s not too bad of an option.


The Value and Consistency of Pitcher Inconsistency

There was an article published in 2013 on FanGraphs that focused on the value of starter inconsistency. The basic idea is relatively simple – a starter who does terribly in one start and very well in the next (e.g., 8 runs in 2 innings followed by 2 runs in 8 innings) gives his team better chances to win than one who is mediocre in two starts (5 runs in 5 innings both outings). Mr. Hunter did some math to illustrate the fact, and quantify it somewhat, but it was a relatively rough measure, and I think the concept is intuitive enough not to gain a ton from a rough demonstration. Definitely read that article, though!

I think the first question that comes to mind upon reading that is: is this sustainable? Is consistent inconsistency possible? To find out, I came up with a relatively simple measure of inconsistency within a season. For every pitcher, I calculated the standard deviation of the Game Scores for each of their starts. If you’re not familiar with Game Score, it’s a Bill James-developed metric that gives pitchers points for outs and strikeouts and docks them points for hits, walks, and runs. It’s mostly a narrative stat, but I think it does a good job of illustrating the quality of a given start. The best start of 2014 by Game Score: Clayton Kershaw’s no-hitter against the Rockies, on June 18th, in which he didn’t allow a hit or walk (damn you Hanley Ramirez) and struck out 15, good for a Game Score of 102. The worst: Colby Lewis’s July 10th start, in which he went 2.1 innings, gave up 13 hits and gave up 13 runs. Didn’t walk anybody! Still had the abysmal Game Score of -12. The 2014 Rangers, ladies and gentlemen.

By looking at the standard deviation of a season’s worth of Game Scores, we get a measure of the inconsistency of their quality. I set a minimum of 10 starts to qualify, which ensures no one is being labeled consistent off a single week of pitching. The usual caveats apply – pitchers needed to be good enough to pick up 10 starts, so this is a snapshot of usage, not just skill. Before looking at the year-to-year correlation, I want to look at the most consistent and inconsistent starters of 2014.

 Rank Name Games Started FIP Game Score StDev
 1 Miles Mikolas 10 4.77 24.73
 2 Jerome Williams 11 4.09 23.25
3 Brandon Cumpton 10 3.22 21.97
 4 Robbie Ross 12 4.74 20.88
 5 Juan Nicasio 14 4.18 20.84
 …
 178 Jordan Lyles 22 4.22 11.40
 179 Kyle Hendricks 13 3.32 10.98
 180 Marco Estrada 18 4.88 10.46
 181 Mike Fiers 10 2.99 10.00
 182 David Buchanan 20 4.27 9.85

Not surprisingly, we see a lot of starters with fairly low numbers of starts, since extreme values (either high or low) are likely to regress toward the variance for the whole sample (15.53 in 2014) as the number of starts increases. On the consistent end, David Buchanan started his first game for the Phillies on May 20th, and between then and the end of the season, his worst start by Game Score came on June 3rd, when he gave up 7 runs in 6 innings, striking out 2 and walking 6, good for a Game Score of 28. But for a worst start, that’s not that awful, and his best wasn’t that great either – about two weeks later, on June 19th, he threw 7.2 innings of 1-run ball, with 1 walk and 4 strikeouts, and a Game Score of 70. The rest of his season was extremely consistent in its mediocrity, with 16 of his 20 starts having Game Scores between 40 and 60, so it’s no surprise that he takes the bottom spot on this list.

Miles Mikolas was worse, but also much more erratic, with outings like his on August 25th (8 innings, 1 walk, 5 strike outs, and no runs, Game Score of 80) and on July 7th (3.1 innings, 0 walks, 5 strike outs (looks fine so far!) and 9 runs (oh), Game Score of 5). Between those two starts, he had an RA9 of 7.15, but my guess is he gave the Rangers a much higher expected win percentage than if he had evenly distributed those runs across two 6-inning outings.

But does this mean anything when it comes to evaluation? Should a GM view one of the inconsistent starters with a little more optimism for 2015 than one of the consistent starters? In a word, no.

year to year

That is a pile of random points, and a resulting R2 value that is basically zero. The inconsistency of a pitcher in 2013 had almost nothing to do with their inconsistency in 2014, so while inconsistency is a hidden way for a pitcher’s results to be better than they look, it doesn’t appear to be a skill.

Even if this was predictable, though, this doesn’t seem to be the sort of thing that would swing the needle too far in either direction. The theoretical argument makes sense, but in practice, there are lots of mitigating factors that might make consistency more valuable. Maybe the starter the day before got bombed, and the bullpen really just needs a day off, and a 100% chance of 6 innings/4 runs is more valuable to the team that day than a 50% chance of 8 innings/1 run and 4 innings/7 runs. There’s also just a lot of randomness, probably enough to drown out the small effect. Inconsistency isn’t consistent year-to-year, and it also isn’t predictable. If a pitcher could control what games he was bad, and bank some great innings to use when he needed them, that would be a big deal. They can’t.

Managers, however, can. They can use their bad innings in games where the outcome is already practically decided, and save their best innings for the tightest of moments, with optimal bullpen use. Day-to-day inconsistency of a pitcher isn’t predictable, but pitcher-to-pitcher inconsistency of a bullpen is, and a similar argument for its value applies. A team with a lights-out closer (FIP of 2.00) and a pretty terrible long man (FIP of 5.00) is going to win more games than a team with two okay relievers (FIP of 3.50 for both), if the manager of the first team deploys his closer in close games and lets the other pitcher eat innings in blowouts. The ability to choose those spots makes the effect potentially much larger than among starters.

Balancing that, however, is the fact that relievers just have a much smaller effect on the game, so this still might not be big enough to matter. However, if it did have a noticeable effect, it would give a team an edge that wouldn’t be reflected in measures of collective performance, and so this could be one reason a team beat its BaseRuns estimated record. To see if that was perhaps the case in 2014, I developed a simple measure of bullpen-wide inconsistency. After discarding some more complicated ideas, I settled on calculating the standard deviation for each team’s eight relief pitchers that threw the most innings. This picks up most of each bullpen’s regulars and semi-regulars, and should be an okay measure of the distribution of skill in a bullpen.

Again, I wanted to first look at the most and least consistent bullpens of 2014 by this measure.

 Rank  Team  Innings  FIP  WAR  StDev
 1  KCR  464.0  3.29  5.9  1.65
 2  HOU  468.2  4.11  0.4 1.54
 3 OAK  467.1  3.47  4.0  1.35
 …
 28  MIN  521.2  3.88 2.0 0.51
 29  MIA  510.1  3.20  4.6  0.50
 30  SEA  498.1  3.24  4.5 0.50

Seeing the Royals as the most inconsistent bullpen of 2014 is not a surprise. On the one hand, Wade Davis (1.19 FIP), Kelvin Herrera (2.69) and Greg Holland (1.83) combined to throw over 200 innings of absurdly good relief. The next five most-used relievers, however, were Aaron Crow (5.40 FIP), Louis Coleman (5.69), Francisley Bueno (3.84), Michael Mariot (3.93), and Tim Collins (4.80). Those are not good pitchers, and that’s a huge gap between the two groups, but by using the top three in close games and letting the other five eat as many non-crucial innings as possible, Kansas City might have been able to win a lot more games than a bullpen with eight relievers with FIPs around 3.30 (the figure for the bullpen as a whole). The Royals are also a good example of why the advantages of inconsistency might just not show up – Ned Yost was (in-)famous for not using his bullpen optimally, and sticking to strictly defined roles with his relievers, which is the sort of thing that could nullify this effect.

The consistent bullpens are pretty boring, so I won’t spend much time on them. Seattle’s worst reliever by FIP in the eight most-used was Joe Beimel (4.18), and the best was Charlie Furbush (2.80), with the other six spread fairly evenly between them. Consistency has advantages, but not being able to turn to a true shutdown reliever when needed, or having to use a fairly valuable arm even in a blowout, might have its own costs, even compared to a bullpen with similar overall skill, such as Kansas City.

Unfortunately, either because of manager incompetence, the smallness of the effect, or something else entirely, bullpen inconsistency does very little to explain BaseRuns over- or under-performance in 2014. In the below graph, teams that beat their BaseRuns record are on the right, while those that fell below are on the left, and more inconsistent bullpens are higher versus consistent bullpens lower.

base runs and bullpen variance

That, again, is basically a random collection of points. In the top right, the Royals, both the most inconsistent bullpen and the team with the biggest positive gap between their actual winning percentage and the BaseRuns estimate (5.0%). But in the top left, Houston, the second-most inconsistent bullpen and the second-largest negative gap between their actual and BaseRuns winning percentages (-4.6%).

At best, this is inconclusive, but I find the idea really interesting. This does at least show that, on an individual pitcher basis, inconsistency is not predictable, even when looking at previous years, which I think bucks conventional wisdom in a real way. Seeing what bullpens and pitchers were particularly erratic in 2014 is fun, and it’s something I’ll be keeping an eye on in 2015.


Hardball Retrospective – The “Original” 2009 Colorado Rockies

In “Hardball Retrospective: Evaluating Scouting and Development Outcomes for the Modern-Era Franchises”, I placed every ballplayer in the modern era (from 1901-present) on their original team. Consequently, Mike Piazza is listed on the Dodgers roster for the duration of his career while the Giants claim Bobby Bonds and the Indians declare Roger Maris and Manny Ramirez. I calculated revised standings for every season based entirely on the performance of each team’s “original” players. I discuss every team’s “original” players and seasons at length along with organizational performance with respect to the Amateur Draft (or First-Year Player Draft), amateur free agent signings and other methods of player acquisition.  Season standings, WAR and Win Shares totals for the “original” teams are compared against the “actual” team results to assess each franchise’s scouting, development and general management skills.

Expanding on my research for the book, the following series of articles will reveal the finest single-season rosters for every Major League organization based on overall rankings in OWAR and OWS along with the general managers and scouting directors that constructed the teams. “Hardball Retrospective” is available in digital format on Amazon, Barnes and Noble, GooglePlay, iTunes and KoboBooks. Additional information and a discussion forum are available at TuataraSoftware.com.

Terminology

OWAR – Wins Above Replacement for players on “original” teams

OWS – Win Shares for players on “original” teams

OPW% – Pythagorean Won-Loss record for the “original” teams

Assessment

The 2009 Colorado Rockies         OWAR: 44.4     OWS: 297     OPW%: .561

GM Dan O’Dowd acquired 65% (28 of 43) of the ballplayers on the 2009 Rockies roster. 29 players were selected during the Amateur Draft though staff ace Ubaldo Jimenez was signed as an amateur free agent. Based on the revised standings the “Original” 2009 Rockies captured the National League pennant following a fierce battle with the Dodgers for the Western division title.

Chone Figgins accrued 26 Win Shares and received his lone All-Star nomination during the 2009 campaign. He established career-highs with 114 runs scored, 101 walks and a .395 OBP while swiping 42 bags from the leadoff spot. Troy Tulowitzki (.297/32/92) pilfered 20 bases and registered 101 runs on the way to a fifth-place finish in the N.L. MVP balloting. Matt “Big Daddy” Holliday compiled a .313 BA, swatted 24 long balls and knocked in 109 runs. Todd Helton eclipsed the .300 mark for the eleventh time in twelve campaigns, batting at a .325 clip while contributing 38 two-baggers. Brad Hawpe laced 42 doubles and slugged 23 circuit clouts to merit a trip to the Midsummer Classic. 

LINEUP POS WAR WS
Chone Figgins 3B 4.72 26.32
Seth Smith DH/LF 2.61 13.43
Troy Tulowitzki SS 5 25.72
Matt Holliday LF 4.7 26.18
Brad Hawpe RF 0.45 18.96
Juan Uribe 3B 3.01 16.45
Todd Helton 1B 3.41 23.24
Chris Iannetta C 2.27 9.76
Craig Counsell 2B 2.53 14.12
BENCH POS WAR WS
Everth Cabrera SS 2.44 13.48
Clint Barmes 2B 1.34 14.32
Juan Pierre LF 1.31 11.2
Ian Stewart 3B 1.13 11.98
Dexter Fowler CF 1.1 14.4
Jeff Baker 3B 1.03 7.96
Jayson Nix 2B 0.7 6.54
Cory Sullivan LF 0.16 3.14
Josh Bard C 0.1 4.61
Eric Young Jr. 2B -0.25 0.21
Jeff Salazar CF -0.32 0.13
Jody Gerut CF -0.41 4.01
Garrett Atkins 3B -0.58 5.21
Ryan Spilborghs LF -0.91 6.16

Ubaldo Jimenez whiffed 198 batsmen and accrued 15 victories along with a 3.47 ERA in his second full season in the Rockies’ starting rotation. Aaron Cook posted a record of 11-6 with a 4.16 ERA following his All-Star season in ’08. Justin Miller (3-3, 3.18) led an otherwise undistinguished bullpen staff.

ROTATION POS WAR WS
Ubaldo Jimenez SP 6.05 19.07
Aaron Cook SP 2.88 11.26
Esmil Rogers SP 0.06 0.21
Jhoulys Chacin SW 0.08 0.39
Franklin Morales RP 0.31 4.19
BULLPEN POS WAR WS
Justin Miller RP 0.66 4.47
Matt Daley RP 0.55 3.97
Mark DiFelice RP 0.43 3.66
Alberto Arias RP 0.21 3.27
Jason Jennings RP 0.2 3.92
Ryan Speier RP 0.02 0.26
Steven Register RP 0.01 0.08
Sean Green RP -0.14 2.73
Pedro Strop RP -0.2 0
Manny Corpas RP -0.25 0.88
Juan Morillo RP -0.36 0
Jorge Sosa RP -0.38 0.09
Jamey Wright RP -0.53 3.69
Luis Ayala RP -0.59 1.47
David Patton RP -0.68 0.02

 The “Original” 2009 Colorado Rockies roster

NAME POS WAR WS General Manager Scouting Director
Ubaldo Jimenez SP 6.05 19.07 Dan O’Dowd Bill Schmidt
Troy Tulowitzki SS 5 25.72 Dan O’Dowd Bill Schmidt
Chone Figgins 3B 4.72 26.32 Bob Gebhard Pat Daugherty
Matt Holliday LF 4.7 26.18 Bob Gebhard Pat Daugherty
Todd Helton 1B 3.41 23.24 Bob Gebhard Pat Daugherty
Juan Uribe 3B 3.01 16.45 Bob Gebhard Pat Daugherty
Aaron Cook SP 2.88 11.26 Bob Gebhard Pat Daugherty
Seth Smith LF 2.61 13.43 Dan O’Dowd Bill Schmidt
Craig Counsell 2B 2.53 14.12 Bob Gebhard Pat Daugherty
Everth Cabrera SS 2.44 13.48 Dan O’Dowd Bill Schmidt
Chris Iannetta C 2.27 9.76 Dan O’Dowd Bill Schmidt
Clint Barmes 2B 1.34 14.32 Dan O’Dowd Bill Schmidt
Juan Pierre LF 1.31 11.2 Bob Gebhard Pat Daugherty
Ian Stewart 3B 1.13 11.98 Dan O’Dowd Bill Schmidt
Dexter Fowler CF 1.1 14.4 Dan O’Dowd Bill Schmidt
Jeff Baker 3B 1.03 7.96 Dan O’Dowd Bill Schmidt
Jayson Nix 2B 0.7 6.54 Dan O’Dowd Bill Schmidt
Justin Miller RP 0.66 4.47 Bob Gebhard Pat Daugherty
Matt Daley RP 0.55 3.97 Dan O’Dowd Bill Schmidt
Brad Hawpe RF 0.45 18.96 Dan O’Dowd Bill Schmidt
Mark DiFelice RP 0.43 3.66 Bob Gebhard Pat Daugherty
Franklin Morales RP 0.31 4.19 Dan O’Dowd Bill Schmidt
Alberto Arias RP 0.21 3.27 Dan O’Dowd Bill Schmidt
Jason Jennings RP 0.2 3.92 Bob Gebhard Pat Daugherty
Cory Sullivan LF 0.16 3.14 Dan O’Dowd Bill Schmidt
Josh Bard C 0.1 4.61 Bob Gebhard Pat Daugherty
Jhoulys Chacin SW 0.08 0.39 Dan O’Dowd Bill Schmidt
Esmil Rogers SP 0.06 0.21 Dan O’Dowd Bill Schmidt
Ryan Speier RP 0.02 0.26 Dan O’Dowd Bill Schmidt
Steven Register RP 0.01 0.08 Dan O’Dowd Bill Schmidt
Sean Green RP -0.14 2.73 Dan O’Dowd Bill Schmidt
Pedro Strop RP -0.2 0 Dan O’Dowd Bill Schmidt
Manny Corpas RP -0.25 0.88 Bob Gebhard Pat Daugherty
Eric Young 2B -0.25 0.21 Dan O’Dowd Bill Schmidt
Jeff Salazar CF -0.32 0.13 Dan O’Dowd Bill Schmidt
Juan Morillo RP -0.36 0 Dan O’Dowd Bill Schmidt
Jorge Sosa RP -0.38 0.09 Bob Gebhard Pat Daugherty
Jody Gerut CF -0.41 4.01 Bob Gebhard Pat Daugherty
Jamey Wright RP -0.53 3.69 Bob Gebhard Pat Daugherty
Garrett Atkins 3B -0.58 5.21 Dan O’Dowd Bill Schmidt
Luis Ayala RP -0.59 1.47 Dan O’Dowd Pat Daugherty
David Patton RP -0.68 0.02 Dan O’Dowd Bill Schmidt
Ryan Spilborghs LF -0.91 6.16 Dan O’Dowd Bill Schmidt

Honorable Mention 

The “Original” 2007 Rockies              OWAR: 42.0     OWS: 264     OPW%: .546

Matt Holliday (.340/36/137) topped the Senior Circuit in batting average, RBI, hits (216) and doubles (50), earning a runner-up finish in the 2007 NL MVP vote. Troy Tulowitzki (.291/24/99) accrued 104 tallies and placed second in the Rookie of the Year balloting. Todd Helton ripped 42 doubles and third-sacker Chone Figgins manufactured a career-best .330 BA. Garrett Atkins (.301/25/111) and Brad Hawpe (.291/29/116) contributed to Colorado’s offensive onslaught. Jeff Francis paced the starting staff with a 17-9 record while Manny Corpas posted an ERA of 2.08 and saved 19 contests.

On Deck

The “Original” 1992 Brewers

References and Resources

Baseball America – Executive Database

Baseball-Reference

James, Bill, with Jim Henzler. Win Shares. Morton Grove, Ill.: STATS, 2002. Print.

Retrosheet – Transactions Database

Seamheads – Baseball Gauge

Sean Lahman Baseball Archive


Crowdsourcing Bullpen Roles

With less than a month before Opening Day and fantasy baseball prep ramping up, I thought I’d take a look at bullpen roles for each major-league team. Most leagues still use saves as a category and it’s important to know who’s slated for the closer role, as well as the #2 and #3 guy in each pen if you’re in a large league or a league where every team is scrambling for the guy next-in-line to get those precious saves.

I used eight sources to determine how the fantasy experts are projecting each team’s bullpen. The sources are: FanGraphs Bullpen Report, CBS sports, Rotoworld, MLB.com, ESPN.com, Roster Resources, Fantasy Alarm, and Fox. For each team, I’ve listed their closer, setup guy #1, and setup guy #2, with the number of lists they are on out of the eight sources. I’ve also listed the projected saves for each pitcher based on the FanGraphs Depth Charts.

Locked In Their Roles


Kansas City Royals

Closer: Greg Holland (all 8 sources)

Setup #1: Wade Davis (all 8 sources)

Setup #2: Kelvin Herrera (all 8 sources)


Comment: There’s no question how the Royals’ bullpen is set up, which is not surprising considering how successful they were last season when they rode a tremendous bullpen all the way to the seventh game of the World Series.


FanGraphs Depth Charts: Holland—37, Davis—1, Herrera—1


Philadelphia Phillies

Closer: Jonathan Papelbon (all 8 sources)

Setup #1: Ken Giles (all 8 sources)

Setup #2: Jake Diekman (all 8 sources)


Comment: All eight sources have the Phillies’ pen lineup up as Papelbon, Giles, and Diekman. The one thing to watch for here is if the Phillies can find a taker for Papelbon’s contract. He’s owed $13 million this year and has a vesting option for another $13 million in 2016 if he finishes 55 games this year or 100 games over 2014-2015. If he goes, Giles is the guy to have.


FanGraphs Depth Charts: Papelbon—36, Giles—2, Diekman—2


Atlanta Braves

Closer: Craig Kimbrel (all 8 sources)

Setup #1: Jason Grilli (all 8 sources)

Setup #2: Jim Johnson (7), James Russell (1)


Comment: The Braves are opening a new ballpark in 2017 and Kimbrel is owed $9 million this year, $11 million next year and $13 million in 2017, with a $13 million club option for 2018. Does a team that doesn’t look ready to compete in the next two years really want to spend $20 million on a closer during that time? If Kimbrel gets traded, Grilli is next in line.


FanGraphs Depth Charts: Kimbrel—39, Grilli—2


Two Spots Set, What About That Third?


St. Louis Cardinals

Closer: Trevor Rosenthal (8)

Setup #1: Jordan Walden (8)

Setup #2: Seth Maness (5), Matt Belisle (3)


Comment: Rosenthal and Walden look to have the late-game roles locked in, but the #2 setup guy isn’t as certain. Maness is a ground-ball machine (career 61.5% GB%) with a low strikeout rate (15.9%) but a career 2.66 ERA. He picked up 3 saves last year. Belisle had a 4.87 ERA last year with the Rockies, but is projected to be much better this year (3.52 ERA—FanGraphs Depth Charts).


FanGraphs Depth Charts: Rosenthal—42


Cleveland Indians

Closer: Cody Allen (8)

Setup #1: Bryan Shaw (8)

Setup #2: Scott Atchison (5), Marc Rzepczynski (3)


Comment: It’s Allen and Shaw, with Atchison the most likely second setup guy. Rzepczynski shouldn’t be allowed to face a right-handed hitter with the game on the line. In his career, righties have hit .272/.366/.441 against him.


FanGraphs Depth Charts: Allen—38, Shaw—2, Atchison—2


New York Yankees

Closer: Dellin Betances (8)

Setup #1: Andrew Miller (8)

Setup #2: Adam Warren (5), David Carpenter (3)


Comment: Betances (3.2 WAR) and Miller (2.3 WAR) were two of the top six relievers by FanGraphs WAR last year. The consensus seems to be that Betances will be the closer with Miller the primary setup guy, but the FanGraphs Depth Charts show Betances with 30 saves to Miller’s 11, so he’s not being projected as the slam-dunk closer just yet. Both Warren and Carpenter are solid setup guys.


FanGraphs Depth Charts: Betances—30, Miller—11, Warren—2


Los Angeles Angels of Anaheim

Closer: Huston Street (8)

Setup #1: Joe Smith (8)

Setup #2: Fernando Salas (4), Mike Morin (2) Cesar Ramos (1), Vinnie Pestano (1)


Comment: If/when Huston Street misses a couple weeks with an injury in the middle of the season, Joe Smith will be the guy. After Smith, Fernando Salas has the most experience picking up saves, as he had 24 saves with the Cardinals back in 2011.


FanGraphs Depth Charts: Street—37, Smith—4


San Diego Padres

Closer: Joaquin Benoit (8)

Setup #1: Kevin Quackenbush (7), Dale Thayer (1)

Setup #2: Dale Thayer (5), Shawn Kelley (1), Alex Torres (1), Nick Vincent (1)


Comment: Benoit and Quackenbush both picked up saves after Huston Street was traded last year, but Benoit is clearly the closer going into this season. Thayer had 7 saves for the Padres in 2012. The FanGraphs Depth Charts have Brandon Maurer getting 4 saves and Shawn Kelley with 2, but Quackenbush with zero, which doesn’t seem quite right to me.


FanGraphs Depth Charts: Benoit—37, Maurer—4, Kelley—2


Pittsburgh Pirates

Closer: Mark Melancon (8)

Setup #1: Tony Watson (6), Jared Hughes (1), John Holdzkom (1)

Setup #2: Jared Hughes (3), Tony Watson (2), Antonio Bastardo (2), John Holdzkom (1)


Comment: Watson is considered the top setup guy for Melancon, with Hughes and Holdzkom falling in place behind him. Holdzkom has the sky-high strikeout rate, while Hughes is a ground ball machine (64.6% GB%).


FanGraphs Depth Charts: Melancon—40, Bastardo—2


Seattle Mariners

Closer: Fernando Rodney (8)

Setup #1: Danny Farquhar (6), Yoervis Medina (2)

Setup #2: Yoervis Medina (4), Danny Farquhar (2), Charlie Furbush (1), Tom Wilhelmsen (1)


Comment: After Rodney, it’s either Farquhar or Medina, with Farquhar the more popular choice among the eight sources used here and also the better pitcher statistically. After Rodney, Wilhelmsen has the most experience at closer.


FanGraphs Depth Charts: Rodney—40, Wilhelmsen—4


Detroit Tigers

Closer: Joe Nathan (8)

Setup #1: Joakim Soria (6), Al Alburquerque (1), Ian Krol (1)

Setup #2: Joakim Soria (2), Al Alburquerque (2), Joba Chamberlain (2), Bruce Rondon (2)


Comment: Joe Nathan started to show his age in 2014. His strikeout rate dropped; his walk rate rose, and he had the third-worst ERA of his 16-year career (4.81). His FIP (3.94) and xFIP (4.14) weren’t as bad as his ERA, but they weren’t great either. He’ll be 40 this year. In the long history of baseball, relievers 40 and older have a total of 13 seasons with 20 or more saves and eight seasons with 30 or more. The odds are against Joe Nathan. Joakim Soria is ready to take over should Nathan falter. Al Alburquerque looks to be the #3 guy in this pen. The FanGraphs Depth Charts expect Soria to get plenty of save opportunities this year.


FanGraphs Depth Charts: Nathan—24, Soria—14, Alburquerque—1, Chamberlain—1


Texas Rangers

Closer: Neftali Feliz (8)

Setup #1: Tanner Scheppers (7), Shawn Tolleson (1)

Setup #2: Kyuji Fujikawa (3), Shawn Tolleson (2), Tenner Scheppers (1), Alex Claudio (1), Mendez (1)


Comment: Feliz is the #1 guy going into the season, but his peripheral statistics were ugly last year. He had a 1.99 ERA, with a 4.90 FIP and 4.60 xFIP, thanks to a below-average 6.0 K/9, mediocre 3.1 BB/9, and ugly 1.4 HR/9. He had a BABIP of .176 and LOB% of 100%, neither of which are likely to be repeated. Scheppers was injured for much of the year, as was Fujikawa, but either pitcher could get some save chances if Feliz falters.


FanGraphs Depth Charts: Feliz—33, Tolleson—4


Arizona Diamondbacks

Closer: Addison Reed (8)

Setup #1: Brad Ziegler (7), Evan Marshall (1)

Setup #2: Oliver Perez (5), Evan Marshall (2), Brad Ziegler (1)


Comment: Reed is currently having shoulder problems, but the Diamondbacks’ team site reported that the team is optimistic he’ll be ready for Opening Day. Ziegler is most often named as the top setup guy, with Oliver Perez and Evan Marshall among the possibilities for late inning work. The FanGraphs Depth Charts are all over the place with this bullpen, with nine pitchers projected for at least one save.


FanGraphs Depth Charts: Reed—7, Ziegler—7, Marshall—7, Perez—6, Delgado—5, D. Hudson—4, M. Reynolds—2, Ch. Anderson—1, M. Stites—1, R. Ray—1


Who’s the 8th Inning Guy?


Boston Red Sox

Closer: Koji Uehara (8)

Setup #1: Junichi Tazawa (5), Edward Mujica (3)

Setup #2: Edward Mujica (4), Junichi Tazawa (3), Craig Breslow (1)


Comment: Since becoming a reliever in 2010, Uehara has been terrific. Still, he’ll be 40 years old this year and there’s not much history of 40-year-old relievers racking up high save totals. Tazawa is the favored option after Uehara by the eight sources used here, but Mujica is the guy with a history of getting saves (37 in 2013, 8 in 2014).


FanGraphs Depth Charts: Uehara—36, Tazawa—2, Mujica—2


Oakland Athletics

Closer: Tyler Clippard (8)—injury replacement for Sean Doolittle (DL)

Setup #1: Ryan Cook (5), Eric O’Flaherty (3)

Setup #2: Ryan Cook (3), Eric O’Flaherty (2), Fernando Abad (2), Evan Scribner (1)


Comment: While Doolittle is out the Oakland pen should go Clippard-Cook-O’Flaherty, although three sources have O’Flaherty ahead of Cook. Once Doolittle returns, everyone else gets bumped back a spot.


FanGraphs Depth Charts: Doolittle—28, Clippard—12


Chicago Cubs

Closer: Hector Rondon (8)

Setup #1: Pedro Strop (5), Neil Ramirez (2), Jason Motte (1)

Setup #2: Neil Ramirez (4), Pedro Strop (3), Zac Rosscup (1)


Comment: CBS is the only source that has Motte listed as the first setup guy so, despite his experience as a closer in 2012, it’s much more likely that Strop and Ramirez will be the primary setup guys to Hector Rondon.


FanGraphs Depth Charts: Rondon—40, Strop—3


Washington Nationals

Closer: Drew Storen (8)

Setup #1: Casey Janssen (4), Aaron Barrett (2), Craig Stammen (1), Matt Thornton (1)

Setup #2: Craig Stammen (3), Matt Thornton (2), Aaron Barrett (1), Blevins (1), Tanner Roark (1)


Comment: Janssen has earned 81 saves over the last three years and he’s the favorite to be the primary setup guy here, but his strikeout numbers last season were ugly (5.5 K/9). Barrett looks most likely to jump ahead of Janssen in this pen.


FanGraphs Depth Charts: Storen—43, Janssen—4


Chicago White Sox

Closer: David Robertson (8)

Setup #1: Zach Putnam (4), Jake Petricka (3), Zach Duke (1)

Setup #2: Jake Petricka (4), Zach Duke (3), Nate Jones (1)


Comment: There’s a difference of opinion on who will be the primary setup guy to Robertson in the White Sox’ bullpen. Putnam had 6 saves last year and a 1.98 ERA but a 3.08 FIP and 3.64 xFIP. Petricka had 14 saves last year and a 2.96 ERA but 3.60 FIP and 3.76 xFIP. Duke is projected to get more saves than both Putnam and Petricka by the FanGraphs Depth Charts. They also have Robertson with just 25 projected saves, which seems much too low.

FanGraphs Depth Charts: Robertson—25, Duke—8, Putnam—6


Cincinnati Reds

Closer: Aroldis Chapman (8)

Setup #1: Jumbo Diaz (4), Sam LeCure (3), Sean Marshall (1)

Setup #2: Sam LeCure (4), Burke Badenhop (2), Jumbo Diaz (1), Oscar Villarreal (1)


Comment: The primary setup job is still a question mark here, based on the eight sources. Jumbo Diaz is listed as setup guy #1 by four sources, but LeCure is listed more often as either the primary setup guy or the #2 guy.


FanGraphs Depth Charts: Chapman—39, LeCure—3


Baltimore Orioles

Closer: Zach Britton (8)

Setup #1: Tommy Hunter (4), Darren O’Day (4)

Setup #2: Tommy Hunter (3), Brian Matusz (3), Darren O’Day (2)


Comment: Hunter and O’Day are listed as the primary setup guy by four sources each. Hunter has more experience picking up saves (15 over the last two years), but O’day is the better pitcher.


FanGraphs Depth Charts: Britton—36, O’Day—3, Hunter—1


Miami Marlins

Closer: Steve Cishek (8)

Setup #1: A.J. Ramos (3), Mike Dunn (3), Bryan Morris (2)

Setup #2: A.J. Ramos (5), Mike Dunn (3)


Comment: There isn’t a strong consensus on the setup guy in this pen, but it’s most likely Ramos, then Dunn. Ramos, the right-hander, is most likely to step in if something happens to Cishek.


FanGraphs Depth Charts: Cishek—39, Ramos—1, Dunn—1


Minnesota Twins

Closer: Glen Perkins (8)

Setup #1: Casey Fien (3), Brian Duensing (3), Michael Tonkin (1), Caleb Thielbar (1)

Setup #2: Casey Fien (2), Brian Duensing (2), Ryan Pressly (2), Michael Tonkin (1), Stauffer (1)


Comment: Fien saw his dropout rate drop from 10.6 K/9 in 2013 to 7.3 K/9 in 2014, but he’s the top right-handed setup guy, so he would most likely be the guy to get saves if Perkins is unable to do so for some reason. Duensing is listed as the primary setup guy by three sources. His career 6.1 K/9 and 4.12 ERA suggests he’s not a guy you want to have on your fantasy roster.


FanGraphs Depth Charts: Perkins—34, Fien—1, Thielbar—1


Colorado Rockies

Closer: LaTroy Hawkins (8)

Setup #1: Rex Brothers (4), Adam Ottavino (3), Boone Logan (1)

Setup #2: Rex Brothers (3), Adam Ottavino (2), Boone Logan (2), Tommy Kahnle (1)


Comment: All eight sources have the 42-year-old LaTroy Hawkins listed as the Colorado closer. In the history of baseball, 42-year-old relievers have had more than 15 saves in a season just three times—1965 Hoyt Wilhelm (20), 1997 Dennis Eckersley (36), and 2013 Mariano Rivera (44). Still, Hawkins has been able to keep runs off the board over the last three seasons despite a low strikeout rate. Rex Brothers is listed most often as next in line, with Adam Ottavino also in the mix. The FanGraphs Depth Charts have eight pitchers projected for at least one save.


FanGraphs Depth Charts: Hawkins—6, Brothers—6, Ottavino—5, Axford—5, D. Hale—5, B. Logan—3, Bettis—2, J. Diaz—1


San Francisco Giants

Closer: Santiago Casilla (8)

Setup #1: Sergio Romo (4), Jeremy Affeldt (4)

Setup #2: Sergio Romo (4), Jeremy Affeldt (4)


Comment: The sources agree that the top three guys in the Giants’ pen will be Casilla, Romo, and Affeldt. They are not in agreement on whether it’s Romo or Affeldt as the primary setup guy. Romo has the closer experience, though, so he should be your handcuff with Casilla in leagues where backup closers are rostered.


FanGraphs Depth Charts: Casilla—14, Romo—11, Affeldt—9, J. Lopez—7, Petit—5


Milwaukee Brewers

Closer: Francisco Rodriguez (5), Jon Broxton (2), Rob Wooten (1)

Setup #1: Jon Broxton (6), Jim Henderson (1), Will Smith (1)

Setup #2: Will Smith (6), Tyler Thornburg (1), Brandon Kintzler (1)


Comment: This isn’t as uncertain as it looks. K-Rod is the closer. The Brewers wouldn’t have signed him if he weren’t going to close. He’s still in the process of obtaining his work visa and the hope is that he gets to camp by the end of the week. For now, MLB.com has Rob Wooten listed as the closer, and ESPN.com and Fantasy Alarm both have Broxton listed as the closer. The reality is that the late inning pitchers for the Brewer will be K-Rod, Broxton, and Will Smith.


FanGraphs Depth Charts: Broxton—4


Toronto Blue Jays

Closer: Brett Cecil (6), Aaron Sanchez (1), Steve Delabar (1)

Setup #1: Aaron Loup (5), Aaron Sanchez (2), Brett Cecil (1)

Setup #2: Steve Delabar (4), Aaron Loup (2), Aaron Sanchez (1), Brett Cecil (1), Steve Delabar (1)


Comment: Cecil has been a very good reliever over the last two years and is expected by the majority of these eight sources to be the main man for saves in 2015. Aaron Sanchez is a terrific young pitcher who may get bumped to the bullpen if there’s no room for him in the rotation. Loup is a setup guy with a mediocre strikeout rate. Delabar was great in 2012 and 2013 but really bad last year. Fox has him listed as the Blue Jays’ closer at the moment, but I would say that’s not bloody likely.


FanGraphs Depth Charts: Cecil—37, Loup—4


Messy Closer Situations


Los Angeles Dodgers

Closer: Joel Peralta (6), Brandon League (2)—filling in for Kenley Jansen (DL)

Setup #1: Brandon League (3), Joel Peralta (2), Pedro Baez (2), J.P. Howell (1)

Setup #2: Pedro Baez (3), J.P. Howell (3), Brandon League (1), Paco Rodriguez (1)


Comment: With Jansen currently out with a foot injury, six of eight sources like Joel Peralta to close for the Dodgers, with Brandon League the choice by the other two. When Jansen comes back, Peralta and League should be the top setup guys. The FanGraphs Depth Charts have saves scattered among six guys with J.P. Howell projected for the most.


FanGraphs Depth Charts: J.P. Howell—8, Jansen—7, Peralta—7, League—6, Baez—3, Paco Rodriguez—2


New York Mets

Closer: Jenrry Mejia (6), Jenrry Mejia/Bobby Parnell (2)

Setup #1: Jeurys Familia (6), Bobby Parnell (2)

Setup #2: Jeurys Familia (2), Vic Black (2), Carlos Torres (2), Josh Edgin (1), Rafael Montero (1)


Comment: Mejia is listed by himself as the closer by six sources and he shares the job with Parnell on the lists of two other sources. Mejia had 28 saves last year. Parnell had 22 the year before and is coming back from an injury hoping to reclaim his job. Right now, the FanGraphs Depth Charts have Mejia projected for 21 saves and Parnell projected for 19, so it’s a difficult situation to judge at the moment. Familia would be the guy who is third in line.


FanGraphs Depth Charts: Mejia—21, Parnell—19, Familia—2


Houston Astros

Closer: Luke Gregerson (5), Chad Qualls (3)

Setup #1: Luke Gregerson (3), Pat Neshek (3), Chad Qualls (2)

Setup #2: Pat Neshek (5), Chad Qualls (2), Josh Fields (1)


Comment: Five of eight sources have Gregerson listed as the Astros’ closer, with the other three putting Qualls in that spot. Qualls was the team’s closer last year and he had 19 saves with a 3.33 ERA. You would think the spot would be his to lose, but Gregerson has been the better pitcher over the years so it’s not hard to understand why most people would expect Gregerson to become the closer. Neshek is most likely third in line and Fields is a longshot.


FanGraphs Depth Charts: Gregerson—26, Qualls—6, Neshek—6


Tampa Bay Rays

Closer: Brad Boxberger (4), Grant Balfour (2), Kevin Jepsen (2)—filling in for Jake McGee (DL)

Setup #1: Brad Boxberger (4), Grant Balfour (3), Kevin Jepsen (1)

Setup #2: Grant Balfour (2), Ernesto Frieri (2), Kevin Jepsen (2), Jeff Beliveau, Kirby Yates (1)


Comment: McGee is likely to miss most or all of April. It’s hard to know who will get saves in the meantime. The majority likes Boxberger, but Balfour and Jepsen both have their backers. Balfour had 12 saves last year and 38 the year before, so he has experience as a closer. Boxberger was very effective last year, striking out 14.5 batters per nine innings, but the Rays may want to keep him in a setup role.


FanGraphs Depth Charts: McGee—38, Boxberger—3, Balfour—1,


A Short History of Starters Who Fail to Record an Out

Failing to record an out is a starting pitcher’s worst nightmare. Generally, it means that either the pitcher suffered an injury or had absolutely nothing that particular day. In the case that the pitcher is healthy but eminently hittable, one can only imagine the embarrassment the pitcher feels. Additionally, it’s a pretty big letdown to the pitcher’s teammates. Players underperform from time to time, but perhaps nothing hurts a team as much as a starter who gets rocked and subsequently pulled before retiring a batter. In a matter of minutes, the pitcher’s squad can already be a few runs behind, and the bullpen becomes destined for a long day.

From data available at Baseball-Reference (since 1914), in the regular season, there have been 1,282 instances of starting pitchers leaving the game before recording one out (thanks, Play Index). The first time this occurred, on record, was April 24, 1914. The Cubs’ Charlie Smith faced five batters; he beaned one, allowed three hits, and one counterpart reached on error. The last time it happened was August 7, 2013, when Shelby Miller was yanked after taking a line drive to the elbow off the bat of Dodger’s outfielder Carl Crawford. Read the rest of this entry »