Archive for December, 2014

The Resurgence of Jon Lester: How a Small Mechanical Change Brought Back a Pitch that Earned Millions

Jon Lester just got paid. Early Wednesday morning, it was announced that Jon Lester accepted a 6-year $155M contract with a vesting option for a 7th year to become a member of the Chicago Cubs. This is over $20M more than the FanGraphs readers predicted in the offseason free agent crowdsourcing. This is the same pitcher that the Red Sox offered a 4-year $70M extension to prior to the season and proceed to nearly double their offer to $135M in the off-season. Before 2014, it was reasonable to think Jon Lester might be looking at a deal similar to the 5 years $90-95M that has been predicted for James Shields. What did Lester do to convince teams he is closer to a $200M pitcher than a $100M pitcher? He looked like the elite Lester we saw in 2009-2010, and not the merely very good pitcher he was in the past few years. How did he improve in his contract year? Let’s take a look.

Jon Lester fWAR/Season fWAR rank FIP FIP rank K% K% rank Contact % Contact% Rank
2009-2010 5.8 9th 3.14 10th 26.4% 2nd 76.1% 7th
2011-2013 3.6 16th 3.84 60th 20.4% 48th 80.9% 68th
2014 6.1 6th 2.80 9th 24.9% 12th 78.6% 29th


Lester was one of the top pitchers in the game during the 2009 and 2010 seasons, and even placed 4th in AL Cy Young voting in 2010. His peers were Felix Hernandez and Adam Wainwright, along with Lincecum and Sabathia (before they became husks of their former selves on the mound). While WAR still treated Lester well in 2011-2013, partially due to the sheer number of IP and park and league statistical adjustments, his FIP placed him in the leagues of Kyle Lohse, Homer Bailey, Yovani Gallardo and Ian Kennedy. During that period, Lester’s opponent contact rate and swinging-strike rate were the same as those of Clay Buchholz. So comparing a theoretical Lester deal to the Bailey extension, which was looked at as an overpay by some, didn’t seem unfair. From 2011-2013, Lester trailed Shields by over 2 WAR, so a similar contract didn’t seem unfair prior to 2014.

What caused Lester to fall from the ranks of the elite and become more of a number-two starter? The strikeouts disappeared.

800x387xlester-l-r.png.pagespeed.ic.p9Ej

800x394xlester-k9.png.pagespeed.ic.-Zrox
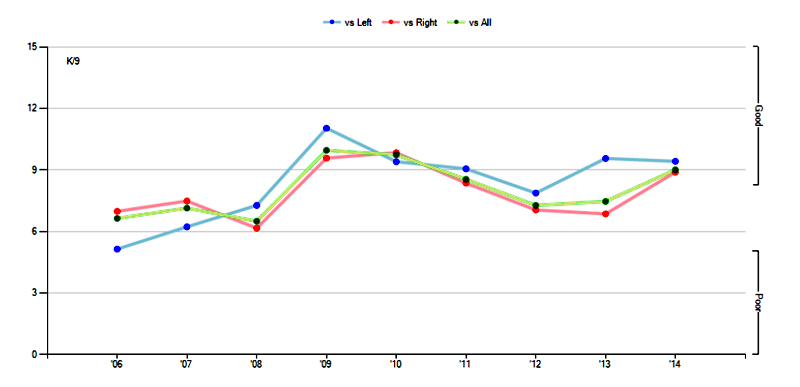
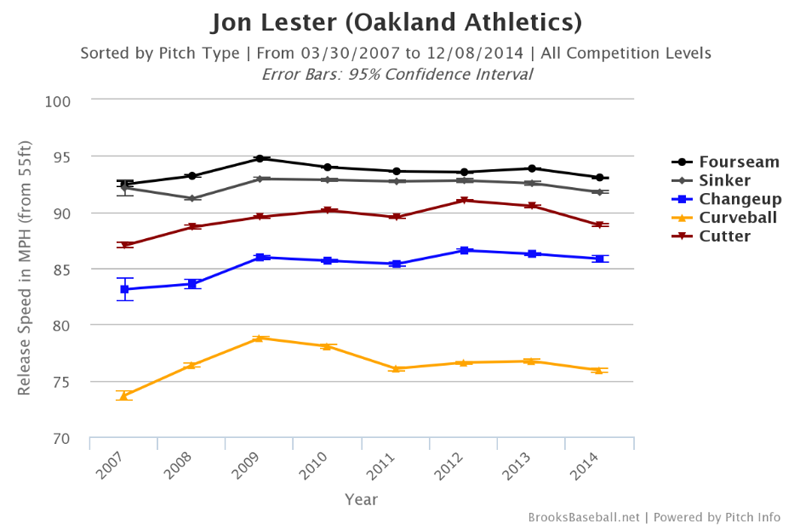
The problem was especially apparent against righties, whom he struck out at only a 17.9% clip in 2013 (compared to 26.3% in 2010). What caused this decline? Let’s take a quick look at the Pitch F/X data. A lot of people are under impression that the decline was due to velocity loss that occurs with aging. This isn’t really the case for Lester. Lester’s fastball velocity has declined by less than one mile per hour, from 94 MPH in 2010 to 93.2 MPH in 2014. While the cutter and curveball have lost velocity, they aren’t as dependent on velocity as the fastball:

800x529xlester-pitch-type.png.pagespeed.
If we take a look at his pitch usage, we notice two things: He has for the most part ditched the sinker and changeup in favor of the fastball, cutter, curveball combination that our Matt Trueblood detailed in his recent piece.

Let’s take a look for the most telling data for any pitcher: the ability to get hitters to swing and miss.

800x541xlester-whiff.png.pagespeed.ic.Br

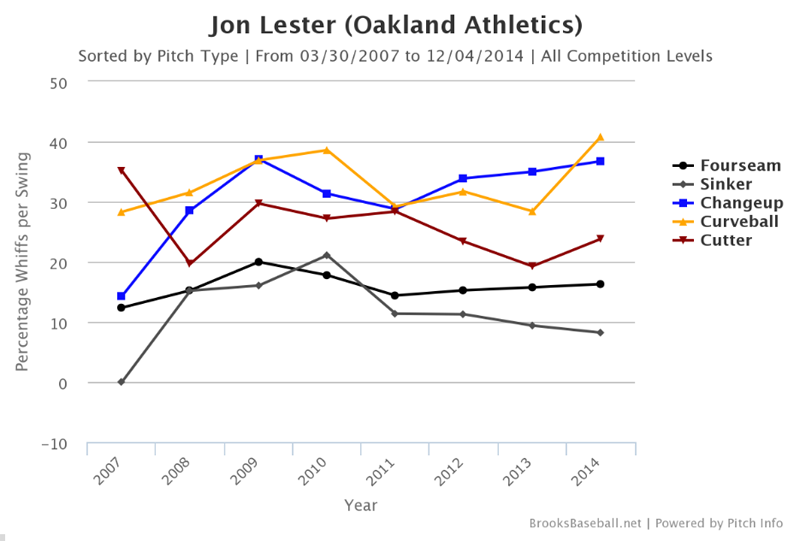
Lester’s fastball generated whiffs on 16.3 percent of all swings in 2014, his best mark since 17.8 percent in 2010. That is around the league average of 16.4 percent, according to Eno Sarris’s benchmarks. The cutter, which he is throwing at a career-high frequency of 31.0% of all his pitches, is generating a whiff-per-swing rate of 23.8 percent (5th in MLB, minimum 500 pitches thrown), above the league average of 21.4%. The pitch isn’t as good as it used to be, when it generated whiffs on over 28 percent of swings, for reasons Sarris detailed last year. However, it’s still a very good pitch that was even better in 2014 due to improvements in the horizontal movement.

The curveball, though, is what’s special. In 2014, Lester’s curveball generated whiffs-per-swing on 40.8 percent of opponents’ swings, the highest mark of his career—and 12 percentage points more than in 2013, when his curveball was league-average in that regard. In 2014, It was the best curveball in the league in terms of whiffs per swing, with pitchers like A.J. Burnett, Adam Wainwright and Sonny Gray behind him.

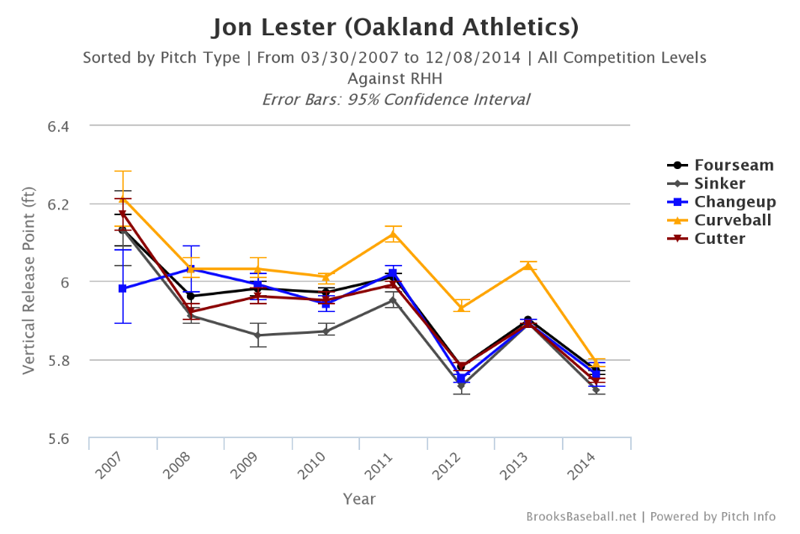
Now what happened to the curveball? It didn’t gain velocity. It didn’t gain movement. It gained a more consistent vertical release point. Look at 2014. Lester changed his release point on all pitches, but as you can see, the release points of the fastball, cutter, and curveball are tightly grouped together. Now look at 2009 and 2010, and compare it to 2011-2013. It appears that in his “peak years,” Lester maintained a better-disguised release point on the curve than he did in 2011-2013.

If the curveball was being tipped or was less deceptive, righties would have the best look at it.  Let’s check that out:

800x534xlester-release.png.pagespeed.ic.

nAa3HGr.png


NqtDfGc.png

There is something incredibly satisfying in finding the results we might expect. The curveball generated 41.4% Whiffs/Swing vs. righties compared to the 25.8% in 2013. Lester’s Curveball caused 25 Ks against righties, 6th in baseball compared to 2014 when it only caused 6. This is exceptional because he only generated 55 whiffs on the CB vs. RHH. When righties do make contact, they aren’t hitting it hard, only slugging .151 against the hook last year, compared to .338 in 2013. Righties aren’t picking up the curveball like they were before, and in 2014, that solved the platoon issues he had against them in previous years. Trueblood said, “Lester might have tapped into something that will allow him to dominate right-handed batters in the future.” That something is the curveball. It allowed him to ditch his changeup with little consequence.

The gist is that 2014 Jon Lester was more like 2009-2010 Jon Lester than 2011-2013 Jon Lester. A mechanical adjustment allowed the curveball to reemerge as an elite weapon in Lester’s arsenal, complementing a very good cutter and an above average fastball. It also allowed him to enjoy success versus righties again. The question is: How sustainable is this change? If Lester can lose his mechanics for years, is there serious risk of him losing them again? Can he continue to improve? If he can bring the curveball back to its former glory, can he regain a bit more movement on the cutter again? Can he bring back an effective sinker, giving him a deeper arsenal? These are the questions on which the Cubs will be betting $155 million on. If these changes can be sustained, it wouldn’t be surprising if Lester is worth the contract barring injury. Just one 5 WAR season can be worth $40M on this market. Lester made a slight change to his mechanics and it just might have earned him tens of millions of dollars.


Giants Shouldn’t Overspend on Headley

When the Red Sox locked up Pablo Sandoval a few weeks ago, Giants fans immediately began to wonder who San Francisco would turn to at third base. After all, Sandoval had just wrapped up his seventh season with the Giants, and the Panda had become a fan favorite for his postseason success. With a free agent market saturated with several bench pieces and only one legitimate option in Chase Headley, the Giants began to focus on Headley as a potential replacement. With Headley seeking a four-year deal, worth close to $50 million, the Giants have to ask themselves, is this the best option?

No.

While Sandoval will always be a beloved figure in the Bay Area, let’s not overestimate his value with the club. From 2009-2011, the Panda was worth 12 wins. His WAR over the next three years? 7.9.

Sandoval from 2009-2011:

.857 OPS, .198 ISO, 129 wRC+

Sandoval from 2012-2014:

.759 OPS, .144 ISO, 115 wRC+

Whether or not the Red Sox overpaid on Sandoval is a discussion for another day, so let’s focus on the Giants’ potential options here. If Opening Day was tomorrow, Bruce Bochy would have to decide between Marco Scutaro and Joaquin Arias as his starter at third base. Scutaro, entering his age 39 season, is coming off a major back injury that limited him to just 5 games in 2014. On top of that, Scutaro has made just 15 starts at third base since 2008, and all 15 of those came in 2012. Arias adds some intriguing value in more of a platoon role, but we’ll get to that later. Now let’s take a look at the Giants’ top option on the free agent market, Chase Headley.

Defensively, Headley is widely regarded as one of the top performers in all of baseball. For his career, Headley boasts a 10.8 UZR/150, along with a 2014 season that included 13 DRS, second only to Josh Donaldson’s 20 DRS among AL third basemen. Everyone knows of Headley’s breakout season in 2012: .874 OPS, 31 HR, 145 wRC+, 7.2 (!!!) WAR, and everyone is just as quick to point out the downfall in the next two seasons. But Headley hasn’t been that bad.

Headley in 2013 and 2014:

.725 OPS, 26 HR, 109 wRC+, 8.0 WAR

As we have always known with Headley, his defense increases his value. In 2012, it was merely an afterthought to a career season at the plate. Headley would add solid production the Giants’ lineup, but could they get similar production at a cheaper cost? One step towards that would involve a trade with a team that will break in a top prospect at third base at some point in 2015. Enter the Chicago Cubs and Luis Valbuena.

Valbuena, who will soon be replaced by top prospect Kris Bryant, is projected to make somewhere in the neighborhood of $3 million in 2015. He would make an excellent platoon partner with Arias, for a total of $5 million, or half the price of Chase Headley. But why go with these platoon players when you can add a proven everyday guy in Headley? Because the Giants could use the money to help pay for improvements elsewhere, such as left field, or the starting rotation. They could even save the Headley money for the 2016 season, when the Giants lose over $40 million in annual salaries to the likes of Tim Lincecum, Tim Hudson, Jeremy Affeldt and Scutaro. But a platoon of Valbuena and Arias is not just half the price, it’s equal the production. Let’s take a look:

vs RHP in 2014:

Headley .690 OPS, 99 wRC+

Valbuena .811 OPS, 124 wRC+

vs LHP in 2014:

Headley .721 OPS, 110 wRC+

Arias .720 OPS, 107 wRC+

Now it is worth noting that Headley’s ISO was very consistent from both sides, posting a .130 vs RHP and a .132 vs LHP. Valbuena posted a .208 ISO vs RHP, while Arias was just .076 vs LHP. If the Giants did choose this platoon, the power would be limited from Arias. But what about the defense from each player?

Career UZR/150

Headley 10.8 (6,366.2 innings)

Valbuena 10.2 (2438.2 innings)

Arias 15.6 (800.1 innings)

Even when you combine Valbuena and Arias, the total time at third base is roughly half the time Headley has seen at the MLB level. With that being said, both are very good defenders at third base.

Would a platoon of Valbuena and Arias produce better results than Chase Headley in 2015? Maybe, maybe not. But it is very possible that the Giants get equal the production, at half the price, and spend some of that extra money elsewhere. Maybe the extra $5-6 million lands them a pitcher they couldn’t quite afford if they had Headley under contract? Maybe it helps them make space for a Justin Upton in left field in 2015? Either way, the Giants would be wise to find a cheaper option at third base.


The Mariners’ Deficiency

This trade, at least in its basic terms, has been well covered. I personally don’t believe that one of these players is really any better than the other, not in any significant sense. The Mariners gave away a roughly league-average player and received a roughly league-average player in return, but as a result paid a penalty in salary and in team control — for essentially no reason. Jeff has gone over all of that on two different websites. It’s a nice deal for the Jays. It’s less than that for Seattle.

Where it gets ugly is at the far periphery, the tertiary implications of this deal that, on its face, really indict a disparity between the Mariners’ front office and the rest of baseball.

The Mariners now need a right fielder, having just traded theirs. A right fielder is an everyday player theoretically assigned for about 1500 defensive innings and 700 plate appearances; and therefore someone who will be competing, on average, against a very high threshold of performance. From 2012-2014, the average full-time right fielder produced 2.6 WAR/600 per FanGraphs. The market price for 2.6 WAR, at the established pre-season price of $7M/win, is approximately $18M. This is about in line with what’s been observed to date. The 2015 cost of these players on the open market:

Player Projected WAR 2015 Salary (M) $/Win Additional Costs
Hanley Ramirez 3.6 $22.00 $6.11 2nd Rd. Pick, length
Victor Martinez 2.7 $17.00 $6.30 1st Rd. pick, length
Nelson Cruz 1.5 $14.50 $9.67 1st Rd. Pick, length
Nick Markakis 1.5 $11.00 $7.33 length
Torii Hunter 1.7 $10.50 $6.18 None
Jason Heyward 5.0 $7.80 $1.56 Shelby Miller, tm. control
Justin Upton 3.0 $14.50 $4.83 ???

In order to obtain someone to meet this threshold, you have to pay. You have to pay a lot. Nick Markakis just signed for 4 years and $44M. Nelson Cruz signed for $57M to knock out just one half of the workload, also costing a draft selection. Victor Martinez signed for $68M to knock out just one half of the workload. He didn’t cost the Tigers a draft selection, but that’s unique to the Tigers. For someone who can do it all, you’re looking at Hanley Ramirez, and then you’re looking at nine figures. The $/win for the four free agents above is $7.12M. Their average salary for 2015 is $15.0M for 2.2 WAR. Four of the five signed for 4 years or more, the exception being Torii Hunter, who is likely to retire.

The Blue Jays now need a #5 starter, having just traded theirs. A #5 starter starts more-or-less every 5 days. About once every 4 or 5 weeks, his start might be skipped thanks to an off day. An average #5 starter makes roughly 30 starts for roughly 180 innings per year. On average, this type of pitcher meets a very low threshold of performance. From 2012-2014, there have been 257 qualifying seasons for starting pitchers. The average performance of this group is 2.7 WAR/200 IP. Population sections of 20% amount to 51 or 52 individuals per section, the lowest ranked section theoretically accounting for the #5 slot. The average performance of this section is 0.9 WAR/200 IP. At the established pre-season price of $7M/win, the market price for 0.9 WAR is approximately $6.5M. The cost of these players on the open market:

Player Projected WAR 2015 Salary (M) $/Win Additional Costs
Colby Lewis 0.6 $4.00 $6.67 None
JA Happ** 1.2 $6.70 $5.58 Michael Saunders, tm. cont
AJ Burnett 1.7 $10.00 $5.88 None
Jerome Williams 0.4 $2.50 $6.25 None
Brad Mills None Minor League NA None
Jeff Francis None Minor League NA None

**Option picked up

To obtain players who can meet this threshold, you can generally pay fringe talents for 1-year deals or look to candidates from minor-league affiliates for league-minimum salaries. This position is not often filled by a singular person, as teams rarely have that many reliable starters on a roster due either to scarcity or to budgetary constraints. The Mariners themselves filled their 5-slot in 2014 with a combination of Erasmo Ramirez, Blake Beavan and Brandon Maurer, winning 87 games. This is not uncommon. The Orioles, Angels and Athletics all employed variations of this theme.

The average $/win for the above free agents given guarantees is $6.3M. The average guaranteed salary for 2015 is $5.8M. None of these players is signed beyond 2015.

The Blue Jays took their high-cost need and exchanged it for a low-cost need, transferring the balance onto the Mariners.

This is not to say that the Blue Jays have to sign a #5 starter. If someone better presents themselves at a price they can incur, they absolutely have that option. But if they decide to follow the standard rotation model, that’s okay too, because most of baseball either does or has to. The penalty for playing down to the average #5 starter is relatively small.

The Mariners no longer have this luxury. There’s no such thing as a #5 right-fielder. If you were to place the terms of this concept on the right-field position, you’d have a replacement player, the penalty for which is a couple wins. The Mariners, at least in their position, can’t afford that.

This isn’t about obtaining talent for talent, salary for salary, years for years. This is about understanding your market, about being able to let your environment work for you. We don’t have to sugar-coat this. There are people who get it and people who don’t. Jack Zduriencik, for whatever reason, just doesn’t get it.

But the Mariners aren’t constrained to budget limitations in the way the A’s and Rays are. They don’t struggle in the draft the way the Yanks, Astros and White Sox do. The Mariners, for all of their issues, have a winning team with a young core to credit them, and Zduriencik has quite the hand in that. That his knack for strategy might be among the lower tier of his peers is a singular constraint among many working parts, and the hope is that the rest of the machine can overcome the deficiency — the same way a lot of teams do.

But I won’t blame you for cringing at what might be next. Their propensity for this kind of deal is matched only by their propensity to compound one mistake with another. And given their shiny new need, they may not have much of choice.


Could Pro Sports Lead Us to Wellness?

Comment From Bill
St. Louis is being hindered in the stretch drive by some kind of GI bug passing through (so to speak) the team. Reports have as many as 15 guys down with it at once. That seems a lot, but given the way a baseball clubhouse works, my question is why don’t we see more of that? Answering that baseball players are fanatically interested in sanitation and hygiene ain’t gonna cut it, I don’t think…

12:10
Dave Cameron: They have access to a lot of drugs.

–comment from a chat at FanGraphs, September 24, 2014

So this comment caught my eye. Ever since I began following sites like BaseballProspectus.com and FanGraphs.com, and reading things like Moneyball, I’ve found myself thinking about efficiency and unappreciated or unexplored resources in different situations.

I realize this was a throwaway line in a baseball chat. But it piqued my interest because it seems to point out something that’s maybe underappreciated and understudied about how sports teams go about their business–specifically, the kinds of things they do to keep their athletes healthy.

My question is, does this represent a potential source of “Found Research” data that could help the rest of us reach wellness? more


The Real Reason for Mark Teixeira’s Decline

When the Yankees signed Mark Teixeira to an 8-year, $180 million contract in the 2008-2009 offseason, they knew fully well that they were getting a hitter who liked to pull the ball. Like Jason Giambi, his predecessor at first base, it was believed that his superb power would make up for a batting average that was likely to decline throughout the deal, especially with the short porch in right field at Yankee Stadium. However, Teixeira’s 2014 line of .215/.305/.413 against righties was probably not what they had in mind for their switch-hitting first baseman.

Naturally, many have jumped to blame Teixeira’s woes on the drastic defensive shift that is employed when he hits left-handed. But the shift was there in 2009, when Teixeira finished 2nd in the AL MVP voting with a .292/.383/.565 line and 39 home runs. The fact is Mark Teixeira, spray chart included, was once good enough of a hitter to earn a $180 million contract. Defenses could basically know where he was going to hit the ball and still shook in their boots when he came up to bat.

However, one factor has not remained constant: Teixeira’s production against fastballs. In his prime, Teixeira wasn’t just good against heaters: from 2003-2012, his wFB/C of 1.70 ranks 16th among qualified hitters. But his numbers against fastballs has consistently diminished during his Yankee years. Brooks Baseball gives some additional information (note: wFB/C is from FanGraphs and is not against RHP only):

Mark Teixeira vs. RHP
Year Whiff/Swing GB/BIP% wFB/C
2009 9.74% 30.56% 2.22
2010 11.55% 25.00% 1.29
2011 11.64% 25.23% 1.43
2012 11.80% 29.41% 1.47
2014 14.52% 34.58% -0.14

2014 saw Teixeira whiffing on more fastballs then ever before and hitting more grounders when he did make contact. Even more alarming is the fact that his wFB/C is negative, suggesting that he was a liability against what was once his favorite pitch. Baseball Savant shows a similar downward trend against righties throwing four seam fastballs, two seam fastballs, cutters, or sinkers:

Mark Teixeira v. RHP
Year BA SLG
2009 0.314 0.661
2010 0.291 0.526
2011 0.258 0.512
2012 0.271 0.476
2014 0.195 0.381

Teixeira’s decreasing offensive value makes sense when one considers the fact that what was once his greatest strength as a hitter is now a weakness. And considering the fact that FanGraphs has had pitchers throwing 57.8% fastballs to Teixeira throughout his career, it is definitely not a problem that can be avoided by trying to do damage against other pitches. However, this trend also suggests that Teixeira, who put up wRC+’s of 142, 128, 124, and 116 in the first 4 years of his deal, can become a force on offense again if he can start hitting heaters like he used to.

Unfortunately, I have very little no expertise that can assuredly help Teixeira regain his prowess against fastballs. The only “shot in the dark” idea I have for Teixeira is for him to level out his notorious uppercut swing. The fact that Teixiera is whiffing on more fastballs and hitting more groundballs suggests that his ability to make solid contact has diminished with age and injury. Straightening the path of his swing would give him more of a margin for error.

He could maintain his power by guessing on more pitches, which is what I believe fellow Yankee Brett Gardner did in 2014, when he hit 17 of his 40 career home runs. According to Baseball Savant, 15 of his 17 home runs came from four seam fastballs, two seam fastballs, sinkers or cutters. The fact that all of them were pulled to right field, despite greater velocity, leads me to believe that Gardner was sitting on them more often than not.

Alternatively Teixeira’s lingering wrist injury (which is why I left his 15-game 2013 season off the tables above) might be making it harder for him to turn on pitches with high velocity. Conversely, Teixeira could be correct in suggesting that a full offseason workout program could allow him to return to form. In any case, Teixeira needs to regain his ability to destroy fastballs if he has any hope of being a force on offense again.


High-End Free Agents: Do They Exist?

A common refrain during this point in baseball’s calendar is that the free agent market isn’t what it used to be. The underlying premise is that more and more teams place more and more focus on locking up their young, talented players to long-term contract extensions.  In turn, fewer and fewer young and talented players are reaching free agency. With the free agent market drying up, teams must pay a significant premium for the few players that do reach free agency that are both relatively young and relatively talented. Ken Rosenthal highlighted this line of thinking in an article last year:

One of the game’s rising young stars recently told me he was concerned about the flurry of contract extensions in baseball. The player didn’t want to be identified, but his thoughts intrigued me, in no small part because he is a candidate for an extension himself. The player’s point was this: Free agency helped make the players union into a powerhouse. But now, with fewer top players reaching free agency, who is going to drive the top of the market? Shouldn’t players feel a sense of responsibility to those who came before them and those who will follow? Fair questions, particularly if you look at the next two free-agent classes, which are almost devoid of stars. But when I expressed the player’s concerns to the head of the union, Michael Weiner, and a prominent agent, Scott Boras, I didn’t get the answers I expected. Neither views the trend as necessarily a problem.

But is this really a trend at all? Let’s look at that question more closely. Let’s begin by looking at the 2014-2015 crop of free agents.  Baseball Reference has a list that is published here. As of this writing, that list contains 306 players. These 306 players have an average age of 31.6 and a median age of 31.0. The average WAR is at 5.54, which reflects outliers at the high end (like Ichiro and Jason Giambi); the median WAR for these 306 players is only 1.90. Of these 306, there are only six players that both (a) are 30 years old or younger (using Baseball Reference’s midpoint method to calculate ages, this is the age the player will be on July 1 of the next season), and (b) have achieved 12 wins above replacement in their career. These six players, in order of descending career WAR, are (i) Pablo Sandoval, (ii) Billy Butler, (iii) Asdrubal Cabrera, (iv) Melky Cabrera, (v) Colby Rasmus, and (vi) Max Scherzer.

If you are general manager looking to fill multiple holes in your roster, this is not the most inspiring group, especially when considering the cost of doing so. This group does reflect the current narrative — there does appear to be a dearth of high-end talent available on the free agent market. But how does this group compare to prior free agent cohorts? Has the free agent market really dried up, or has it always been dry?

Again, Baseball Reference is helpful. On its site, it lists the free agent signings for each year. For example, its list of 2013-2014 free agents is published here. Using the same criteria as before (30 or younger, and 12 career WAR or better), the 2013-2014 free agent crop had seven relatively young and relatively talented players: (i) Josh Johnson, (ii) Brian McCann, (iii) Jacoby Ellsbury, (iv) Ubaldo Jimenez, (v) Scott Kazmir, (vi) Chris Young (the hitter), and (vii) Matt Garza. Perhaps a bit better than 2014-2015, in general, but not markedly different. Looking back further, in summary fashion, here is a look at the free agent market during the ten seasons leading up to this one:

Total Number of Signings/Free Agents* Average Age Median Age Average WAR Median WAR Relatively Young and Relatively Talented (30 and younger; 12 bWAR or better)
2004 493 31.5 31 5.27 0.3 12
2005 420 31.5 31 5.03 0.5 6
2006 411 31.4 31 6.06 0.4 10
2007 391 31.3 31 5.41 0.4 1
2008 433 31.1 30 5.44 0.4 6
2009 443 31.2 31 5.14 0.6 6
2010 445 31.2 31 5.76 0.6 4
2011 417 31.3 31 5.46 0.6 7
2012 426 31.3 30 4.74 0.7 8
2013 413 31.1 31 4.96 0.9 7
2014 306 31.6 31 5.54 1.9 6

As for a list of the remaining names of the relatively young and relatively talented players appearing in the table above, they are:

2012-13:  Zack Greinke, Russell Martin, Michael Bourn, B.J. Upton, Melky Cabrera, Anibal Sanchez, Edwin Jackson, Stephen Drew

2011-12:  Jose Reyes, Grady Seizemore, Dontrelle Willis, Francisco Rodriguez, Aaron Hill, Prince Fielder, Kelly Johnson

2010-11:  Carl Crawford, Dontrelle Willis, Mark Prior, Jhonny Peralta

2009-10:Matt Holliday, Jon Garland, Rich Harden, Coco Crisp, Hank Blalock, Austin Kearns

2008-09:  CC Sabathia, Mark Teixeira, Jon Garland, Mark Prior, Francisco Rodriguez, Adam Dunn

2007-08:  Aaron Rowand

2006-07:  Barry Zito, Kerry Wood, Mark Mulder, Marcus Giles, Jeff Weaver, Wade Miller, Randy Wolf, Juan Pierre, Aramis Ramirez, Aubrey Huff

2005-06:  Rafael Furcal, Jeff Weaver, Wade Miller, Ramon Hernandez, Paul Konerko, A.J. Burnett

2004-05:  Carlos Beltran, J.D. Drew, Adrian Beltre, Troy Glaus, Edgar Renteria, Matt Morris, Richard Hidalgo, Eric Milton, Kevin Milwood, Placido Polanco, Wade Miller, Richie Sexson

What can we learn from looking at information from the ten free agent classes before this year’s free agent class?

  1. The free agent classes have looked very similar, on average, for the past ten years.
  2. Over the past ten years, free agency has not yielded the bumper crop of talent that has been suggested.  The locking up of young talent prior to free agency does not appear to be a recent trend.
  3. The appearance of high-end talent, particularly high-end talent in the fat part of an aging curve, is at best sporadic (occasionally yielding a young high-end bat, such as Carlos Beltran, Adrian Beltre, Matt Holliday, or Prince Fielder, but almost never a pitcher with his best years ahead).

Based on this look, it has always been difficult to find players in their prime on the free-agent market. They exist, but they are rare. This does not appear to be a new trend.* The number of free agents in 2014 does not include the players that have not been tendered a contract for arbitration. Once this group of non-tendered players become free agents this winter, it will both inflate the number of available free agents and depress the average and median WAR figures shown in the table.


A Gif-tastic Review of Arizona Fall League Pitching Prospects

Rogers Hornsby was once quoted as saying, “People ask me what I do in winter when there’s no baseball. I’ll tell you what I do. I stare out the window and wait for spring.”  While staring out of a window for several months may be a worthwhile way to spend our limited time on Earth, I wish to propose a marginally more enjoyable choice: watching gifs of top pitching prospects.

With the 2014 Arizona Fall League featuring several top pitching prospects, and with the plentiful high-quality videos posted on Youtube by our good friends at MLBProspectPortal.com, I was able to create a collection of gifs that showcase these pitchers’ talents.

Kyle Zimmer

Zimmer finished the AFL with an incredible 41.7 K%.  Unfortunately, due to injuries, he only made three starts.  When he has been healthy, though, he has been known to throw mid 90’s fastballs and biting curveballs.  Below is a gif of his curveball thrown to Pirates’ outfield prospect, Josh Bell.  It should be noted both that Bell missed this curveball by a lot, and that he rarely swings and misses versus left-handed pitchers (9.9 K% against them).

Kyle Zimmer 2014 AFL

In the pitch following the curveball, Zimmer threw a high fastball that Bell couldn’t catch up to:

http://cdn.makeagif.com/media/11-26-2014/M0iguz.gif

In the pitch following the curveball/fastball combination, Zimmer threw either a changeup or two-seam fastball that had Bell out in front:

http://cdn.makeagif.com/media/11-26-2014/DmBK3j.gif

Tyrell Jenkins

A former 1st round supplemental draft pick by the Cardinals in 2010, Tyrell’s statistics have been erratic in the minors, including his 13.3 K%/7.4 BB%/4.31 FIP in High A in 2014.  His athletic frame and power stuff are still coveted, though, and the Braves acquired him in the recent Jason Heyward trade.  Below is a curveball from Jenkins to Addison Russell, who happens to be one of the top prospects in all of baseball:

http://cdn.makeagif.com/media/11-26-2014/CFVYNx.gif

Below is a high fastball to Dalton Pompey that resulted in a strikeout.

http://cdn.makeagif.com/media/11-26-2014/mPI9aR.gif

Archie Bradley

Archie Bradley is likely the most well-known name on this list, and some sources had him as the #1 pitching prospect entering this season. FanGraphs’ own Kiley McDaniel gave him a future 70 grade on his fastball, along with a future grade of 65 on his curveball.  Below is one such curveball thrown to Addison Russell:

http://cdn.makeagif.com/media/11-26-2014/g_VnqS.gif

Not content to merely acquire a strikeout against Russell, Bradley went with his fastball with good arm-side run to create a double play-inducing weak grounder:

http://cdn.makeagif.com/media/11-26-2014/r52BEN.gif

Tyler Glasnow

Tyler Glasnow posted a league-leading 31.9 K% and .171 opposing batting average  in 2014 in High A.  The third highest K% in the FSL was 23%, and the second lowest opposing batting average was .216.  These numbers may seem incredible to you, but they’re actually a step down from his 2013 season in Low A where he posted a 36.3 K% and a .141 opposing batting average.  You may have guessed that Glasnow has good stuff.  You’d be right.

Below, the batter sticks his bat out for a bunt and then spins back as if the pitch were going to hit him.  It was called a strike.

http://cdn.makeagif.com/media/11-26-2014/p2TYOo.gif

Finally, we have a called strike three on a curveball.  Notice the defeatism in the batter.; he has been bested by the pitcher but is glad that he has been allowed to keep his life.

http://cdn.makeagif.com/media/11-26-2014/FkmhjH.gif

*Credit for all of the videos goes to MLBProspectPortal.com.