Archive for July, 2013

Be a GM: Miami Marlins – Part 3 – Trade Deadline

From my personal blog msilbbaseball.wordpress.com

—–

The Miami Marlins are always in the news at the Trade Deadline, and the story is no different in 2013.

Bullpen

Steve Cishek Fist Pump

     The Marlins possess sought after relievers Steve CishekMike DunnRyan Webb, and Chad Qualls.  Cishek, Dunn, and Webb still have multiple years under team control, while Qualls’ is signed on a one-year deal.  Of the four, I would be most inclined to keep Cishek, who is currently closing games for the Marlins, and doing so extremely well.  Qualls is the most likely to be dealt, as the Marlins don’t want to part with valuable bullpen arms who could contribute to next year’s team.  Also, they don’t want to leave the young starting rotation with an inexperienced bullpen to back them up for the remainder of this season.  Qualls would be a rental reliever for any team, as a 34 year-old journeyman doesn’t scream “Long-term plans”.  Nevertheless, Qualls has caught fire in 2013, putting up the best season of his career.  Through 42 IP in 42 Appearances, Qualls has put up a 2.57 ERA, 1.024 WHIP with a 7.29 K/9 and a 1.93 BB/9 leading to a 3.44 FIP.

UPDATE (9:57 PM) – Chad Qualls fell while celebrating a strikeout tonight.  Stay hot kid.

Zack Cox at Arkansas

     The Marlins dealt relief to a contender at last year’s deadline as well, sending Edward Mujica to the Cardinals for 3B prospect Zack Cox.  Mujica had a 4.38 ERA at the time he was sent to St. Louis, so Qualls’ numbers are significantly superior.  However, Mujica was just 28 at the time, and still had a year of Arbitration remaining, which increased his value.  All things considered, Qualls should be able to produce the same return as Mujica did, possibly more.  What Mujica brought in was fairly significant.  Zack Cox was the Cardinals #4 prospect heading into 2012 by Baseball America.  He was drafted in the first round out of the University of Arkansas  in hopes that he would develop into a premier hitter.  He showed that ability during his first full minor league season in 2011, but fell off dramatically in 2012, hitting .254/ .294/ .421 in the hitter-friendly Pacific Coast League.  Cardinals management decided it was time to move on from Cox, and shipped him to the Marlins, who sent him back down to AA.  Cox has been solid in AA this season, hitting .292/ .393 / .391.  his power numbers decreased, but he’s hitting more consistently as the Marlins are allowing him to take a slow track through the system.  He has the Marlins’ future 3B job in his sights, but will be competing in the system with recent 1st round pick, Colin Moran out of UNC.

     In my opinion, the Marlins sold Mujica enormously high  The Cardinals’ frustration with Cox allowed him to be moved at a fairly cheap price, and it’s difficult to say that this trade is comparable to what the Marlins can get for Qualls.  Nevertheless, this shows that the Marlins can target mid-level prospects (or seemingly declining former top level prospects) in exchange for Qualls.

Decision: Avoid trading Qualls for the sake of trading him.  Aggressively shop him around, but if the return isn’t right (comparable to Mujica’s return), try to negotiate a 2014 contract in the off-season.  Cishek, Dunn, and Webb are main contributors to the Marlins bullpen, and with the team appearing to be a contender in 2014, I would want to keep that consistency.

OF Justin Ruggiano

Veteran Position Players

     The Marlins could potentially move Placido PolancoJuan PierreGreg Dobbs, and Justin Ruggiano.  Polanco and Pierre are signed to one-year deals, and will be Free Agents after the season.  Dobbs is in the last year of a two-year contract.  All four are most likely fits on the bench for a contender, and none of them would be able to bring in a significant return.  Ruggiano had a breakout year in 2012, his first full season, hitting .313/ .374/ .535 in 91 games.  However, he’s slumped this year, removed from his everyday role, floating around a .200 batting average.  He holds the most value, as he still has another season before he’s arbitration eligible, and teams may hope that he returns to his 2012 form.  However, his remaining pre-Arb year is valuable to the Marlins as well, who didn’t want to move him a few weeks ago.  The Marlins called up their top two outfield prospects last week, which makes Ruggiano slightly more available.

Decision: Without much to gain in return, I’d hold on to the veterans, and try to retain Polanco, Pierre, and Dobbs for another year to serve as valuable bench players for the 2014 season.
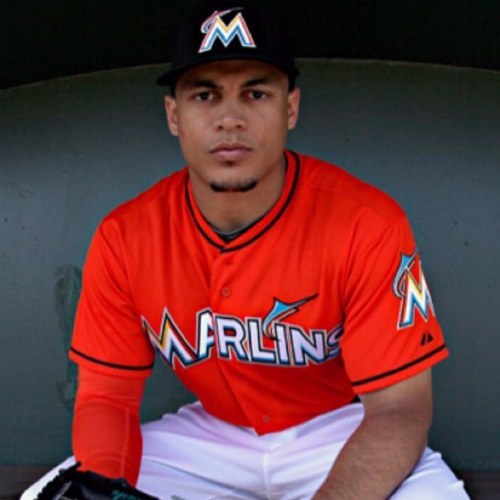
Giancarlo Stanton

     The feature of this article, and many national news stories is Right Fielder Giancarlo Stanton.  I’ve admittedly flip-flopped back and forth about what the Marlins should do with the face of the franchise.  He’s 23 years old, and will be arbitration-eligible for the first time after this season, which will increase his salary by a couple million dollars.  He led the league in slugging in 2012, and had already amassed over 100 career Home Runs.  He is a budding superstar, and teams are willing to pay a very high price for him.

Keep Him

Giancarlo Stanton

     The Marlins are historically known to being a penny-pinching team, but are in a position to spend big money, which they have available to give to Stanton.  If the Marlins stick with Stanton, I see them avoiding arbitration this year with a one year deal in the neighborhood of $7-8MM.  I then project him to earn $10-12MM after 2014, and $13-15MM after 2015.  To avoid paying Stanton $13-15MM for 2016, and then have a future long-term deal based on that salary structure, I would begin working on a back-loaded multi-year deal immediately after the season.  My first offer of a  proposed contract would follow a similar structure to my predicted arbitration salary hike, but then level off around $17-18MM for 2016 and beyond.  Miguel Cabrera, former Marlins emerging offensive superstar, signed a long-term deal with the Tigers in 2008, which levels off at about $20MM per year.  In my opinion, Stanton has shown the potential to deserve a similar contract, but there is no way that I would begin the negotiations at Miguel Cabrera’s deal.

Trade Him

Dontrelle’s Delivery

     Stanton’s value is as high as it’s ever been.  As mentioned before, he’s an emerging superstar who is just reaching arbitration for the first time.  Comparing him again to Cabrera, the Marlins traded him after the 2007 season to the Detroit Tigers along with pitcher Dontrelle Willis for the Tigers #1, 2, 6, 8 rated prospects according to Baseball America, along with other mid-low level players.  The Marlins would be able to reel in at least three of a team’s top ten prospects, ideally two of the top five.  In my opinion they should throw in one of the relievers teams have been calling for (preferably Qualls) to bump up the level of the prospects they would receive.

     The most important thing to consider in this situation, is that the Marlins already have multiple potential replacements for Stanton.  According to Baseball America, three of the Marlins’ top five prospects are outfielders, all of whom have been in the majors this season (Christian Yelich #2, Jake Marisnick #4, Marcell Ozuna #5).  Beyond those three, they also feature Jesus SolorzanoAustin DeanBrent Keys, and Isaac Galloway in a rich system of minor-league outfielders.  Stanton is simply not at a premium position of need for the Marlins, which in my opinion makes him expendable.  Also, the millions of dollars that would be used to lock up Stanton could be better used to lock up the Marlins phenomenal young pitching staff.

Don’t Trade Him

     The rebutting argument against trading Stanton is how unpredictable trading for prospects can be.  Once again, the Marlins traded Miguel Cabrera and Dontrelle Willis to the Tigers for four of their top ten prospects, including #1 and #2.  A total of zero of them are still with the Marlins, and Cameron Maybin (#1) and Andrew Miller (#2) never lived up to their potential.  All those two names do is make Marlins fans cringe.  Bad trades happen, Major Leaguers are known commodities, while prospects are prospects, something that might be good in the future.  The unpredictability and risk of trading Giancarlo is something that cannot be over-analyzed.

Decision: Make Stanton Available, and listen to offers, but don’t undersell him

Yelich at the 2013 Futures Game

     If a team wants to give you their entire future, then by all means go for the trade.  But if I’m Michael Hill, and I’m not receiving everything that I want from a team, then there’s no deal.  If I’m trading Giancarlo Stanton to your team, I want to be able to go through your organization, and hand-pick the players I want like I’m at a buffet.  If any compromise has to be made, then it’s no deal.  Stanton won’t break the bank in the off-season, and it’s worth keeping him around to see if the Marlins can be truly competitive in 2014, which I believe is very possible, barring unforeseen injuries.

Needs

Jose Fernandez

     The most difficult part about making trades for prospect is to decide where you need help.  The Marlins are set in the outfield, no question about that.  3B seems locked down with Cox and Moran, and I’m a big fan of future Gold Glove winner Adeiny Hechavarria at SS.  Derek Dietrich hasn’t been amazing at 2B, though I really like Ed Lucas.  If only he wasn’t 31.  Donovan Solano could still be a fit, but this is a position that could use improvement.  At 1B, there isn’t much behind Logan Morrison, who is finally fully healthy.  Rob Brantly has been a disappointment behind the plate after impressing at the end of 2012 after he came over from the Tigers for Omar Infante and Anibal Sanchez.  Brantly is still just 24, but is hitting .232/ .283/ .294 while splitting time with Jeff Mathis.  Former first round pick Kyle Skipworth hasn’t been able to hit at any level, and relying on J.T. Realmuto to be the future isn’t a safe bet.  The Marlins pitching is phenomenal, led by Jose Fernandez, and followed by Nate EovaldiJacob Turner and Henderson Alvarez.  The Marlins also have Andrew Heaney and Justin Nicolino in the minors among others with a young pitching staff whose future is just as bright, if not brighter than the Marlins’ outfield crop.

Trade Possibilities

Chad Qualls

2B Kolten Wong

     If we assume that Chad Qualls can bring in a similar return to Edward Mujica, then we’re talking a downward-trending lower high-level prospect (if such a thing exists) or a mid-level prospect.  I love what the marlins did in the Mujica trade, by taking a risk on a possible high-level guy, who is having a bad season.  If the Marlins deal with the Cardinals again, Kolten Wong’s name has been thrown around, as he’s blocked at the Major League level by Matt Carpenter.  However, the Marlins aren’t likely to be able to put together the package for him without having to part with an integral piece.  His name has been linked to a potential Alexei Ramirez trade, who holds more value than Qualls.  The Marlins would have to throw in another reliever or two (Dunn, Cishek, or Webb), or maybe even Derek Dietrich who replace Wong’s spot in the Cardinals system, obviously to a lesser extent.  As an outsider, it’s unclear what the asking price is for Wong, but maybe the Cardinals could sell low again.  Wong is more highly regarded than Cox was at this time last year, but then again Qualls has been better than Mujica was, and the Marlins have arms to give.

Giancarlo Stanton

SS/IF Xander Bogaerts

     I’m trying very hard not to be one of those internet users who has no sense of trade balance, but it would take a completely unreasonable package for me to trade Stanton right now.  The Red Sox reportedly are willing to give up everything to get Giancarlo.  Any deal with them would need to include Xander Bogaerts, and Henry Owens, plus much more.  Bogaerts plays the same position as Hechavarria, but could move over to 2B to create a stellar middle infield that already has me excited.  Bogaerts, the Red Sox #1 prospect by BA, is a 20 year old from Aruba, who has absolutely torn it up in the minors.  Owens, their #5 prospect, recently turned 21, and has pitched very well at High-A Salem.  The Red Sox also have C Blake Swihart at #6 who is showing an upward batting trend.  Their #2 prospect, former South Carolina Gamecock standout, Jackie Bradley Jr. has already spent time in the majors, but being an Outfielder isn’t necessarily attractive to the Marlins. Again, I’d just pick out the Red Sox star prospects, and if I can’t have everyone I want, then sorry Beantown, Giancarlo will still be a Marlin.

     The Pirates and Rangers have also expressed interest in Stanton.  For me, the Pirates would have to part with Gerrit Cole and Jameson Taillon at least.  It would create a very crowded pitching rotation for the Marlins, but is that ever a bad thing?  Unfortunately for the Pirates, many of their top prospects are Outfielders which doesn’t help.  The Rangers have Jurickson Profar, who has been playing 2B.  However, they just traded for Matt Garza which took a hit out of their system, and don’t have many other guys close enough to being Major league ready for me to feel comfortable about.

If Stanton does get traded, I’m thinking that it’s going to be the Red Sox.


Getting Ahead with Wainwright and Moore

If I were to argue that Adam Wainwright and Matt Moore were having similar seasons, you’d probably question my analytical skills. They have similar win totals and are both major-league starting pitchers on good teams, but you generally wouldn’t consider them to have a lot else in common when thinking about them in the context of their contemporaries. Heck, they don’t even throw with the same arm! I’m not going to argue that they’re having similar seasons, but there is one thing they are doing at a surprisingly similar rate. Allow me to explain.

Let’s start by talking about how they are different. Wainwright goes much deeper into games, walks way fewer batters, gets a lot more ground balls, and limits runs a better rate. FIP and xFIP like him a lot better, no doubt because he doesn’t issue free passes. Moore strikes out more batters, but other than that he doesn’t measure up to what Wainwright brings. Wainwright is right in the thick of the NL Cy Young race, Moore is just having a solid season.

Name GS IP K/9 BB/9 HR/9 BABIP LOB% GB% HR/FB ERA FIP xFIP WAR
Adam Wainwright 21 154.2 7.97 0.99 0.35 0.308 76.30% 49.10% 5.30% 2.44 2.20 2.72 4.9
Matt Moore 20 116.1 8.66 4.33 0.62 0.252 77.00% 39.00% 6.20% 3.17 3.56 4.22 1.9

The comparison comes as a byproduct of some aimless leaderboard scanning and a stray thought. I started wondering about the correlation between Zone% and BB%, much in a similar way to how Jeff Sullivan considered the connection between Contact% and K% earlier this year. My study led me to the production of this graph, with BIS data through July 24:

Zone

Generally, a higher Zone% correlates with a lower BB%. The slope coefficient is -0.33 and is statistically significant, but the Adjusted R squared is only .2116. Pitchers who pound the zone usually walk fewer batters than pitchers who don’t, but there is a lot of unexplained variation. Matt Moore and Adam Wainwright carry quite a bit of the blame for that as they have nearly identical Zone% and extremely different BB%. In fact, Wainwright is 1st in BB% and Moore is 87th among qualified starters.

Wainwright has a K/BB ratio above 8. Moore’s is 2. Wainwright and Moore both strike out between 22 and 24% of the batters they face, but Wainwright walks less than 3% and Moore walks more than 11%.

Amazingly, Wainwright and Moore throw 44.5% and 44.2% of their pitches in the zone, respectively, despite what their walk rates seems to be telling you.

If you give them both 100 pitches and 25 batters, they’ll both average 55-56 strikes but Wainwright will walk fewer than 1 and Moore will walk close to 3. That’s impressive. No other two starters in baseball this year have such similar Zone% and such different walk rates. (Ubaldo is the data point above Moore, but he is a full percent behind Wainwright in Zone%)

Name O-Swing% F-Strike%
Adam Wainwright 38.40% 65.70%
Matt Moore 28.50% 51.90%

Well that’s something. Wainwright and Moore throw the same number of pitches in and out of the zone, but Wainwright gets batters to chase when he leaves the zone much more often and starts at bats with strikes much more often as well. It’s pretty interesting that two pitchers can throw the ball in the zone with the same frequency and get such dramatically different results.

You can see that despite hitting the zone with similar frequencies, Wainwright hits the zone early to set up chases later on in the at bat. Here are their zone plots on first pitches.

Wainwright
Wainwright

Moore
Moore
Wainwright and Moore are a great example of how averages can sometimes be deceiving. Despite throwing the same percentage of pitches in and out of the zone, they are throwing them in and out of the zone at much different times. Wainwright pounds the zone early and gets hitters to chase late. Moore misses more consistently.

Think of it this way. When Wainwright throws a pitch out of the zone, he’s doing it when he’s ahead in the count so hitters are forced to chase and get themselves out. Moore leaves the zone with less purpose and more because he doesn’t have great control. It balances out to the same percentage, but the effects are much different. You can see it in BB%, you can see it in ERA, and you can see it in FIP and other advanced stats.

Matt Moore is still a very promising young pitcher and is still quite valuable in his current form. Nothing about this is meant to degrade Moore, but rather to highlight some extreme variation and consider how important it is to get ahead of hitters. By the third and fourth pitches in at bats, Wainwright has hitters chasing and Moore has hitters taking.

Getting ahead early with a first-pitch strike is really important as it is much more predictive of BB% than Zone%. The slope coefficient is nearly identical to Zone%, but the Adjusted R Squared comes in at .4020.

FStrike

Finding the zone is important, but as Wainwright and Moore demonstrate, finding the zone early is more important. Matt Moore has tremendous stuff, but if he hopes to get results to match Wainwright, he’s going to have to command it more effectively, even if he is hitting the zone with the same frequency.

Moore doesn’t really profile as a Wainwright kind of pitcher, but Wainwright’s own impressive drop in BB% rate can be instructive for pitchers looking to improve. Wainwright is throwing pitches in the zone less frequently as he’s aged, but is adding to his first-pitch strikes. I’ll let the data speak for itself. Adam Wainwright is fantastic.

ZF

BB


Bay of Cigs: 100 Days of Summer Run Distribution

I celebrated tax day this year by taking a dive into the numbers behind the Detroit Tigers’ offensive production. Since last season, I had developed the feeling that this should-be offensive power was having trouble scoring late in games, hamstringing their ability to mount comebacks and generally secure a win in the later innings, and I wanted to investigate to see whether that really was the case.

The evidence I gathered in April appeared to support my hypothesis. The 2013 season was just twelve games old, though, and it was difficult to ascribe too much meaning to data gathered from such a small sample set. As of today, however, Detroit has played one hundred games in the 2013 campaign, so I decided to update the numbers:

Read the rest of this entry »


CAIN: Counting a Pitcher’s HR/FB Out-Performance

Dave Cameron recently posted an interesting article about Jhoulys Chacin. It’s all about how Jhoulys Chacin is defying the rules of HR/FB rates. His HR/FB rate this year is a mere 2.8%. Jhoulys Chacin has pitched 120 innings, had 106 fly balls, and allowed just three home runs. Very impressive. But it makes you wonder if there are other pitchers who are maintaining low rates while allowing more fly balls overall. Because while Jhoulys Chacin is obviously benefiting from his HR/FB ratio, it’s possible for a pitcher to have more fly balls while maintaining a slightly higher HR/FB and benefit more. So I invented CAIN, a counting stat to help measure that.

CAIN does not stand for anything. I’m just paying homage to a famous outlier.

CAIN = FB – (9.34 x HR)

To explain, the Fangraphs Glossary says that the league-average fly ball rate is “~9-10% depending on the year”. In fact, of the 91 qualified pitchers in Fangraphs database for 2013, the average HR/FB ratio is 10.7 percent. So there are 9.34 fly balls for every homer. So we can say that for most pitchers, if they had ten homers at this point in the season, they would have about 93.4 fly balls.  Ten homers and 93.4 fly balls would give you a CAIN of exactly 0. Make sense?

Now for what you came here for. Here are the top ten in CAIN this year:

Note that I’m not saying any players might actually be able to sustain their CAIN, I just think it’s an interesting little tidbit, and perhaps a nice follow on to Dave Cameron’s article.

Name Team IP HR FB CAIN HR/FB
Eric Stults Padres 133 8 163 88.3 4.90%
Jhoulys Chacin Rockies 120 3 106 78 2.80%
Bartolo Colon Athletics 135.2 9 161 76.9 5.60%
Travis Wood Cubs 128.1 10 159 65.6 6.30%
Adam Wainwright Cardinals 154.2 6 113 57 5.30%
Bud Norris Astros 119.2 10 150 56.6 6.70%
Lance Lynn Cardinals 122 7 121 55.6 5.80%
Matt Moore Rays 116.1 8 130 55.3 6.20%
Derek Holland Rangers 133.2 9 137 52.9 6.60%
Clayton Kershaw Dodgers 152.1 9 136 51.9 6.60%

And Jhoulys Chacin is not #1. It turns out that Eric Stults is in fact benefiting more from his HR/FB rate outlier this year. Of course, that’s partially happening in Petco. Petco is not Coors.

Name Team IP HR FB CAIN HR/FB
Joe Blanton Angels 116 24 133 -91.2 18.0%
Roberto Hernandez Rays 113.1 18 91 -77.1 19.8%
Jason Marquis Padres 117.2 18 99 -69.1 18.2%
CC Sabathia Yankees 142 23 150 -64.8 15.3%
Chris Tillman Orioles 119.2 21 135 -61.1 15.6%
Ryan Dempster Red Sox 115.2 20 130 -56.8 15.4%
R.A. Dickey Blue Jays 134.2 23 163 -51.8 14.1%
Jeremy Guthrie Royals 126.2 22 155 -50.5 14.2%
Hisashi Iwakuma Mariners 138.1 21 146 -50.1 14.4%
Lucas Harrell Astros 112 15 96 -44.1 15.6%

Poor Joe Blanton. His peripherals aren’t that bad this year. But he’s been posting some pretty high HR/FB rates for the last five years or so. I’ll leave it to someone else to puzzle that out.

After doing this analysis I wanted to know about exceptional seasons in the “UZR era” for pitchers’ CAINs. I am continuing to use 9.34 as the FB/HR value, not adjusted for year. If I was being very scientific I would probably break that constant out for league AND year, but I’m lazy and unpaid. Anyway, here, unsurprisingly, is Matt Cain:

Season Name Team IP HR FB HR/FB CAIN
2011 Matt Cain Giants 221.2 9 246 3.70% 161.94
2007 Chris Young Padres 173 10 243 4.10% 149.6
2002 Jarrod Washburn Angels 206 19 317 6.00% 139.54
2009 Zack Greinke Royals 229.1 11 242 4.50% 139.26
2002 Mark Redman Tigers 203 15 273 5.50% 132.9
2011 Jered Weaver Angels 235.2 20 319 6.30% 132.2
2010 Anibal Sanchez Marlins 195 10 222 4.50% 128.6
2010 Livan Hernandez Nationals 211.2 16 278 5.80% 128.56
2010 Jason Vargas Mariners 192.2 18 295 6.10% 126.88
2007 Matt Cain Giants 200 14 255 5.50% 124.24

So in summary, CAIN is a nice little tool if you are interested in seeing just how much a HR/FB rate is affecting a pitcher’s performance. If anyone can think of a better acronym, like one that actually is an acronym, please leave a comment.


The New Golden Age of Cuban Baseball in MLB

Editor’s note: This piece was removed at the request of the author.


The New John Lackey

Earlier this season, while writing a piece on Rick Porcello’s breakout, I noticed he was mixing a certain combination of skills that seemed both interesting and valuable. He was striking out more than 7 hitter per 9, walking fewer than 2, and also inducing a ground ball rate above 50%. The story with Porcello was the increase in strikeouts, but it also put him in some excellent company. Going back to 2002 (when GB% becomes available) the list of qualifying pitchers to meet those criteria is short and impressive. Roy Halladay (4), Chris Carpenter (3), and Cole Hamels (1). Porcello is doing it this year and so is John Lackey. And Lackey’s story might be the most interesting.

(Note: K% and BB% tell a similar story, the cut-offs are just harder to express and are not the real focus of the article.)

Porcello’s key was an improved changeup and new curveball that induced more strikeouts, but Lackey has actually improved his numbers in all three categories pretty dramatically. Even if we accept that Lackey’s 2011 numbers were depressed due to the coming injury, if you take his career numbers and place them next to his 2013 season, the change is quite interesting.

Season IP K/9 BB/9 HR/9 BABIP GB% HR/FB ERA FIP xFIP WAR
2002-2012 1876 7.03 2.73 0.91 0.309 43.20% 9.10% 4.10 3.91 4.08 34.7
2013 106 8.44 1.94 1.18 0.290 50.80% 14.70% 2.95 3.64 3.18 2.1

At 32, Lackey is getting better. Certainly he had some excellent seasons from 2005-2007 when he exceeded 5.0 WAR for three straight years, but this performance is quite something. He’s getting more strikeouts than in all but one year of his career and he’s posting the best walk rate and highest ground ball rate in his career by substantial margins. The results are better if you look at ERA, FIP, and xFIP as he’s never had a lower ERA or xFIP and only bested this year’s FIP during that run from 2005-2007.

Lackey is having a career renaissance. But the interesting thing on the surface is that Lackey’s velocity isn’t much different and his pitch selection isn’t either. He’s got the same repertoire and it seems to be of the same quality. But looks can be deceiving.

A word is needed up front regarding pitch classification. Pitch F/X seems to think he’s throwing a different mix of pitches, but it’s actually just classifying them differently. You can see in the two charts below, from 2011 and 2013, that the velocity and horizontal movements are quite similar, but the pitches are being called something different.

Lackey Velocity, H-Movement in 2011

Lackey Velocity, H-Movement in 2013

His velocity isn’t much different from his rough 2011 campaign and the location of the pitches aren’t terribly different either. He’s routinely working low and away to both RHH and LHH this year just like he did in 2011.

This doesn’t seem to be about stuff or location, and this isn’t an increase in performance driven by BABIP because the indicators I’m looking at are entirely within the pitcher’s control This is an analysis about an increase in strikeouts, a decrease in walks, and an improvement in GB%. Lackey is getting better results because he’s doing well in those categories. Yet he’s not throwing harder and he’s not throwing much differently than he did in one of his worst years.

Well, not so fast. There is one key difference that I’ve been able to find and I think it can explain why Lackey is doing so much better. Let me start by pointing out some even more interesting tidbits. First, Lackey is throwing fewer pitches in the zone overall while inducing much less contract overall with virtually the same swing percentage as in 2011. His first-pitch strikes are up but are not much different than his career norms. Lackey is getting more swings and misses, which could point to the strikeout increase. But Lackey is also hitting the zone less often, which means a good portion of the walk decline is coming from batters swinging at pitches outside the zone. That all makes sense to some degree.

Lackey is getting more swings and misses via pitches out of the zone, so his strikeouts are up and his walks are down. But the increase in GB% is the aspect about which I was most curious and it fits in with what I believe is cause the strikeout and walk transformation.

Lackey isn’t throwing harder, the ball isn’t moving more horizontally, and the general location of his pitches haven’t changed. What has changed is the vertical movement on a subset of his pitches. It’s hard to notice when you’re looking at season averages, but graphically it is quite striking. In certain situations, Lackey throws a variation of his fastball and cut fastball that moves with the same velocity and horizontal movement as normal, but with more vertical break. It’s almost like having another pitch that Pitch F/X doesn’t understand. Take a look and remember he’s thrown fewer pitches overall in 2013, so the cluster stands out even more:

Lackey Velocity, V-Movement in 2011

Lackey Velocity, V-Movement in 2013

I’m not a leading expert on Pitch F/X or pitching in general, but this is the kind of thing that catches my attention. Lackey’s pitches don’t seem different overall, but there is a group of them that are acting differently. The increased downward break is likely to blame for more ground balls and I can certainly imagine it’s part of what’s driving the strikeouts via hitters swinging and missing on pitches they didn’t except to drop so much.

In analyzing this particular cluster of fastballs, the results were striking. Of 86 such pitches, 27 were called balls, 17 were called strikes, 19 were fouled off, 10 were swung at and missed, 3 were hit for singles, and 10 resulted in ground outs. When Lackey throws this pitch, the worst thing that happens is a single and even those are pretty rare. If we consider this pitch in context, during at bats in which he threw one of these pitches, he walked 14 hitters, struck out 28, induced 3 line outs, got 33 groundouts, and allowed just eight hits. All singles.

I haven’t watched many Lackey starts, so Red Sox fans might be able to speak more confidently on the subject, but it appears as if Lackey has turned himself into one of these special pitchers who can maintain high K%, low BB%, and a high GB%. We only have a couple of months of data, so this could still vanish from in front of our eyes.

My interest in Lackey, Porcello, and these pitchers at large comes from my belief in DIPS theory, but also a more general belief that limiting walks and extra base hits will help prevent runs and a pitcher can play a role in limiting extra base hits even if some of it is out of their control. If you’re inducing ground balls when you allow contact, you’re not going to get hurt nearly as often. Whether you like metrics like SIERA for this, or simply like to read FIP alongside GB%, it makes good sense.

John Lackey is becoming one of those guys. Along with Porcello (and Fister and Felix who have been hovering around these somewhat arbitrary cutoffs), he is headed for the club occupied only by Doc, Carpenter, and Hamels. I can’t tell you how often this happened prior to 2002, but the fact that only one of the eight recorded seasons is anything short of great makes me think this is worth tracking. The specific numbers aren’t hugely important, but they allowed me to discover the new and improved John Lackey.

He gets more strikeouts, allows fewer walks, and induces more ground balls. He’s had a bit of a rough stretch since his peak five years ago, but with this new approach, and occasionally different fastball, John Lackey is pitching himself back into the upper reaches of the American League.


Plate Discipline Correlations, 2008-2013

Plate Discipline Correlations, 2008-2013 

In fall 2008 FanGraphs was kind enough to release new plate-discipline metrics, including first-pitch strike percentage (F-Strike %), outside-the-zone swing rate (O-Swing %), and inside-the-zone swing rate (Z-Swing %).  At the time, Eric Seidman was even kinder when he investigated the correlation of these plate-discipline statistics with standard pitcher metrics like WHIP, FIP, BB/9, and K/9. Very thoughtful indeed.

Now we have another 4.5 years of plate discipline data, compiled by Pitch f/x rather than Baseball Info Solutions. It may be worthwhile to see how these numbers compare with Seidman’s, as well as add a measure of uncertainty to the correlations. It is possible for two factors to have a strong relationship, but because of small sample sizes or other forms of variability, the correlation value may not be as precise a measure as a high R-value may suggest.

Bootstrapping

Correlation coefficients, which fall between -1 and 1, allow us to measure the strength of linear dependence between two variables, such as O-Swing % and K %. We can use bootstrapping techniques to obtain 95% confidence intervals for these correlation coefficients. Calculating confidence intervals for correlations adds a measure of uncertainty to the process—narrow intervals indicate we can have greater confidence that the R-value we obtain represents the true correlation between the two metrics.

Bootstrapping is a statistical technique in which we resample our current sample, in this case 500 times. This repeated process allows us to assign measures of accuracy to sample estimates, such as medians, means, or correlation coefficients. For our purposes here, it is only important to note that we can be 95% confident that the true R-value lies between the intervals. If the interval includes 0, meaning absolutely no correlation, we can conclude that there is not enough evidence to indicate any relationship between the two variables.

First Strike %

These correspond well enough to the values obtained by Seidman, with one exception worth noting. While he used K/9 and BB/9 to correlate with F-Strike %, here we examine the correlation with strike and base on balls percentages. Our correlation coefficient is similar in magnitude at .24 versus .19, but its wide confidence interval approaches the null value and suggests the estimate is not very precise. This is worth noting, especially considering that BB % appears to have such a strong correlation with F-Strike % of -.79 with relatively narrow confidence intervals. Seidman observed a similar pattern—pitchers who get into an 0-1 count are more prone to not walking batters than striking them out.

First Strike %

       R-Value                    (95% CI)

K%

0.24

(.024, .455)

BB%

-0.72

(-.848, -.604)

WHIP

-0.52

(-.649, -.376)

FIP

-0.41

(-.576, -.237)


O-Swing %

O-Swing % is the percentage of pitches a pitcher pitched outside the zone but still generated a swinging strike. Think anyone facing Pablo Sandoval. Here we again see relatively moderate correlations with relatively tight confidence intervals ranging from 0.30 to 0.19. Pitchers who induce swings at pitches outside the zone may be especially tricky for hitters to do damage against. So far this season Adam Wainwright and Matt Harvey are both in the top three in O-Swing %, and top two in both WHIP and FIP.

O-Swing %

   R-Value        (95% CI)

K%

0.39

(.274, .548)

BB%

-0.44

(-.637, -.254)

WHIP

-0.50

(-.677, -.317)

FIP

-0.45

(-.650, -.283)

Z-Swing %

We can see from the results below that Z-Swing %, the rate of inducing swings at pitches in the zone, bears little relationship with any of these metrics. Seidman’s analysis showed that the correlations were negligible at best. The confidence intervals for all of these measure metrics include 0, meaning that we cannot be 95% confident that there is any relationship present. A quick glance at the leaderboards shows that Ian Kennedy and Miguel Gonzalez are near the top of the list this season, and these guys aren’t exactly shoving.

Z-Swing %

   R-Value        (95% CI)

K%

-0.17

(-.370, .035)

BB%

-0.17

(-.381, .048)

WHIP

-0.09

(-.276, .111)

FIP

0.10

(-0.09, .286)

All data courtesy of FanGraphs.

 Because I’m a believer in open data, you can find my R code here.


The Luckiest and Unluckiest Pitchers So Far in 2013

Pitching is a fascinating aspect of the game of baseball. Talent is required, but a lot of the results that come after the ball leaves the pitcher’s hand are luck. Defense plays an important role as well. Rosters are not constructed in the same way, so defense isn’t uniform accross the league. Many pitchers that don’t miss many bats need the help of the defense behind them in order to get solid results. Other pitchers, such as Matt Harvey, can rely on themselves a little more due to their ability to strike out more batters. I decided to look at which pitchers have been fortunate in 2013 and the ones whose fate has been a little less positive. I took xFIP and subtracted ERA from it to get my data. The range was from 2.1 to -1.85.

Luckiest

Jeff LockeJ.P. Breen has a good post up about how fortunate Locke has been to pitch with the Pittsburgh Pirates defense behind him. He had the largest gap in xFIP and ERA of anyone in the 2013 sample at 2.10. His ERA currently sits at 2.15 while xFIP sees him at 4.25. While he does pitch in front of a very good defense he has also been very lucky regarding the home-run ball. His HR/FB rate currently sits at 6.7%. I’d bet on that regressing to at least the 10% xFIP uses in the second half. Luckily for him, the defense isn’t going anywhere.

Travis Wood – Wood essentially came out of career purgatory for the 2013 campaign. After spending most of his career being yo-yoed back and forth between AAA and the bigs he put together a solid first half. Currently his xFIP is 1.61 points higher than his ERA. Like Locke, Wood also has seen his HR/FB rate decrease dramatically this season to 5.7%. While that looks extremely low he posted  HR/FB percentages of 6.3% and 6.7% in 2010 and 2011 before it jumped to 12.7% last season. I’m not quite sure what to make of this. I lean towards his home-run rate settling in closer to 12.7% than I do the rates in other seasons. He might have a knack for keeping the ball in the park though. The Cubs defense is actually quite good according to their UZR so that also helps Wood keep his stats much lower than his peripherals. I’m interested to see how he fares in the 2nd half.

Mike Leake – Leake’s put together another Mike Leake-type season. His ERA is currently at 2.69, which will definitely regress to his career norms. Unlike the two pitchers above we have plenty of Major League data on Leake. His LOB% is at a career high along with a HR/FB that would be the best of his career. Leake’s 2013 campaign looks pretty similar to his 2011 except he is striking out less batters while also getting a few more fly balls. Leake is hurt by his home park and the Great American’s effect on his ability to keep balls in the yard is pretty incredible. His HR/FB rate at home is 5% higher than it is away, but this season the split is nearly 13 percentage points. His 4.6% HR/FB rate away from home this year should regress to settle a little closer to his career split of 11.0%.

Unluckiest

I won’t go straight down the list of the unluckiest because the first few names are, to put it mildly, not very good pitchers currently. Those pitchers were: Wade Davis, Joe Blanton, and Edinson Volquez.

Rick Porcello – Porcello checked in at number 3 on the unluckiest pitchers. His xFIP sits at 3.07 compared to his 4.80 ERA. He’s seemingly made a habit out of his peripherals constantly being much better than the stats that show in their traditional form. It’s no secret that the Tigers are not very good on defense. Porcello has shown some signs of life this season with his K% trending up while his BB% is trending down a tad. He’s gotten a little unlucky with his HR/FB% this season (15.7%) compared with his career average coming into 2013 (11.4%). Porcello does get a ton of groundballs though, and it’s likely we’ll always consider him “unlucky” as long as he has the Tigers defense behind him.

Edwin Jackson – Jackson is an interesting case to me. Every year I’ll watch him have a few electric games and expect him to finally make a jump into a more consistent front of the rotation of the starter, but it never happens. Jackson is simply who he is at this point. This season his xFIP is 3.74 compared to his ERA of 5.11. The first thing I noticed was his LOB%; currently at 62.3% this season compared with 70.8% in his career. His batted-ball profile is very strange. He’s actually getting more groundballs than any time in his career. He has come around of late, so maybe his luck is turning more in his favor.

Matt Cain – Cain’s struggles have been well documented this season, by many people including Fangraphs’ own Eno Sarris. Cain’s ERA is currently1.16 points worse than his xFIP. Unlike Porcello, Cain has made a career out of always outperforming his peripheral stats. Eno’s piece can explain the reasoning on why 2013 has been somewhat of a bust for Cain infinitely better than I would be able to. The Giants continue to insist that Cain is healthy, so unless something changes it’s safe to assume they’ll keep running him out there every fifth day. Hopefully adjustments can be made to get back his career norms.


My Brewers Romance

Rock and Roll as a popular art medium is dead.
So too are the 2013 Milwaukee Brewers.
So it seemed apropos to commemorate the first half of the 2013 season with a hybrid revieweulogy of one of my favorite bands of all time that also died (well, broke up) this year, My Chemical Romance (who also just so happens to be almost obsessively focused on death and dying).
If you are one of the 21 billion people on the planet right now that listen to music, chances are it is about as far removed from the 90s as roller-blading and frosted tips. No, chances are, you are listening to either a. Hip-Hop/Rap (Rihanna, Kanye, 2Chainz) b. Indie-Electronica (MGMT, Gotye) c. Folk music (Anything featuring a Mandolin or Banjo, i.e. every song on alternative radio) or d. Top-40 Country (ironically enough, with the recent discovery of the overdrive effect by country artists, probably the closest thing to 90’s rock going right now).
Put it this way, if you’re a band that features heavy, down-tuned guitars and gravelly voices, you’re about as popular as a bowl of pudding at the annual jello convention.
And if you are a My Chemical Romance fan it is even worse. Of all the bands that I love, MCR is the one band that I can’t find anyone, anyone at all, to appreciate fully with me. And this is something that I really struggle to understand; mostly from the simple fact that they are just so damn good.
The hooks are insane, the guitar work is precise and ultra-creative, and the lyrics are almost always well-constructed and compelling. I am fascinated by the lack of interest in others when I bring up the band or try to get friends (I even target people who I know are huge David Bowie and Queen fans, of which MCR is heavily influenced and eerily similar in style) to listen. My two main theories involve the fact that a.) MCR just missed the 90’s and therefore there is a lack of nostalgic enjoyment from my demographic, and b.) that the band dressed as “vampire kids” in their formative years as a band (again a phase my demographic missed by a couple of years and never really understood).
Nevertheless, My Chemical Romance, along with Pop-Rock in general is dead and mostly forgotten. And that sucks.
Which brings us directly to the current incarnation of the Milwaukee Brewers.
And so in honor of the break up of My Chemical Romance and the early demise of the 2013 Milwaukee Brewers, I present to you the 10 most poignant My Chemical Romance lyrics that sum up the first half of the Milwaukee Brewers season…
1. “I’m not okay / I’m not okay / well I’m not okay / I’m not O-fucking-kay”
Let’s get the most obvious one out of the way first. The Brewers are most definitely not O-fucking-kay this year. At 38-56 they have the fourth worst record in all of baseball. Their minus-65 in run differential is 3rd worst in baseball and at 19.5 games out of first place; the season is all but lost even at the halfway point.
How did we get here?
Poor planning with the starting pitching staff for one. The decision to rely on smoke and mirrors guys from the second half of last year was a fatal flaw before the season even began. Without the late addition of  Kyle Lohse, we may have been in an even deeper hole at the All-Star break. Marco Estrada has flamed out due to injuries, Mark Rogers hasn’t even pitched an inning in the bigs, and the last news on Mike Fiers was that he had moved to Florida, grown out his beard and become friends with someone named, “Wilson.”
Injuries have also decimated the team, as reported by the Journal Sentinel this week, the meat of the Brewers lineup: Braun, Ramirez and Corey Hart combined for 98 home runs last year and have just 14 between the three of them at the break. Not a winning combination.
It’s probably time for the Crew to admit they are not okay and begin to take some action to rebuild/reboot for the future.
{As an aside, despite the fact that this is one of their most popular songs, it has always been my favorite. In life, as in baseball, we are conditioned from early childhood to always tell everyone that we are ok no matter what we are going through. When facing loss, pain, rejection, an abomination of a baseball season, we are always expected to “man up” and tell the world that we are fine. (I guarantee you that somewhere at this very moment Ron Roenicke is telling some reporter that the Brewers are going to be a-ok, even though they are obviously not). Athletes are taught to never show they are hurt and act “ok” even after suffering a brutal injury. Everyone is taught to go to work, hold your head up and smile the weekend after a breakup or a funeral. This song is innately therapeutic in its refutation of the “I’m not ok” moniker. Sometimes we are not ok and we just want to scream it at the world. MCR gave us an outlet for that. And that is pretty OK.}
2. “And the world is ugly / But you’re beautiful to me”
 
This line goes out to my favorite player, (as you already know) Carlos Gomez. In all of the ugliness surrounding the Brewers this season, Gomez has shone brighter than just about any star in the League. In fact at 5.7 Wins Above Replacement, he leads the entire National League in that category. His slash line of .295/.337/.533 and peripherals 14 homers, 21 steals, 51 runs, and 45 RBI don’t even come close the telling the whole story of the “Golden Retriever.”
He is one of, if not the best defensive center fielder in the game, robbing FOUR potential home runs this half year alone. Advanced metrics list his defense as saving 24 runs for the team above an average league center fielder. And even that doesn’t tell the whole story. Gomez continues to exude a charm and charisma that makes sports worth watching. He wears his love of the game on his sleeve and makes you hold your breath with every dive and every wholly unnecessary mega-rounding of first. But he makes the game of baseball that much more interesting. There are a litany of boring stars that “respect the game” like Ryan Braun (since 2010) and Albert Pujols. But there is only one Carlos Gomez and he is beautiful to me.
3. “Without, without a sound / And I wish you away / Without a sound / And I wish you away”
 
To Yuni B. After pushing Brewer fans to the brink of insanity in 2011 with his terrible defense and miniscule On Base Percentage, Yuni somehow wormed his way back into Milwaukee. Did he kidnap Doug Melvin’s granddaughter and hold her for ransom? Did he accidentally come as a part of the deal for Jean Segura last year? Did he just keep his jersey from 2011 and show up on the bench day after day until a confused and mildly apathetic Roenicke finally just subbed him in? Is he even getting paid? Or is he just a Yoshi-looking, Milton from Office Space, only he always keeps smiling that Lego-man smile so that you can never truly get mad at him?
Regardless, it’s time for Yuni B. to go before he up and burns the place down.
4. “You’ll never make me leave / I wear this on my sleeve / Give me a reason to believe”
 
Rickie Weeks – you gave us a reason to believe. After listening to countless hours of impatient/ignorant/jerk Brewer fans tearing Weeks down through his struggles and living through the subsequent and audaciously ludicrous Scooter Gennett call up, this is what I had to say at the beginning of June.
Since I wrote that piece, here is what Weeks has done over the last 28 games:
Average
OBP
OPS
Home Runs
RBI
Runs
.290
.389
.920
6
11
13
Seriously, find me another second baseman not named Dustin Pedroia that sports a .390 On Base Percentage. Then, grow up!
No matter how many Brewers fans inexplicably hate Weeks, I hope they will never make him leave. Sometimes we only learn to appreciate things after they are gone, and I hope it doesn’t have to come to that anytime soon. But what I do know is that you can line up all the Scooter Gennett’s in the world if you feel like it, but ‘Ol Richard Weeks sure ain’t leaving without a fight.
5. “Pull the plug. But I’d like to learn your name. And holding on, well I hope you do the same”
 
This lyric is for Logan Schafer; really the only intriguing position player from our pitiful Minor League system.  The Crew is truly now paying the bill for 2008 and 2011. Young players like Brett Lawrie, Alcides Escobar, Lorenzo Cain and Michael Brantley would hypothetically be starting for the Crew right now had it not been for the trades to acquire C.C. Sabathia, Zack Greinke, and Shawn Marcum for short periods of time. Now, these trades were worth it every day of the week and twice on Sunday, but they have left the Brewers farm system looking like the one run by Uncle Owen and Aunt Berue after the imperial garrison stopped by looking for a couple of droids.
Players like the aforementioned Gennett, Caleb Gindl, Khris (with an h) Davis, and Sean “Game of Thrones” Halton, provide not one iota of long-term excitement. It is truly and tragically a group of AAAA journeyman that will amount to little more than a late night pot of stale coffee in the Show.
However, Schafer has shown a bit of a spark in his time in the majors. After a pretty dismal start to the season, Schafer has really picked it up recently. His slash line in July is .306/.346/.571 with 2 Home Runs and 2 Steals. Combined with some decent defense, highlighted by a stellar diving catch against the Marlins, Schafer looks like he may have some staying power if the Brewers decide to trade Aoki. I for one hope he stays long enough so others can get to learn his name over time as well.
6. “To carry on / We’ll carry on / And though you’re dead and gone believe me / Your memory will carry on”
 
“I miss him.” I said to myself on Tuesday as I was watching the All-Star game. Of course I said “eehm” for him because I like to talk like a sportscaster, but nevertheless. I was talking to myself about Prince Fielder; as he belly-flopped into third base with a triple.
It’s been a year and a half now and I’m still not over it. Why the Brewers consistently say they can’t pony up the dough for a super-duper star yet incinerate the equivalent annual dollars on a sum of middle reliever’s and washed up veteran starters that provide replacement level service is completely baffling/frustrating. Having Prince in the middle of the lineup for 162 games a year changes the entire complexion of a team, not only for the production at the plate but the mere psychology of the fact that you are going to have the leader of your team on the field running out every ground ball for 162 games a year. Prince was my favorite player and I wish he was still here; but believe me his memory will carry on.
7. “Big Willie Style’s all in it / Gettin Jiggy Wit It”
 
Wait? This isn’t an MCR lyric? It’s from Will Smith’s 1998 hit aptly titled, Gettin Jiggy Wit It?
Ok fine. But I still want to use it for the suddenly ferocious “Big Wily Style” Peralta.
Over his last three starts, Peralta has been nothing short of dominant. Over his last 21 1/3 innings, Peralta has allowed only one earned run and struck out 19 batters. His string of good performances actually extends back over his last five starts suggesting there may be some lasting power to what he is doing. Although I have been skeptical of Big Wily Style most of the last two years, I am really starting to like what I see. At 24 years old, there is plenty of room for improvement and if he can keep his head on straight and avoid “right handed Manny Para syndrome” the sky’s the limit for this dude. Now if he can just learn the feet shuffle-shoulder shrug dance from the video, I’ll have no problem with a full Big Wily endorsement.
8. “Do you remember that day when we met / you told me this gets harder / well it did”
 
-To George H.W. Roenicke.
Scene from the Brewers locker room last week:
 
Reporter: So Ron, after being handed the keys to the corvette in 2011, would you say life has gotten a bit harder recently?
G.H.W Roenicke: Well now, Tom, hold your horses. Now, I got a plan, see. A three point plan where we’re gonna get Brauny and Gomey and Aoki-y. We’re gonna gather are re-sources and stomp that Sa-da..er…those Cardinals right out.
Reporter 2: But you’re really piling up the losses Ron. Do you think you have a chance?
Roenicke: Hehehe. Well, it’s been tough…its’ been tough! But how many losses we’ve got? 58? 58. It’s scary…it’s scary.
Reporter 1: Ron, would you say that you are ready to throw in the towel for the year even though it is still only the halfway point?
Roenicke: Not gonna do it.
(Editor’s note – If you understood why this section is funny…bless your soul. If not, better not to try…just move on).
9.  “I’ve really been on a bender and it shows.”
 
Who else can this one go to, but Yovani Gallardo.
Rumors have swirled for a while now that Yo is a big proponent of Milwaukee’s local watering holes and that appeared to substantiate this spring when he was busted for drunk driving in Wauwatosa. Now nobody really knows if his Midwest-Amanda Bynes impersonation has anything to do with his awful performance this year except him, but one has to wonder.
Either way, Gallardo has pretty much disappointed me for the last time. After his brilliant performance against the Diamondbacks in the NLDS in 2011, I was certain that he was going to light the world on fire in 2012, even going so far as to lay a $50 futures bet down with my friend Weasel on Gallardo winning the Cy Young that year. Of course that never happened. Yovani did what he always does: threw a ton of pitches, struck out a ton of guys, walked a ton of guys and exited games far too early, far too often.
We always hoped that Yo would turn into the Verlander’s and Halladay’s of the league – with an ERA in the high two’s and a WHIP in the low ones. But he never evolved past the high three’s in ERA and high ones in WHIP. It might finally be time to face reality and realize that Yovani will never be the pitcher we hoped he would be.  If we can get a Tyler Skaggs or a Martin Perez for him, we should get it done ASAP perhaps even before old Yo can finish his next shot of Cuervo.
10. “Synthetic animals like me never have a home” 

It will be interesting to see where Brewers fans land on Ryan Braun when all of the smoke clears with the Biogenesis investigation. My friend Greg already refers to Braun as the “cheating loser.” Others I know continue to insist in his defense. And yet others are apathetic to the whole PED situation in general.  I suppose I continue to fall under the third category. I really just don’t care. If he gets caught, he deserves to be punished. If he doesn’t, then good for him; he worked the system. I just want to watch baseball and enjoy my leisure time. Generally, my leisure time is more improved when the teams I like are winning. And Braun helps the team I like win. So would I rather have him around than not have him around even if he turns out to be a “cheating loser”?

Yes.

11. “Hello Angel, tell me where are you / Tell me where we go from here”
 
So, where do we go from here?
It is fairly obvious that the Brewers are left with only two options going forward and to be totally honest, I would be fine with either one.
1. Trade every movable piece you have for prospects and build around Braun, Lucroy, Segura, Gomez and the influx of new prospects. This means you trade Ramirez, Weeks, K-rod, Axford, Gallardo, Lohse, Aoki, Gonzalez, Henderson. Basically hit the reset button and gather as many unknown resources as you possibly can, then spend the next two to three years throwing them against the wall until you get a few to stick. The core-four (TM New York Yankees) will keep the attendance going and hopefully morph into a quality team in three years. I could be easily talked into this option.
2.  Do absolutely nothing and chalk this year up to bad luck. If the Brewers do nothing except re-sign Corey Hart in the offseason ,next year’s lineup would look like this:
Aoki – RF
Segura –SS
Braun –LF
Ramirez – 3B
Hart – 1B
Gomez –CF
Lucroy – C
Weeks -2B
Pitcher
And the staff:
Gallardo
Lohse
Peralta
Estrada
Gorzelanny
On paper, that is a pretty good team. Assuming Big Wil continues his upward trend, Gallardo gets his head out of his ass, and maybe you make one move for a free-agent pitcher, it could be a REALLY good team.  So, I could also very easily be talked into this option. Hmmm.
So where do we go from here? I guess I really don’t know. I suppose I’ll leave that one up to the pros (you know, seeing as my opinion doesn’t really matter in the slightest anyway).
The only thing that I really know is this: Go out and buy some My Chemical Romance records; because unlike your favorite team’s sports seasons, good music never, ever dies. And if you hold on to hope for anything long enough…well, in the words of MCR:
“If you stay I will either wait all night / Or until my heart explodes / How long? / ‘Til we find our way in the dark and out of harm”
 
It gets better Brewer fans. It has to.

Josh Willingham: Selective Hitter?

Josh Willingham hasn’t been very good this year. He’s on pace to put up his worst full-season WAR mark. I’m secretly glad about this because I’ve never really liked Josh Willingham as a player. (Well, I guess it isn’t a secret anymore.)

One of the reasons Willingham has been considered a good player is his selectivity at the plate. He’s certainly a patient hitter: this year, he’s swung at a lower percentage of pitches than any other qualified batter. But has he been selective?

One simple selectivity approximator is O-Swing%. The less pitches a hitter swings at outside the strike zone, the better he probably is at identifying where pitches will end up and which ones not to swing at. And sure enough, Willingham is third-best by this measure for 2013.

But O-Swing% isn’t the best way to measure selectivity. After all, an infinitely unselective batter could take every single pitch he saw and record a perfect 0.00000 O-Swing% — but a 0.00000 batting average as well. Last year, Carson Cistulli noticed this and constructed a leaderboard of hitters with the greatest discrepancies between their O-Swing and Z-Swing rates, in order to highlight batters who swing at lots of hittable pitches but lay off balls. And guess what? Josh Willingham proved to be baseball’s 8th-most selective hitter.

So there’s no doubt, then, that Josh Willingham is selective? Well, it depends how you define “selective”. First, we should notice that Willingham ranks in the bottom 20 of Z-Swing% this year — which means that he made it onto Cistulli’s leaderboard not because he swung at a lot of pitches in the zone, but just on the strength of his amazing ability to lay off pitches out of the strike zone. This is a useful skill — it leads to a high walk rate — but the low Z-Swing% is concerning.

There are two possibilities that I can make out: either Josh Willingham is only swinging at pitches he likes in the zone, but taking “bad” strikes, which would make him a true selective hitter; or he’s just indiscriminately taking too many pitches, kind of like that hypothetical 0.00000 O-Swing% guy.

Which is it?

Here are the pitches swung at by Josh Willingham in 2013, courtesy of Texas Leaguers:

Josh Willingham taken pitches, 2013

If we just look at pitches in the strike zone, it looks to me like he’s avoiding pitches down and in, as well as pitches down and away. So there’s a pattern, then. That’s a good sign.

Now let’s take a look at his career swing rates, this time via Baseball Prospectus:

Looks similar, right? So Willingham must know what he’s doing. Throughout his career, he’s made sure to lay off not just balls, but also pitches in the bottom-left and bottom-right parts of the strike zone. Those must be the kinds of pitches he’s bad at hitting.

Here’s his BABIP chart:

Well, that changes things, doesn’t it? He seems to be pretty good at hitting those down-and-in pitches he selects against. Willingham appears to have a good eye, but it doesn’t look like he’s choosing his pitches wisely.

But maybe BABIP isn’t the right thing to look at. After all, it leaves home runs and whiffs out of the equation. So here’s the same chart, but using TAv this time (TAv is basically Baseball Prospectus’s version of wOBA; wOBA is better, though):

This seems to justify him swinging at those high, inside pitches, but it still doesn’t explain him laying off pitches down and in, or swinging at pitches up and away.

So I think we can tentatively conclude that Josh Willingham isn’t as good at selecting pitches to swing at as one might think. This analysis is incomplete, of course, because there are a whole lot of factors — pitch type, count, base-out states, etc. — which I haven’t taken into consideration. I also haven’t looked at other hitters’ data — maybe Willingham is actually good at this compared to other major league hitters.

Why not take a look at another hitter? Say, Marco Scutaro. Here’s his Swing% chart:

And TAv:

I would say Scutaro’s selectivity is a little better. He’s good at hitting pitches inside and he knows it, so he mostly swings at pitches inside. Now, he’s inexplicably not very good at hitting pitches right down the middle, but Scutaro probably figures he should swing at those anyway because, well, they’re easy to hit, in theory.

Marco Scutaro is more selective than Josh Willingham. Intuitively, that seems right, as it would explain (to some degree) Scutaro’s league-best SwStr%.

Conclusion

I guess the moral of the story is don’t trust O-Swing% and Z-Swing% as selectivity indicators. And PITCHf/x data is fun to look at.