Archive for May, 2010

Carlos Marmol Dares You to Hit Him

At age 23, Carlos Marmol made his major league début with the Cubs as a starter.  He was mostly dreadful in 2006, finishing with an ERA over 6.00.  Since then, he’s settled in as the setup man and now the closer for the Cubs and for the most part has been very good.  Since 2007, he’s averaged over 11 strikeouts per nine innings in each season, finishing in the top ten each season; this year, his strikeout numbers have been absolutely stupid.  Here’s a summary of Marmol’s rate statistics for his career, followed by his totals:

Season K/9 BB/9 HR/9 BABIP LOB% GB% HR/FB FIP xFIP
2006 6.90 6.90 1.64 0.265 70.2% 28.9% 11.8% 6.47 6.22
2007 12.46 4.54 0.39 0.276 91.0% 31.3% 3.9% 2.72 3.67
2008 11.75 4.23 1.03 0.185 78.1% 34.6% 9.9% 3.62 3.71
2009 11.31 7.91 0.24 0.262 77.7% 35.8% 2.6% 4.06 5.13
2010 17.47 5.56 0.40 0.376 90.9% 34.3% 7.7% 2.06 2.27

Season ERA SV / BS IP TBF H HR BB IBB HBP SO H/9
2006 6.08 0 / 0 77.0 356 71 14 59 2 5 59 8.3
2007 1.43 1 / 1 69.1 285 41 3 35 3 4 96 5.3
2008 2.68 7 / 2 87.1 348 40 10 41 3 6 114 4.1
2009 3.41 15 / 4 74.0 335 43 2 65 3 12 93 5.2
2010 1.59 9 / 2 22.2 96 13 1 14 0 3 44 5.3

Marmol has always had issues throwing strikes, particularly in 2009.  He got away with it (mostly) by not allowing home runs and being a little lucky.  What really strikes me though is that with such high strikeout and walk rates, there is a lot of walking at the end of plate appearances against Marmol (either to first base or back to the dugout).

A couple of weeks ago, Dave A. noted that Brandon Morrow, Clayton Kershaw, and Rich Harden lead starting pitchers in keeping the ball out of play via walks, strikeouts, and hit batters.  They had “Ball-Not-In-Play” percentages in the lows 40s.  Check out Marmol’s career, and in particular, his start to 2010:

Season Team TBF Ball-Not-In-Play
2006 Cubs 356 125 35.1%
2007 Cubs 285 138 48.4%
2008 Cubs 348 164 47.1%
2009 Cubs 335 173 51.6%
2010 Cubs 96 61 63.5%

This year he’s moving away from his fastball and moved toward his slider more and more.  He’s also throwing harder (almost a full mile per hour faster than any previous season) and batters are not making contact with anything.  Hitters are hitting only 60% of the pitches they swing at, 20% below the major league average; he also leads the league by almost 5%.

Season Team O-Contact% Z-Contact% Contact%
2006 Cubs 51.3% 84.6% 77.7%
2007 Cubs 44.9% 80.1% 67.0%
2008 Cubs 51.3% 82.5% 73.6%
2009 Cubs 52.8% 81.6% 73.0%
2010 Cubs 35.2% 71.7% 59.4%
2010 ML Average 65.6% 88.2% 80.9%

It’s easy to see from his Pitchf/x data that Marmol might not have any idea where the ball is going when he throws it.  It’s almost impossible to keep up what he’s doing, but after watching him walk a Ranger and strike three out in the 9th inning during Sunday’s game, it sure seemed to me that some good major league hitters simply don’t have much of a chance against him right now.

This article was originally published on Knuckleballs.


Interview: Jed Hoyer

I’m Mike Lee and I am the Deputy Editor of American Thinker. I stepped outside the world of news and politics recently to conduct an e-mail interview with San Diego Padres GM Jed Hoyer. That follows below.

Psychologically, we are hard-wired as humans to want to clean house when we take over a position that oversees many others, but are we better off working in conjunction with the existing personnel? By coming in to a new environment, does it make it difficult to properly evaluate incumbent talent- perhaps because employees, unlike players, do not have concrete levels of production from which to draw?

JDH – After getting the job with the Padres, I had a lot of great calls from the existing GM’s around the game.  Almost all of them offered some advice for a new GM.  One theme that was consistent was ‘don’t be hasty in your desire to make changes.’  I have made changes and will continue to add talent to the front office, but I was also fortunate to inherit a lot of very good employees from Kevin Towers.  If I had tried to put my stamp on the office too quickly, I would never have been able to properly evaluate those employees.

How important is discipline by a GM? Can you make an ill-advised decision if you’re tempted by boredom or feel the need to do something?

JDH – The marathon nature of a baseball season can certainly tempt a GM into activity.  For one, you are competing against 29 other teams and you always have a sense that if you’re not doing something to get better, you’re falling behind.  Also, small sample sizes can often mask the real value of a player or a team.  It is really important to constantly look at underlying numbers/metrics to make sure that you aren’t reacting to a meaningless slump.

Read the rest of this entry »


Dusty Baker and Pitch Counts

Over the first week of my new blog, I’ve made a number of posts about Dusty Baker’s handling of Reds pitchers.  I suggested that I thought Baker has done a better job of managing the workload of his starting pitchers this year. In that same post, I noted how Reds pitchers exceeded 110 pitches only five times at that point this season, and that after each such occurrence the starter was given an extra day of rest before his next start.  The next day, he left Johnny Cueto in to throw 113 pitches in the fourth game of a twenty-day stretch with no off days.  I then speculated that having Cueto throw so many pitches might cost the Reds before the stretch was over. Cueto had to leave his next start early with a blister.  Then, of course, there is Homer Bailey.  Yesterday, Bailey left his start early, and I pointed out that Baker has not been as careful in his handling of Bailey -particularly last year – as he has been with the other two youngsters in the rotation: Johnny Cueto and Mike Leake. Today, Bailey went on the DL with shoulder soreness.  So, is Dusty managing the starters’ pitch counts better or not?

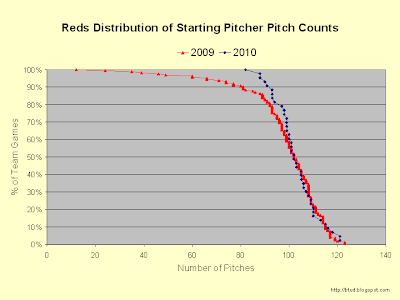
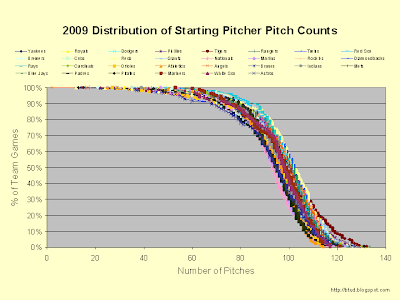
To help understand, I put together this chart (with data pulled from fangraphs).

The chart shows the percentage of team games in which the starter pitcher threw at least the number of pitches on the x-axis.  So, in 2009, Reds starters threw 80 or more pitches nearly 91% of the time. In 2010, the fewest pitcher a Reds starter had thrown in a game was 81 pitches.  (I pulled this data the day before Homer Bailey’s injury forced him out early.)  This chart makes clear that the 2010 Reds are not having as many low pitch count outings as the 2009 team.  Low pitch count outings are driven by the injury bug and by ineffectiveness.  The 2010 Reds have been generally healthy, Bailey’s injury notwithstanding.  Plus, the 2010 Reds are in contention and have been pitching relatively well of late, so it stands to reason that they’ve had relatively few ineffective outings.  It also doesn’t hurt that it is still early in the season before arms wear down.

While the factors mentioned above explain the low pitch count disparity between the 2009 and 2010 Reds, the manager makes a move in those cases out of necessity.  What is more interesting are the high pitch count games, where the manager determines the pitcher has done his day’s work.  Reds starters are being called on to throw between 103 and 113 pitches slightly less frequently than in 2009, but they are also throwing 118 pitches or more with greater regularity (albeit with a very small sample size).  So, is Dusty abusing his rotation?  It depends on where you draw the threshold for what constitutes overuse.

For comparison, let’s see how other teams are handling their starting rotation.  First, here are curves for each MLB team in 2009.

A few features jump out here.  First, Astros starters (blue x) managed to get to 80 pitches only 23% of the time.  That was considerably less than any other team.  Second, Nationals pitchers (pink triangles to the left) reached the magical 100 pitch mark only 24% of the time, while the Diamondbacks (royal blue to the right) reached it a league-high 59% of the time.  Finally, and most interesting of all, is that Tigers starters (maroon diamonds at the bottom right) were called on to throw more than 110 pitches with significantly greater frequency than any other team.  Maybe Rick Porcello isn’t striking anyone out because his arm is about to fall off.  🙂

So, is 2010 any different?

Boy, is it!  Pirates starters (green diamonds) have made it to 90 pitches just 53% of the time.  I had to look it up to make sure there wasn’t an error in my script.  It is, in fact, correct.  Other than Zack Duke and Paul Maholm, no one has been able to get to remotely deep into games with any consistency at all.  Also of note is that pitchers are generally having fewer low pitch count games in 2010 than in 2009.  This can be seen because the top half of the curve is generally to the right of the top half of the 2010 curve.  I assume this difference is because of the fatigue that shows up as a season wears on.  This trend even hold true in the high pitch count games, although it isn’t as clear from this chart.  In 2009, just four teams had starters throw more than 115 pitches in 10% of their games.  They were the Tigers (17%), Giants (12%), Royals (12%), and Reds (12%).  In 2010, there are 13 teams whose starters have thrown 115 or more pitches 10% of the time.  That group is led by the Rockies (19%), and includes the Giants (17%), Angels (16%), Astros (14%), Tigers (14%), Phillies (14%), Rangers (14%), Red Sox (14%), Brewers (12%), Dodgers (12%), Reds (12%), Cubs (11%), and Diamondbacks (11%).

By this measure, Dusty Baker is still working his starting rotation pretty hard but not any more than he did last year.  Maintaining the status quo is still better than much of the rest of the league at this point in the season though, so maybe we should cut him some slack and see how the season plays out.


Adam Jones’ Regression At The Plate

I don’t think it’d be a stretch to say that Adam Jones has been a big disappointment at the plate so far in 2010. He came into Saturday’s game batting just .254/.283/.384, and instead of taking a step forward from his .277/.335/.457 line in 2009 he’s taken a step (or two) back. What might be going on?

It’s not exactly news to say that Adam’s not the most disciplined hitter, but that’s actually gotten worse this year:

Year Swing % O-Swing % Z-Swing % In Zone Swing %
2008 53.5% 36.2% 69.1% 68.0%
2009 53.7% 35.3% 73.2% 66.0%
2010 52.5% 40.1% 65.2% 61.3%

Jones is swinging about as often he has in recent years, though that’s still a much higher mark than your average batter. He is chasing pitches out of the strike-zone more than he used to, and even the mid 30s rates were high. He started out last season getting that rate down a little, but his slump coincided in part with starting to chase balls close to that 40% rate he’s continued into this season. Adam’s swing at strikes less though, which means the percent of pitches that he swings at that are better to hit – in the zone (the last column) – has gone down. For the average batter, somewhere around 70% of the pitches they swing at are in the strike-zone. For Jones this year, that’s down to just 61%. So even if he’s going to be making contact – which he isn’t exactly great at anyway – it’s not going to be on as good of a pitch to hit.

Now, one might think that Jones is chasing more balls because pitches are throwing him a bunch of sliders and curveballs out of the zone. I think we all have that mental image of Adam waving at a slider down and away. That’s not exactly the case though:

Year Fastball% Change-up% Slider% Curveball%
2008 58.5% 7.6% 18.8% 12.7%
2009 62.3% 9.9% 17.6% 10.1%
2010 63.1% 10.1% 13.5% 8.0%

In his first full season pitchers tried to get him to chase, but now they seem to be challenging him more. I don’t think that’s a good sign. How often does he swing at each pitch?

Year Fastball S% Change-up S% Slider S% Curveball S%
2008 51.0% 62.0% 57.9% 48.5%
2009 52.0% 57.4% 59.9% 50.5%
2010 51.5% 52.2% 60.7% 45.6%

Very consistent on the heaters each season. He’s taking more change-ups and – in 2010 at least – curveballs as well. That slider continues to be his nemesis, as even though he’s seeing fewer of them he is swinging more often at the ones he does see. The percent of total pitches that Adam has thrown to him that fall into the “swinging at a slider” group has fallen though, from over 10% in ‘08 and ‘09 to about 7.4% in ‘10. Even when you add in the fact that his contact rate against the pitch has gotten worse, the percent of all pitches that end up as sliders that have been swung on and missed has gone down.

Breaking out the pitch types by in the zone versus out of the zone was inexact, but it looks like a much higher percentage of the fastballs thrown to Jones are in the strike-zone while a much lower percent of sliders and (especially) change-ups.

So summarizing the best I can by pitch type:

Fastball: Seeing more of them, principally in the strike-zone; swinging at them as much as he used to, and also making contact more often when he swings.

Change-up: Seeing more of them, and more of them out of the zone; swinging at them less, but making less contact when he does swing.

Slider: Seeing a lot less of them, but more frequently out of the zone; still chasing a lot, with slightly higher whiff rate.

Curveball: Seeing less of them, with about the same frequency in the zone; chasing it less, and still whiffing a whole lot on it.

It looks to me like Adam is taking pitches early in the count a little more often – getting fastballs in the zone to fall behind (he went to an 0-1 count over 55% of the time, and was getting a first-pitch fastball much more often – almost 70% of the time – which explains more than the entire increase in fastball usage overall) – and then chasing pitches out of the zone later in the count. He’s maybe trying to work the count, but doesn’t have the pitch recognition or the ability to tell a ball from a strike that’s needed to carry through on it.

Jones is striking out more and walking much less this year, and given his swing rates, those marks (~3% and ~21% respectively) aren’t out of line. If that doesn’t change – especially the first number – then it’s going to be very hard for him to be even an average hitter. ZiPS still thinks it’ll get better though, projecting a line from here to the rest of the season of .273/.327/.461. I don’t want to overreact to 40 games, but it certainly is concerning (and swing rates are the first things to stabilize). Also – it should be noted – it wouldn’t matter so much if Jones was playing plus defense in center.

Article originally posted at Camden Crazies.


Most Effective Stealers of All Time

Dave Cameron recently had an interesting discussion of the greatness of Rickey Henderson here at FanGraphs. The post left a lot of angles to uncover, some of which require manipulation of data beyond my present capabilities. With that said, one of the astonishing things was that Rickey was caught stealing 42 times one year, nearly negating 130 successful steals (at least from a conventional sabermetrics standpoint).

So what became interesting to me was what might happen if you were to look at who the most effective stealers were of all time. A truly deep look, complete with changing WPA calculations for each situation, would be impossible. (Down 2 in the 8th trying to steal 3rd with 2 out would be a disaster if failed, while getting caught stealing 2nd with 2 outs up 10 runs would be trivial, except for the beaning that might follow next game). And in some sense, each team is different. It might be less advantageous to steal with Barry Bonds at the plate, instead of a line drive hitter such as Barry Larkin, so the calculation isn’t perfect.

But I thought I would take a stab at it. We take the breakeven rate in Moneyball of 70% steals required just to break even. Each unsuccessful steal is, of course, a needless out. Each successful steal is therefore the equivalent of 3/7ths an out avoided (if we keep the sanctity of the 70% breakeven rate).

A total of 7 successful steals is as good as 3 avoided outs, but 3 unsuccessful steals is still worth 3 needless outs. So someone that steals 70 bases and is caught 30 times is no more valuable from a steals standpoint than someone that attempts 0 steals. He may add value on the basepaths in other ways, but we are strictly looking at steals here.

With that said, I took a look at the past 50 years (starting with 1959), and took every season where someone had more than 50 steals. As for why I chose 1959 — well, beyond being a round number, it should be noted that before 1912 data on times caught stealing was unavailable, and even through the 20’s the data was highly unreliable. It just so happened that the 30’s and 40’s and  50’s was not a running era, so we can say the modern running game began 50 years ago.

So who is the most effective stealer of all time by season?

It wasn’t Rickey.

Vince Coleman, in his second year, had 107 steals and was only caught 14 times. He could have been cuaght 30 extra times and still been ahead of the game. What is amazing, though, is in spite of that massive edge, he was probably worth something in the arena of 5.9 extra runs by my (conservative) calculation.

I figured that, over 26.5 outs (close to the true average, since, while home teams sometimes only need 24 outs, there is the longtail risk of 12+ inning games where each teams need 36+ outs), that if you score 4.9 runs per game, each out saved is worth just under .2 runs. (If you score 5 runs and need 25 outs to do it, each out would be exactly .2 runs. I realize that, due to leverage reasons, you could safely increase this worth, it’s just not something I felt comfortable calculating with limited resources). Then taking a slightly modified runs-wins formula (just about using 10 runs = 1 win), I can say that Vince Coleman’s steals are worth .6 wins conservatively. Alternate calculations factoring in leverage could double this number, so the best stealing base season of all times, was only worth .6-1.2 wins.

What were the top 5 seasons after Vince overall?

Well, glad you asked! I can send the whole spreadsheet to all who ask, but I thought I’d post here first.

  1. Vince Coleman 1986: 107 Steals, 14 CS
  2. Maury Wills 1962: 104 Steals, 13 CS
  3. Rickey Henderson 1983: 108 Steals, 19 CS
  4. Rickey Henderson 1988: 93 Steals, 13 CS
  5. Vince Coleman 1987: 109 Steals, 22 CS
  6. Tim Raines 1983: 90 Steals, 14 CS

Who were the worst offenders on the basepaths among prolific modern stealers?

Steve Sax in 1983 got caught 30 times in 86 attempts. That’s good for -1.1 runs. Bill North and Alex Sanchez rounded out the leadfooted three.

Overall, though, prolific stealers were generally net positive. Only 8 out of 213 seasons on this list had negative expected value.

The first conclusion I draw is that prolific basestealers, on the whole, are a net positive, even if it is a small positive. Obviously, there exist on the individual level suboptimal situations where runners still take off, but the large majority of prolific stealing seasons had high success rates. A highly negative rate of steals, of course, will be curtailed by coaches in due time before they could make this list.

—————–

Now, one more point. What is a true breakeven point? In the Moneyball Era, with AL teams in 2001 averaging 4.9 runs a game, 70% might be accurate. But in a dead ball era, a caught stealing might well have been more okay, because Albert Pujols wasn’t around to hit you home from first.

It then dawned on me that you could sort of model (crudely but still) a good breakeven model for steals based on runs scored per game.

4.9 runs per game = 70% breakeven

3.6 runs per game = 60% breakeven rate

and so on…

The values sort of fly apart at the extremes, but if your team is scoring 8 runs a game, it sort of would only make sense to steal if you had Usain Bolt standing at first, since, odds are the next guy might well get on base as well.

So in the spreadsheet I am sharing, you can change the average runs per game scored. If you move the average to 4.4 runs per game, Vince Coleman in 86 is still the best season of all time, but some other seasons creep up in value. (The breakeven at 4.4 runs per game with my crude calculator is 66%.)

Anyway, for anyone who wants the spreadsheet, post in the comments with a way of getting it to you — or, if FanGraphs is willing to let me upload it, I would be happy to do so.

Contextualized, Vince Coleman’s 1985, when only 4.07 runs per game were scored, makes his efforts extra impressive. It is a shame that he wasn’t great with the bat, and something of a buffoon to boot, because once he got on the bases, he legitimately did alter the outcome of games.
Is Delmon Young About to Break Out?

Delmon Young, a former #1 pick in the ’03 draft, is viewed as failed prospect, but might he be ready to live up to some of that hype that once surrounded him? Perhaps.

His walk rate was 5.6% in ’08 and 2.9% in ’09. This season it has jumped up to 8%. Just in terms of raw numbers, Young has 10 walks this season in 112 at-bats. He had 12 in 395 at-bats all of last season. With the walks have come a decrease in strikeouts. Young posted an 18.3% strikeout rate in ’08 and a 23.3% in ’09. This season, however, he has cut that ’09 strikeout rate in half almost, with a 12.5% strikeout rate.

In terms of power, Young is also starting to find his stride. His isolated power is .188, a career high, this season. That places him in front of Carlos Pena and Kendry Morales and just behind Austin Kearns and Carl Crawford in the category. If you’re just looking at home runs, he’s hit 4 this season. That’s not too amazing, but the most he’s ever hit in one season is 13, so he could be in for a career year. His .438 slugging percentage is also a career high. His previous high was .425 in ’09.

What’s hurting Young right now is a .247 BABIP, which is helping drive his .250 batting average. In ’07, ’08, and ’09 he posted a .338 BABIP and his career BABIP, over almost 2,000 at-bats, is .334, so we have a decent idea of what his BABIP could rebound to. Once Young, a career .288 hitter, sees his BABIP rebound, he could see his some of his progress start to pay off.

We also have to keep in mind that Young was drafted straight out of high school. He’s 24 years old now; if he had gone to college for three years and then gone to the minors, we might just now be seeing his first year at the major league level, not his fourth. Either way, Young may be primed for a breakout season.


Have the Tigers Ruined Rick Porcello?

Coming out of Seton Hall Prep in 2007, Rick Porcello was an ace in the making.  When scouts combined his age, velocity, and dominance (103Ks in 63 IP as a Senior); they saw a front-of-the-line major league starter. After being draft 27th overall, Detroit wasted no time showcasing their young ace. In order to ensure Porcello developed his other pitches, the Tigers insisted that Porcello stop relying on his curve. With his new approach, Porcello only managed 5.18 K/9 in his brief stint in the minor leagues.  Two seasons later, the strikeouts and the curveball have almost disappeared completely. While it’s still extremely early in his career, is it possible that the Tigers may have ruined Rick Porcello?

Here’s what Keith Law wrote about Porcello in 2009:

He doesn’t miss a lot of bats with the new approach, but generating ground balls keeps the pitch count down, and pitchers who throw strikes and don’t give up home runs can be very successful. But bear in mind that Porcello has the raw stuff to be more of a strikeout pitcher, and when he reaches the majors, he could blend the two approaches and be one of the top pitchers in the game.

That last sentence sums up the main cause for concern with Porcello. While scouts believe Porcello has the ability to dominate, his K/9 rate in the majors is a dismal 4.70. Even more disturbing is Porcello’s disappearing curveball. After throwing his curve 8.1% of the time in 2009, Porcello is only throwing his curveball .2% of the time in 2010.  Unless Detroit is still enforcing the “no-curve rules,” it might be time to start worrying whether his approach has been permanently impacted. It is interesting that the curve was Porcello’s worst pitch in 2009 according to the pitch type values. His reluctance to throw it in 2010, could mean that he has lost confidence in the pitch. The big question is, whether Porcello can be an ace without his curve?

Then again, Porcello is still only 21 years old and has already experienced success in the majors. It’s certainly possible that a) the Tigers are still enforcing the “no-curve rules,” or b) Porcello continues to develop into an ace while in the majors. Porcello did not spend a lot of time in the minors, and he is exceptionally young for his level. Typically, only the most promising players reach the majors at Porcello’s age. However, it is disturbing that his current approach has not produced “ace” results. Just for reference, Mark Buehrle has a higher career K/9 rate than Porcello’s current K/9. As Keith Law stated in his 2009 top prospect list, pitchers that get ground balls and prevent home runs have a lot of value, but Porcello was drafted as an ace and not an innings-eater. Yes, it’s still incredibly early in his career, but there is already some evidence to suggest Detroit may have mishandled their prized pitcher.

*This article was originally written on Foulpole2Foulpole.com


David Wright Is Not Getting Much Help From Jobu

We are a quarter of the way through the 2010 season and David Wright has appeared to put the ghosts of 2009 behind him.  After hitting only 10 HR all of last year, he has already hit 8 this year, helping him to post a wOBA just over .390 through the early part of the season. None of this is really surprising (his career wOBA sits at .392) and it appears to be business as usual for the talented third basemen.  The catch is that he has been able to post these numbers while striking out an alarming rate. 

As of this post, he was the unfortunate owner of a 38% strikeout rate, 2nd overall to Kyle Blanks and 6.7% higher than the next closest hitter with a wOBA over .390.  So what is causing this jump in strikeouts?  His strikeout rates spiked last year as well, but they are starting to spiral out of control this year.  A quick look at his numbers offers two possible solutions. First, though his Zone Swing/Contact rates appear normal, his O-Swing% has jumped up 4.5% while his O-Contact% has fallen 9.5%.  Swinging at more pitches outside the zone and making less contact is a quick and easy recipe for disaster. The second cause for concern can be seen in his pitch type linear weights.  He is mashing fastballs at a career high rate (wFB/C of 3.19), but this comes at the cost of looking downright foolish against the curveball (wCB/C of -2.01) and sliders (wSL/C of -2.58).  Apparently, opposing pitchers have noticed this weakness in David’s approach and have reacted accordingly, offering him 4.4% more sliders/curveballs and 8.4% less fastballs than last year.

Another (albeit small) contributing factor might be related to his platoon splits. David sports a career L/R split of .439/.370 for wOBA and 14.4%/22.9% K-rate. The wOBA has been even more extreme this year (.608/.339 andthe strikeouts have jumped to 19.2%/42.3%. This is even more troubling as Wright has so far faced even more RHP than usual. This year he has faced RHP 80% of the time, up 78% in 2009 and 74% in 2004-2008.  His platoon splits are well known, and he is presumably facing more RHP later in games. This decision was easier for opposing coaches last year, as he no longer had the left handed power of Delgado (or any power, really) batting behind him.  With the only lefties in the lineup being the unproven Chris Carter and Ike Davis, David will contine to face a lot of right-handed relievers.

The extra appearances against RHP does not explain why his strikeout rate against them has doubled though. It is early in the season, so it could just be bad luck on his part, and his strikeouts should regress towards his career line of 20.8%, or at least his line of 26.2% last year. Even if they don’t, he will remain a premier 3B if he can maintain his power, walk rates, and high BABIP.  Still, if David wants to approach his MVP caliber numbers of 2007, he should take strides to lay off pitches outside the zone and adjust better to the breaking balls.


Is Something Wrong With Ryan Rowland-Smith?

Entering the 2010 season, the Mariners starting pitching was a question mark. After Cliff Lee was sidelined early in Spring Training with an abdominal strain, the bottom half of the rotation came under further scrutiny. As the Mariners evaluated questionable candidates for the bottom half of the rotation, fans and the front office could at least rest easy thatFelix Hernandez and Ryan Rowland-Smith were healthy and prepared to start. 

What a difference forty days can make. Doug Fister and Jason Vargas have been among the few pleasant surprises in Seattle this season, while RRS has seemingly lost the confidence of the coaching staff. Last night, RRS gave up two more long balls and he was removed in the bottom of the third inning. It was his second start in a row he did not record an out in the third inning. 

It isn’t difficult to see that Rowland-Smith has been struggling. He hasn’t pitched into the seventh inning since April 17th, and hasn’t made it to the sixth in three starts. He’s allowed ten home runs in thirty-nine innings while walking more men than he’s struck out (17-16.) All of this leads to a gruesome 7.15 FIP and a troublesome 5.91 xFIP. Furthermore, 25% of balls put in play against Rowland-Smith have been line drives, leading to a9.10 tRA

He’s also having a problem generating swinging strikes. It isn’t that he is having control issues; he’s throwing strikes at virtually the same percentage this year as he was last season. His problem is generating swinging strikes, particularly on pitches out of the strike zone. Last year, hitters made contact on 69.3% of pitches they swung at outside of the strike zone. This year, that number has climbed all the way to 78%. This would explain his inability to strike people out, as he can’t lure batters to swing at good pitches out of the zone. 

Considering the high xFIP, tRA, and contact rate on balls outside of the strike zone, one has to wonder if there is some hidden problem in his game. My best guess would be that something is wrong with his fastball. Last year his heater was 4.4 runs above average. This season, his fastball has been worth -6.6 runs below an average offering. Let’s look a little deeper.

In 2009, Rowland-Smith worked almost exclusively with a four seam fastball (when throwing fastballs of course.) This year, all of his fastballs have been two-seamers. Perhaps the adjustment from four-seamers to two-seamers has been part of the problem. Though his fastball velocity down only a tick, hitters are really teeing off against it. 

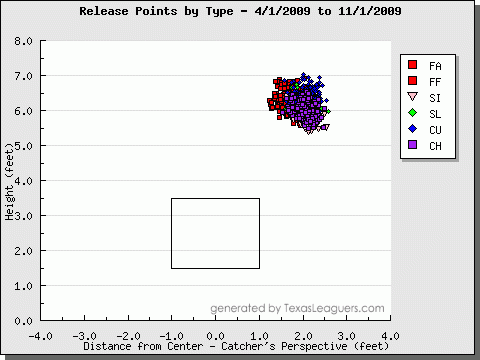
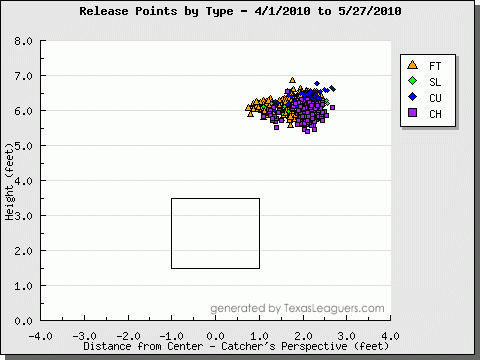
I’ve pored through his pitch F/x data, looking for some differences between his pitches this year and last year. The most striking difference between the two years I can find is his struggle to find a consistent release point this year. Take a look at the difference between 2010 and last season. (Pitch f/x data is courtesy of Texas Leaguers.)

RRS has particularly had trouble with consistently releasing his two seam fastball. I’m not sure if an inconsistent release point is responsible for his struggles this year, but this is something to monitor over his next couple of outings. He’s releasing his two-seamer closer to the strike zone than the other two pitches, which could explain why hitters, and lefties in particular, are seeing the ball better than they did last year. His two-seamer doesn’t have much movement, and perhaps the lack of movement, slightly reduced velocity, and limited horizontal movement have turned his heater into a poor pitch. 

I can’t be sure that RRS’s release point issues are the cause of his poor performance to date in 2010. At the same time, I would like to see him become more consistent with his release point. If he corrects that flaw and is still struggling, we can re-examine his case. Until then, I’m assuming that he’s releasing his fast-ball on a more over the top plane than his other pitches, and that is either causing it to break less or is tipping off hitters.


Saving Baseball’s Charm

Tom Verducci recently published a column lamenting the lack of contact in modern baseball. He cites rising walk and strikeout rates and lower numbers of balls in play as reasons the game is steadily losing an essential part of its charm. He makes some good points; it is immensely more enjoyable to watch Ichiro slap and run than to see Kevin Youkilis take a six-pitch walk without removing the bat from his shoulder. When my friends and I are watching a game, we refer to the walk as “the most boring play in baseball.” The pitcher misses his spot, and the hitter drops his bat and trots to first base. It is good for the team that is batting, but it is not fun to watch.

However, Verducci’s claim that walks and strikeouts have been on the rise for decades is only partially true. An article by Sky Andrecheck from the offseason demonstrates that walk rates have fluctuated over the past 30 years but have not shown a general upward trend. And while Verducci correctly points out that walks have risen for five straight years, they actually dropped every year during the first half of the decade and are no higher now than they were in the mid-1980s. Strikeouts have certainly climbed steadily, going from 12.5 percent of plate appearances in 1980 to about 18 percent today. As I described in my posts on high-strikeout players, the main ways to overcome a ton of whiffs are to walk a lot and to hit home runs. Walk rates have not changed a whole lot, so as the game has allowed in more high-strikeout players, home run hitting has increased to compensate. This increase is necessary to balance the negative effects of strikeouts, because players without power who strike out a lot cannot provide much value. However, while high-strikeout sluggers have been on the rise for a while, Verducci’s calls for changes to the game may be premature.

This type of play may just now be reaching its peak. As Moneyball explained, Billy Beane and the Athletics realized in the late-1990s that on-base percentage was vastly undervalued, and they set out stacking their team with flawed castoffs who were undesirable to other teams but could get on base. Today, a sort of boomerang effect is occurring. Teams such as the Athletics, Red Sox, and Mariners realized this past offseason that, as the rest of the league had caught up to the on-base bandwagon, it was the traditional baseball skills—speed and defense—that had now become undervalued. The Athletics and Mariners, in particular, set out acquiring these undervalued players, and both teams now find themselves with rosters full of excellent defenders who save runs with their gloves. Both teams also suffer from a severe lack of power.

Perhaps, as player valuation continues to evolve, the mix of skills in the pool of major league players will fluctuate and recalibrate around an equilibrium. Teams may value low-power speedsters more and more, until there is a better balance between fleet-footed defenders like Franklin Gutierrez and lead-footed sluggers like Adam Dunn. And as recalibration happens and players with speed and a lack of power become more prevalent, strikeouts and walks may begin to come down some.

Changes are not only happening on the position player side. Pitchers, too, have evolved in recent years. Velocity and the ability to miss bats have been highly valued commodities for decades, and as I detailed in my post on the fireballers of today’s game, great velocity often comes with great wildness. Many pitchers who can blow hitters away also have trouble throwing strikes. And as with walks and power, this skill set has become extremely expensive. Some teams, particularly the St. Louis Cardinals, are turning to a new formula to get maximum value from their pitchers: control and groundballs. Pitching coach Dave Duncan, as has been widely documented, has rescued careers by converting pitchers into strike-throwing groundball machines. Joel Pineiro is the most extreme example. Last year, as a 30-year-old journeyman, he posted the lowest strikeout rate of his career—105 in 214 innings pitched—while also putting up, by far, the best season of his career. He did this by walking almost nobody and keeping the ball on the ground, allowing very few home runs.

Pitching to contact is not a good strategy for players who allow a lot of fly balls. When batters put the ball in the air, a good number will leave the park. This is especially true in an era when shortstops can slug 40 home runs. Thus, fly ball pitchers must strike batters out, limiting those balls in play, to succeed. Groundball pitchers prevent hitters from lofting the ball, minimizing the threat of the home run. They can afford to let the batter put wood on the ball and count on the infielders to make outs. Many ground balls get through for singles, so to be successful with this strategy pitchers must hold down walks to limit the number of baserunners. With this formula, Tim Hudson and Derek Lowe have had many years of success despite below-average strikeout rates. Pineiro and now Brad Penny are veterans that have recently converted, and young groundballers like Doug Fister of the Mariners and Nick Blackburn of the Twins are carving out spaces for themselves in the majors with miniscule strikeout numbers.

While it is certainly true that hitters are putting balls in play at historically low rates, it is not entirely clear what the exact causes are. It may be that batters are better trained to work the count and wait for good pitches to drive, and that they consequently strike out more. Teams may be selecting for these skills more vigorously. It may be that lineups with power from top to bottom have forced pitchers to move to the edges of the zone, limiting their ability to keep walks down. Whatever the reasons, it also is not clear that current trends will continue. Verducci mentions potential tweaks to the game, such as expanding the upper limits of the strike zone, but changes are likely to have unintended consequences. Enlarging the strike zone, for example, might not actually increase the number of balls in play.

Perhaps before changing the game, MLB’s bosses should consider the latest developments in player evaluation and wait to see whether the game is changing itself. For hitters, walks and power are here to stay, and for pitchers, velocity and whiff-inducing stuff will always be prized traits. But the mix of skills may be shifting as teams learn to better quantify all of the ways they can score and save runs. Perhaps recent trends will be counterbalanced as teams copy the money-saving measures of innovative teams—the Athletics and Mariners with their light-hitting fielders and the Cardinals with their groundballers. While balls in play may be at an all time low, one thing we can be sure of is that the game will continue to evolve, with or without drastic action by the people in charge.

This article originally ran on Ball Your Base.