Which Pitch Should Be Thrown Next?
There are few things I enjoy in baseball more than the pitcher vs. hitter dynamic. Everyone likes to see highlight plays like a great catch or a mammoth home run, but those plays are few and far between. I believe that the tension created in a drawn-out plate appearance is where baseball is most enjoyable. Every pitch is meaningful, and the strategy of the game is on full display. The pitcher is trying to decide the best way to get the hitter to produce an out and the hitter is doing everything he can to thwart the pitcher.
This dynamic of baseball has always fascinated me. I was curious how pitchers and catchers decided which pitch was correct to throw in a situation. There are plenty of tools available to them that were not readily available when I was a child, like heat maps made from pitch-tracking data, but they show results without the context of what previous pitches were thrown in the plate appearance. Heat maps provide useful data, but the real art of pitching is being able to set up a hitter to take advantage of their weaknesses. If a pitcher throws the same pitch in the same location every time, eventually the hitter is going to catch on and change his strategy accordingly. So which sequence of pitches is the most effective at retiring hitters? This is the question I attempted to answer with this article.
Methodology
To get my initial data, I imported every regular season pitch from Baseball Savant from 2008-2020. This gave me almost nine million rows of data. The next step was to aggregate the different pitch types. Baseball Savant has fourteen distinct pitch types, but I decided to group them into four categories of pitches: fastballs, curveballs, sliders, and changeups. The groupings are in the table below.
| My Grouping | Baseball Savant Pitches |
| Fastballs | Four-Seamers, Two-Seameers, Sinkers |
| Curveballs | Curveballs, Knuckle Curves, Slow Curves, Eephuses |
| Sliders | Sliders, Cut Fastballs |
| Changeups | Changeups, Split-fingers, Forkballs, Screwballs |
The one pitch missing from the table is the knuckleball. Knuckleball pitchers are exceedingly rare, and they do not rely on pitch sequencing, so they were excluded from my analysis.
The main reason I grouped these pitches together was to avoid small sample issues when looking at pitch sequences in a plate appearance. Small sample size may not seem like an issue for almost nine million rows of data, but the number of permutations in a plate appearance grows rapidly. There may be a few quibbles with how I grouped the pitches together, but I believe it is an accurate representation of the major types of pitches in baseball.
After I created my pitch types, the next step was to create zones for where the pitch crosses the plate. I decided to split the locations into nine separate zones. The nine zones are:
- Low and Outside
- Low and Inside
- Low and Middle
- Middle and Outside
- Middle and Inside
- Middle and Middle
- High and Outside
- High and Inside
- High and Middle
For me to use inside and outside zones, I needed to consider the handedness of the hitter. If a hitter is right-handed, anything greater than or equal to 0.28 feet in the plate_x column was considered outside, and anything less than or equal to -0.28 feet in the plate_x column was considered inside. For left-handed hitters, anything greater than or equal to 0.28 feet in the plate_x column was considered inside while anything less than or equal to -0.28 feet in the plate_x column was considered outside. Everything else was considered the middle of the plate.
To determine the zones for the height of pitches, I first calculated the strike zone length by subtracting the bottom of the strike zone height from the top of the strike zone height. I then took this length and divided by three. Any pitch above the lower boundary of the top third was considered a high pitch, and any pitch below the upper boundary of the bottom third was considered a low pitch. The remaining section was considered middle height.
Next, I grouped all the pitch sequences by plate appearance. I then removed any plate appearance that had missing pitch data. This left me with over two million plate appearances to analyze. I decided to look at plate appearance results so that I could evaluate the entire battle at the plate instead of each individual pitch. This did limit the amount of data to analyze, but I believe it gives a more accurate look at what pitch sequences truly work when a pitcher is trying to retire a hitter.
The last thing I wanted to account for were platoon splits in a plate appearance. Being a right-handed pitcher and throwing a breaking ball low and outside to a right-handed hitter is different from throwing a breaking ball low and outside to a left-handed hitter. It would have been misguided to not separate those occurrences, so I decided to create two separate groups. The first group is pitchers with a platoon advantage and the second group is pitchers with a platoon disadvantage.
Results
Now that I have explained the data gathering process, it is time to explain the results. As I mentioned in the previous section, I will be looking at situations where the pitcher had the platoon advantage and where he had the platoon disadvantage. I will also be summarizing the plate appearance results in two ways. The first will be by utilizing pitch type alone, and the second will be by utilizing both the pitch type and location. I did this because the sample sizes for the results using pitch type and location get small quickly and the results using pitch type alone are far more useful for analysis in those instances. With all that said, it is time to look at the results for the first pitch in a plate appearance.
First Pitch of Plate Appearance
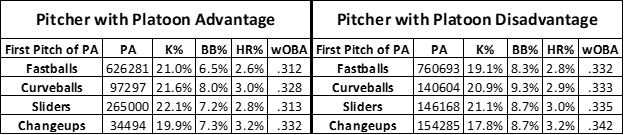
From this table, we can see that starting a plate appearance with a changeup is generally a bad idea with or without the platoon advantage. I was surprised by how close the wOBA values were for fastballs, curveballs, and sliders when a pitcher had the platoon disadvantage. I thought that there might be more separation like the splits seen between pitches when the pitcher has the platoon advantage. I am not sure why there was such a large split between fastballs/sliders and curveballs/changeups when the pitcher had the platoon advantage. However, I suspect that there could be some selection bias due to relievers entering the game with favorable matchups.
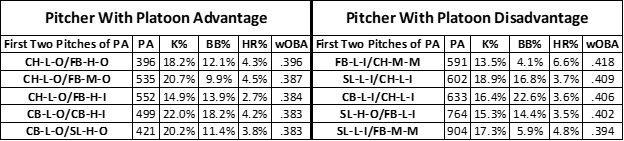
Next, I reviewed the summary by pitch type and location. This is the only pitch type and location table I will show in its entirety. Going forward, I condensed the table to only show the best and worst pitch sequences by wOBA.

There are plenty of conclusions that can be drawn from the table above, but one thing I found interesting was how the same pitch type could be thrown in a different location and have drastically different results. From the previous table, we saw that curveballs are generally not the best pitch to be thrown to start a plate appearance if you have the platoon advantage. However, if you throw the curveball high and outside or middle and outside, your chances of succeeding increase substantially. I believe this disparity shows just how important pitch execution is for a pitcher. A pitcher could have the perfect pitch selection to retire a hitter, but if you miss your intended location by six inches or more, it does not matter.
First Two Pitches of Plate Appearance

Once again, if a pitcher has the platoon advantage, it seems like it is not a good idea to throw a changeup for the second pitch of a plate appearance. The only time throwing a changeup is not the worst option is when you threw a changeup in the first pitch of the plate appearance. Starting a plate appearance with a fastball gives the most options for a successful second pitch, with fastballs, curveballs. and sliders all yielding decent results. If you started the plate appearance with a slider, it would be sensible to continue throwing breaking balls to achieve the best results.
If you are a pitcher without the platoon advantage, breaking balls seem to be your best bet for a successful outcome. Throwing a curveball or slider for the second pitch of a plate appearance is far superior to throwing a fastball or changeup regardless of what you threw for the first pitch.
Going forward, I will only show the top five and bottom five pitch sequences by pitch type and location with a minimum of 300 plate appearances. I do have the results for each pitch sequence, but it would be far too large of a visual for the purposes of this article.
Top 5 Sequences-First Two Pitches (Min 300 PA)
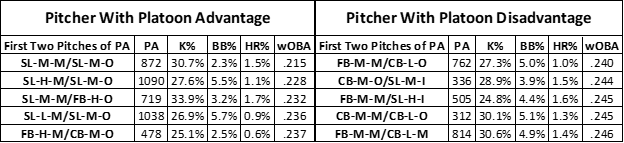
Bottom 5 Sequences-First Two Pitches (Min 300 PA)
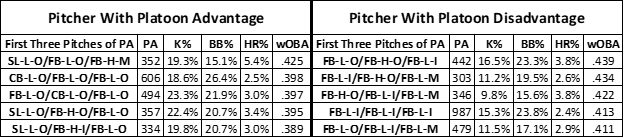
First Three Pitches of Plate Appearance

After looking at these tables, it appears that throwing a fastball for the third pitch in the plate appearance is a poor option regardless of what the first two pitches were. I assume that this happens due to the count in the plate appearance. Usually pitchers that fall behind early in the count need to challenge a hitter with a fastball in the strike zone. This gives the hitter a significant advantage and most likely skews the results a bit. In the future, I may revisit the issue and adjust for count, but I fear that doing so will restrict my sample size even more.
Top 5 Sequences-First Three Pitches (Min 300 PA)
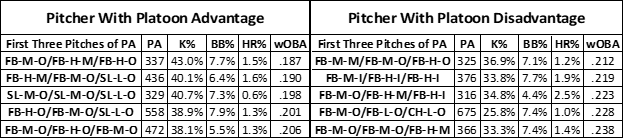
Bottom 5 Sequences-First Three Pitches (Min 300 PA)
First Four Pitches of Plate Appearance
This section is a bit different from the previous ones. There are now 256 unique pitch type combinations, and it was too difficult to make the full table presentable. With that in mind, I split the table into four smaller tables based on the first pitch in the plate appearance. I also decided to abandon the top five and bottom five pitch and location sequences, because there were over 250,000 combinations for each platoon situation and only about twenty total combinations that had over 300 plate appearances with results.
First Pitch Fastball

First Pitch Curveball

First Pitch Slider

First Pitch Changeup

Once again, it appears that throwing a fastball for the fourth pitch in the plate appearance is a poor option regardless of what the first three pitches were. The near universal increase in walk rate for sequences with a fastball as the fourth pitch provide more evidence that the increase in wOBA is heavily count related. Breaking balls continued to be the most effective pitch thrown in most situations. It makes sense that pitchers have started to eschew their fastball for secondary pitches in recent years.
Conclusions
I could continue to parse the data further for longer plate appearances, but I do not want to belabor the point. There is far more analysis that can be done with these results, but I believe that this is a satisfactory introduction for a broad topic. I am confident that the same process could be modified to suit an individual player strategy, but that is beyond the scope of this article. With that said, here is a summary of my findings:
- If a pitcher has the platoon advantage, a fastball or slider is the most effective pitch to throw to start the plate appearance.
- Pitch location is at least as important (if not more so) than pitch selection.
- In most situations, throwing a breaking ball is going to be the most effective pitch.
- In most situations, throwing a changeup is going to be the least effective pitch.
- The more fastballs a pitcher throws later in the plate appearance, the less likely they will have a favorable outcome.
More of my work can be found at my website or on Twitter.
Interesting stuff!