Visualizing Major League Baseball During the Aughts
2010 marks the end of the “aught” decade for Major League Baseball. I thought I would take the opportunity to analyze the last 10 years by visualizing team data. I used Tableau Public to create the visualization and pulled team data from ESPN.com (on-field statistics) and USA Today (team payroll).
The data is visualized through three dashboards. The first visualizes the relationship between run differential (RunDiff) and OPS differential (OPSDiff) as well as the cost per win for teams. The second visualization is in table form and can be sorted and filtered along a number of dimensions. The final visualization looks at expected wins and actual wins.
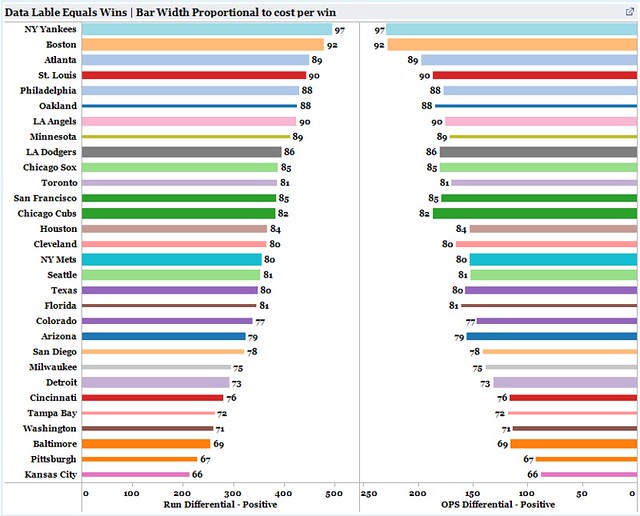
The first visualization lists all 30 teams and provides their RunDiff, OPSDiff, wins, and cost per win for 2001-2010. The default view lists the averages per team over the past 10 years, but you can select a single year or range of years to examine averages over that time frame. The visualization also allows users to filter by whether teams made the playoffs, were division winners or wild card qualifiers, won a championship, or were in the AL or NL. The height of the bars corresponds to a team’s cost per win–thicker bars denote a higher $/win ratio and less efficient use of dollars by the team. Total wins (or average for a range of years) is listed at the end of each bar. In order to create the bar graph I normalized the run and OPS differentials data (added the absolute value of each score + 20) to make sure there were no negative values. For the decade, run differential explained about 88% of the variation in wins and OPS differential explained about 89% of the variation in run differential.
The visualization illustrates the tight correlation between RunDiff and OPSDiff, as the respective bars for each team are generally equidistant from the center line creating an inverted V shape when sorted by RunDiff. In terms of average wins over the decade, there are few surprises as the Yankees, Red Sox, Cardinals, Angels, and Braves round out the top 5. However, St. Louis did a much better job at winning efficiently, as the height of their bar illustrates that they paid less per win than the other winningest teams (<$1M per win).
(click for larger image)
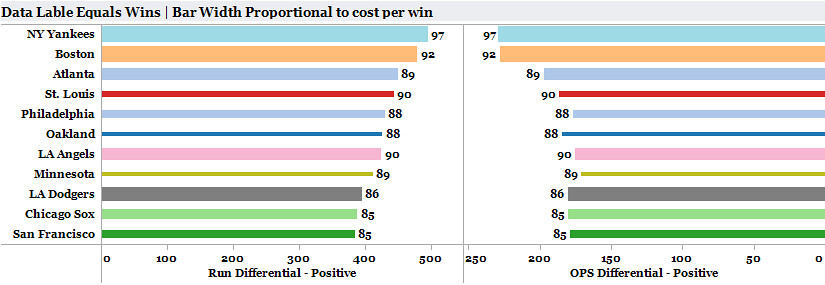
The viz also illustrates the success of small market teams such as Oakland and Minnesota who both averaged roughly 88 wins while spending the 3rd and 4th least respectively per win. If you filter the visualization for teams that averaged over 85 wins during the decade, it really drives home how impressive those two teams’ front offices have been at assembling winning ball clubs with lower payrolls. No other team that averaged >85 wins paid less than $975K per win. Oakland looks even more impressive when you isolate the data for years that teams qualified for the playoffs. Oakland averaged 98.5 wins during seasons they made it to playoffs, and did so spending only $478K per win.
(click for larger image)
What about the big spenders? The five biggest spenders included the Yankees, Red Sox, Mets, Dodgers, and Cubs. The Yankees spent an astounding $1.8M per win during the decade, but they also averaged the most wins with 97. Some will say this provides evidence that the Yankees–and other big market teams–simply buy wins and championships. However, only 17% of the variation in wins was explained by payroll during the decade. Moreover, while the Yankees occupied 6 of the top 10 spots in terms of cost per win they were the only team to earn a positive run differential. The Cubs, Mets, Mariners and Tigers all finished under .500 and missed the playoffs while those Yankee teams qualified for the playoffs 5 out of 6 years and won one World Series. Yes, the Yankees spend significantly more per win, but they spend more wisely than many other deep pocket teams.
Teams that made the playoffs averaged a little over $1M per win in those years they qualified, with Wild Card teams ($1.030M) spending a tad bit more than Division winners ($1.006M)–about $14K per win on average. World Series winners spent $1.08M per win in their winning years compared to $1.002M for other playoff teams. Teams that failed to make the playoffs averaged $923K per win.
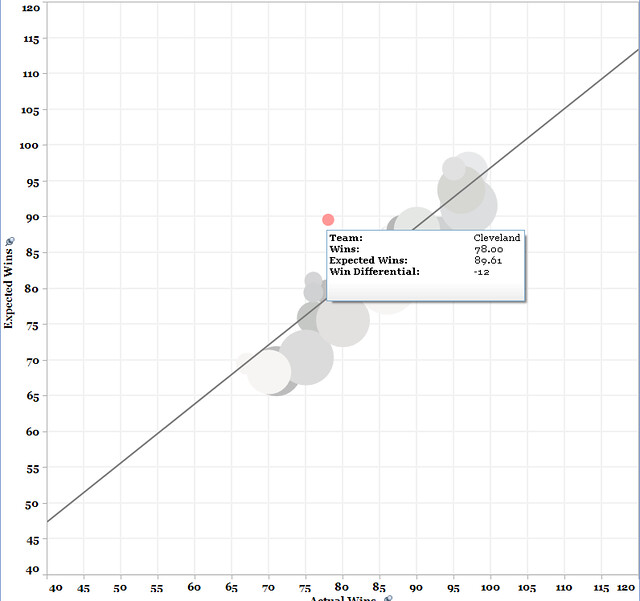
The best team of the decade in terms of run differential? The 2001 Seattle Mariners, who amassed an incredible +300 RunDiff. Even with that total they were only expected to win 111 games–they would go on to win 116. The Mariners had only the 11th highest payroll that year and so paid a measly $644K per win. The absolute worst team of the decade? The 2003 Detroit Tigers, who earned a RunDiff of -337 and actually won less games than expected (43 vs. 47). Given their ineptitude on the field, the Tigers paid $1.14M per win even though their total payroll for the year was only $49M.
Luckiest team? The 2005 Diamondbacks who won 77 games despite a RunDiff of -160 (only 64 expected wins). Hardest luck team? The 2006 Indians, who only won 78 games with a +88 RunDiff that should have translated into 90 wins.
 (click for larger image)
There are tons of ways to manipulate the visualizations and cut the data. Hopefully viewing the data in this way is helpful and illuminates some things we didn’t know and drives home other things we had a hunch about.
This is my first attempt to visualize this data, so please feel free to send along any and all comments so I can improve it.
Author’s Note: Bill Petti is a Senior Consultant at Gallup and maintains a blog, Signal/Noise, dedicated to musings on various subjects such as business strategy, research methodology, and baseball.
Bill leads Predictive Modeling and Data Science consulting at Gallup. In his free time, he writes for The Hardball Times, speaks about baseball research and analytics, has consulted for a Major League Baseball team, and has appeared on MLB Network's Clubhouse Confidential as well as several MLB-produced documentaries. He is also the creator of the baseballr package for the R programming language. Along with Jeff Zimmerman, he won the 2013 SABR Analytics Research Award for Contemporary Analysis. Follow him on Twitter @BillPetti.
For an updated version of the post and visualization, see here: http://sbn.to/hIzDP2
Is the cost per win adjusted for inflation? In 2000, the average player salary was 1.8 million. Today it’s 3 million. I would think that would mean that teams that spent the majority of their money in the first half of the decade would have a better efficiency, if you don’t adjust for salary inflation?
Even for a bare minimum team, you’re going to get about 60+ wins. So the most efficient win/$ formula would be to spend lots of money early in the decade (pushing up your win totals) and then to go cheap later in the decade (where your dollars are worth less). The Cardinals would seem to benefit from this in particular, since their payroll steadily increased since 2000 until about 2005 and has averaged around that level for the last 5 years. So, they’re still efficient- but this may be overstating their actual efficiency if we don’t consider inflation effects.
(Which is not to say inflation is easy to consider, due to contract structuring, unless we want to consider the total committed money at any given time, but c’est la vie).
The aughts ended at the end of 2009. 2000-2009 = aughts. 2010 was the beginning of the next decade of the teens.
@ B N: I did not adjust for the inflation of player salaries during the decade. Would be interesting to see how much it changes the findings. I might try to update it at some point.
@JoeyMac: Fair point. Technically, 2000 was the last decade of the 20th Century. The first decade of the 21st Century ran from 1/1/2001 to 12/31/2010. So, yes, technically should have said “First Decade of the 21st Century” or “Past Decade”.
Bill, I know you’re going to get an e-mail notification for this, so hopefully it will find you.
The two biggest things that you need to account for are inflation, and minimum salaries.
Minimum salaries at $400,000 * 25 players, you’re only talking $10 million dollars lopped off each budget — makes a significant difference on the low end, but not so much on the high end.
Inflation if we assume a (very conservative) 5% a year will make a $10/million a year contract in 2000 is the same as a $17.5 million contract in 2010. That will make the gap in salaries even bigger as well (or I assume it will).
That’s a really simple way to handle it, but it may help you out in your next draft. Keep up the good work!