Using History and Steamer to Predict the Comeback Player of the Year Award
While the race for the Comeback Player of the Year (CPOTY) award is nowhere near as fierce or publicly anticipated as the races for major awards like MVP, Cy Young, or Rookie of the Year, it’s still an award rich with history that recognizes some of MLB’s best bounceback seasons. Here, we’ll look at the history of the award, and use some of the trends in the historical data to identify some candidates for the award this upcoming season.
In 1965, the Sporting News gave out its first set of CPOTY awards to Pirates pitcher Vern Law and Tigers first baseman Norm Cash. The award was created to recognize a player who “re-emerged on the baseball field during a given season,” although this ambiguous definition has led to some questionable selections (notably 2001 Ruben Sierra over Juan Gonzalez) and debate over what it truly means. The award is given annually to one player in each league, and is typically given to either a player returning from injury or one coming off a down season to return to a level of success previously achieved in their career. The award has been given by two bodies throughout its history, as the Sporting News presented it from 1965 to 2006, while MLB has given out the award since 2005. Over the life of the award, 106 total player seasons have been recognized, and a few players have won twice.
Looking at a handful of trends within this sample allows us to identify what characteristics of player seasons correlate with winning the award, and therefore may allow us to formulate decent guesses as to what players might have a strong chance to contend for the award in the coming seasons. Some of the more important characteristics of CPOTY award winners include (but aren’t necessarily limited to) performance (both past and in the winning season), whether the player was injured in the season preceding their comeback, the player’s position, and team success. Let’s dig in and look at these trends to construct an ideal profile for a Comeback Player of the Year favorite, then look at what players might fit the bill in the upcoming season.
Performance
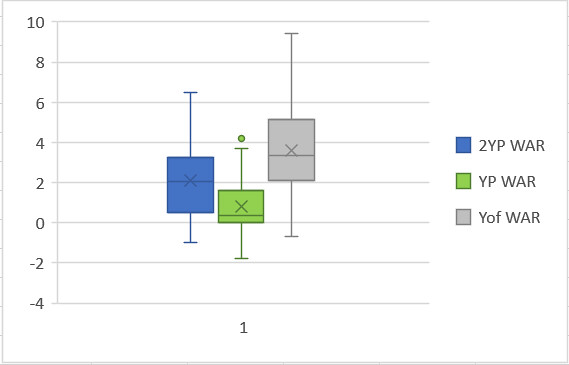
For the sake of simplicity, we’ll divide the performance category into three sections: past success (defined as two seasons prior to the comeback season), down season (defined as the season immediately prior to the comeback year), and the comeback year itself. While this isn’t perfect, this division will allow us to easily view the swings in performance that are associated with the award and look for current players that fit that mold. To examine a player’s performance, I looked at WAR for each of the seasons in question because it is a good general guide for player value and encompasses not only ability but also playing time to a degree, since it is a counting stat. For the purposes of this award, a counting stat like WAR is more important than a rate stat like wRC+ or UZR/150 because some winners won the award following a solid but injury plagued season. Performance was considered both by looking at the dataset for the three season groups (2 years prior, 1 year prior, and year of) as well as for the differences between the 2 years prior performance vs the year prior performance and year prior vs year of performance. Below is a box-and-whisker plot showing the distributions of the three year datasets, with WAR on the Y-axis:
As might be expected, the comeback season group yielded the most value of the three groups, followed by the past success season and then the down season. For the past success season, the middle 50% of values fell between approximately 0.5 WAR and 3.0 WAR, meaning that these seasons typically produced solid but rarely spectacular results. The middle 50% of values for the down season group fell between about 0 WAR and 1.5 WAR, meaning that most seasons in this group produced relatively middling or less value. It is also notable that the median is much closer to the lower quartile (0 WAR) than the higher quartile, and this skewing is because many of these down seasons saw players miss most or all of their season, leading to a significant number of players accumulating near 0 WAR in their down season. Finally, the middle 50% of bounceback seasons saw WAR values between 2.0 WAR and 5.0 WAR, meaning that most winners produced at least above average if not significantly above average value in their comeback season. The following table also shows the mean and median values for the three datasets (also broken down by certain time periods):
| WAR Breakdown | 2 YP | YP | Yof |
| Average (Total) | 2.09 | 0.78 | 3.55 |
| Median (Total) | 2.05 | 0.35 | 3.35 |
| Avg (Since 85) | 2.07 | 0.43 | 3.56 |
| Med. (Since 85) | 2.05 | 0.10 | 3.10 |
| Avg (Since 05) | 2.31 | 0.40 | 3.73 |
| Med. (Since 05) | 2.15 | 0.20 | 3.65 |
Another way I evaluated performance was by looking at the differences in performance from year to year between the first two years (past success and down season) and the most recent two years (down season to comeback season). As expected, the first group saw a significant drop in performance while the second group typically saw a significant increase, often larger than the initial decrease. The following box-and-whisker plot shows the distribution of both sets of data, while the data table shows the mean and median values.

| WAR Change | Diff. |
| Mean 2YP to YP | -1.33396 |
| Mean YP to Yof | 2.822642 |
| Median 2YP to YP | -1.05 |
| Median YP to Yof | 2.6 |
So our ideal candidate will have put up at least solid value during their past success season, lost a significant chunk of that value the next season, and then experienced a big bounceback the following season, posting solid to excellent value. According to Steamer’s projections, there are 23 hitters and 12 pitchers (two relievers, 10 starters) expected to follow this pattern with a bounceback 2018.
Injury
The next key component of the award is the player’s injury status during the season immediately preceding his comeback. While comebacks from injury have become more prevalent over the life of the award, injury comebacks were hardly recognized early on. The two following graphs will show the number of injury comebacks vs non-injury comebacks over time along with the difference between the two categories and the percent of injured winners over time. (Disclaimer: a good portion of this injury data did come from Wikipedia because I couldn’t find much historical injury info elsewhere, so some of it may be a little inaccurate but should not be so much so that the trends change.)

As you can see, the percentage of total winners of the award coming off injury has increased significantly as time has passed, with now nearly half of the award winners coming off injury. The difference has shrunk from a peak of 32 in 1989 to only 12 following 2017’s winners. The trend is even more stark when looking at the data broken up into specific time frames:
| Injury Breakdown | Yes | No |
| Total | 47 | 61 |
| Since 1985 | 41 | 25 |
| Since 2005 | 19 | 7 |
Since MLB took over the award in 2005, the trend has flipped entirely, with injury comebacks making up 73% percent of winners in that span. While there could be other complicating factors at play here, such as increased DL placements since the early days of the award, it still seems clear that suffering an injury during the preceding year has a strong tie to winning the award.
Position
The next characteristic of CPOTY winners is position. For whatever reason, certain positions are disproportionately represented amongst award winners. Here is a breakdown of the winners by position, in table and pie chart form:
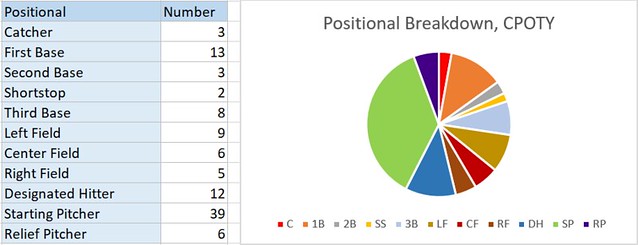
As you can see, the award is most frequently given to starting pitchers, followed by first basemen and designated hitters. Middle infielders and catchers have rarely won the award, while outfielders, third basemen and (especially recently) relievers have received their share. Besides the dominance of starting pitchers, the most striking stat is the prevalence of designated hitters winning the award. While they make up only 11.32% of total winners, it is important to keep in mind that DHs have only been eligible to win 45 potential awards (the number of awards given in the American League since the establishment of the DH rule), so they have won 26.67% of the awards for which they have been eligible, a shocking number for players that only add value on one side of the ball.
Possible explanations for the dominance of certain positions may lie in other factors. Since the award has typically been given based on offensive production without as much regard for defensive value, it makes sense that players at bat-first positions would win the award more frequently than those at defensively oriented positions. Additionally, catchers typically accrue fewer plate appearances than players at other positions, and therefore have less opportunity to accumulate shiny counting stats than designated hitters. Another possible explanation may lie in the fact that a history of prior success is typically a prerequisite to win the award, and that older players are more likely to have an extensive track record of success. Since the award leans toward older, more experienced players, the award is more often given to players at less valuable defensive positions because players tend to move down the defensive spectrum as they age, so more older players are occupying less valuable positions while younger guys handle the tougher assignments. There are certainly other possible explanations for this trend, but some combination of these factors may play a part in the trend of bat-first players winning the award.
It may be tougher to explain the dominance of starting pitchers winning the award. It’s possible that pitcher success may be more subject to season-to-season volatility than hitters (while I haven’t been able to find any statistical studies proving this, it may be an interesting area of future research I’m considering pursuing). Another explanation might lie in the fact that every team typically rosters five starting pitchers and only one starter at each offensive position, but the difference seems stark enough at positions like catcher and shortstop that this seems unlikely. Maybe more pitchers suffer major injuries, causing them to miss significant time? There seems to be some credence to this theory, as only 13.11% of hitters played between 0 and 10 games in their down season, while 20.51% of starters pitched 5 or less games. It’s also possible that the sample still isn’t big enough and that this positional skewing is largely due to random variation. Whatever the case, it seems fair enough to weigh this trend at least a little bit going forward, so in predicting possible 2018 winners we’ll give the edge to starting pitchers, first basemen, and designated hitters.
Team Success
A final factor that has seemingly been of some importance in winning the award has been team success. While nothing about the award necessitates that the player plays on a good team, CPOTY winners have disproportionately come from winning teams. The following table displays some important statistics in terms of team success for award winners, most notably the mean and median team winning percentage, along with the percent of award winners playing on teams with certain win benchmarks. A .615 WP is roughly 100 wins over 162 games, .585 is 95, .555 is 90, .525 is 85, and 81 is .500.
| Team Success | |
| Mean WP | 0.537594 |
| Median WP | 0.552 |
| % over .615 | 6.60% |
| % over .585 | 16.98% |
| % over .555 | 50.00% |
| % over .525 | 68.87% |
| % over .500 | 78.30% |
As you can see, both the mean and median winning percentages for teams featuring a comeback player significantly exceed .500 and exceed it by enough that this difference can’t simply be attributed to the contributions of the comeback player in most cases. Even more strikingly, nearly 80% of winners played for teams that finished over .500, and nearly 70% of winners played for borderline playoff contenders or better (85+ wins). The histogram below illustrates the distribution of team winning percentage for players winning the award since its inception:
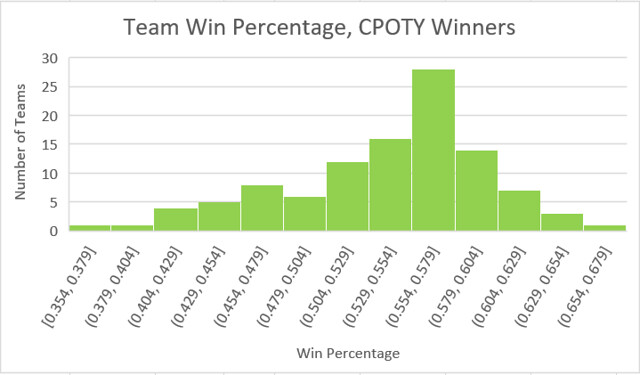
The data is fairly skewed left, with very few award winners playing on truly terrible teams and a very large portion of CPOTY winners playing for teams in the 89 to 94 win range. While it is true that there aren’t necessarily a ton of winners on elite teams, I think it might be fair to chalk that up to the fact that are simply less elite teams than just good teams, so it isn’t that players on elite teams are less likely to win, just that there are less elite teams than good ones historically.
There’s no way to definitively answer why the award voting swings so heavily towards players on winning teams, but the data shows that this is indeed the case. Maybe voters believe that playing on a good team is part of a good comeback. It’s possible that players having bounceback seasons on winning teams are just more visible than those playing on teams going nowhere and therefore unfairly benefit in the voting. Another possibility is that voters are still relying on team-dependent stats like runs scored, runs batted in, pitcher wins, and saves, and guys on worse teams have less opportunity to rack up these stats. Perhaps there’s another driving reason, but clearly the award has historically favored guys playing on winning teams.
After combing through the data, a few characteristics of CPOTY winners have stuck out. A pattern of solid value->drop in value->return to solid-to-excellent-value stands out, as does the recent trend of awarding the CPOTY award to a player returning from injury. An ideal CPOTY candidate would also play on a projected contender and be a starting pitcher, first baseman, or designated hitter. While a player doesn’t necessarily need to meet all of these criteria to win the award and there are some good candidates who don’t (Greg Bird, Mark Trumbo, Dansby Swanson, Alex Reyes, Carlos Gonzalez, etc.), these characteristics have certainly been favored in the voting. Now it’s time to delve into the question of what players might have a good shot at taking home a comeback player of the year award next year.
After looking through the aforementioned group of 23 hitters and 12 pitchers, I decided to cut the sample down some by removing guys that aren’t really ticketed for regular duty next year, don’t project especially well, or never really broke out in the first place. This removed an additional six hitters, leaving 17 hitters and 12 pitchers. The following table further details each player’s candidacy in each of the criteria discussed earlier, sorted by position (Team W% is projected for 2018):
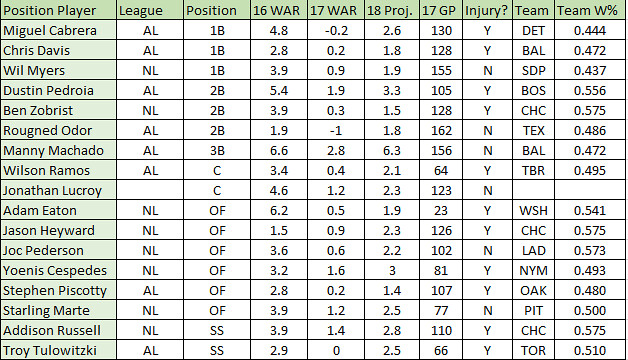
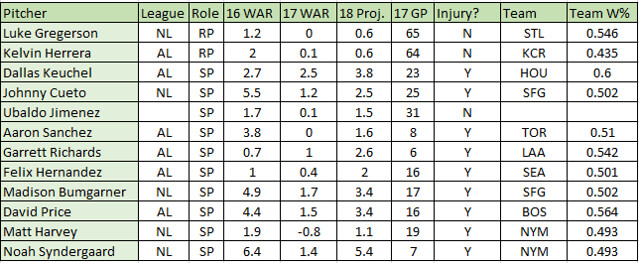
Just looking at the two lists, they seem like pretty good groups of names for CPOTY contenders. Davis, Cabrera, Machado, Ramos, Hernandez, and Price especially stick out in the AL, while Eaton, Syndergaard, Cueto, Bumgarner and Cespedes seem like good bets in the NL. Personally, I’d lean towards Syndergaard in the NL and Machado (or Cabrera if Machado is dealt to the NL) in the AL. It’s certainly possible that the award winners this year don’t come from these lists, but based on historical trends, these 29 players seem like solid favorites to take home the Comeback Player of the Year award in 2018.
FanGraphs leaderboards and player stats, Baseball Reference Player Pages, and Wikipedia for injury new were heavily used to do research for this post.
Great stuff! With regards to injuries, does the severity of the injury make a difference in the likelihood to win the award? For example Player A coming back from major surgery vs Player B who went on the DL multiple times throughout the year with a nagging injury but missed a similar amount of time without major surgery.