Using Clustering To Generate Bullpen Matchups

In today’s game, reliever usage may be more important than ever. As starters go less deep into games, more emphasis is placed on bullpen strategy to survive the mid-to-late innings. Teams can use data to streamline this process, strategizing relief pitcher usage based on their pitch repertoires and batter ability. My goal is to produce a matchup tool that can potentially give us some insight as to how the big league teams “play the matchups.”
The basis of a bullpen matchup recommender will be at the pitch level: what types of pitches does a particular hitter struggle against, and how do they align with what a particular pitcher throws? To do this, I will first use clustering methods in order to redefine pitcher arsenals based on pitch flight characteristics. Matchups will then be selected according to which pitcher is expected to perform the best against a given batter, optimizing pitcher strengths against batter weaknesses.
Data
To conduct this research I used available Statcast data from 2016-2021 (through this year’s trade deadline). My variables of interest are as follows: pitch location (plate_x & plate_z), perceived pitch speed derived from release extension (effective_speed), pitch movement (pfx_x & pfx_z), spin rate (release_spin_rate), and the newly introduced spin axis (spin_axis). I elected to include spin axis in order to account for how the batter may see the pitch as it’s released. All in all, the variables selected measure the stuff and location of each pitch so that we may classify them more accurately beyond the basic pitch type labels. After cleaning this dataset and removing outliers, I was ready to move on to the modeling process.
Clustering with Gaussian Mixture Models
Using pitches from 2016-2021, I trained a Gaussian Mixture Model to form the pitch clusters. I elected to use GMM because it is a more flexible clustering algorithm and can provide a better fit than a popular tool like K-Means in some situations. A mixture model works by finding a combination of Gaussian distributions that best fits the dataset. As a result, the model derives the probability that a pitch will fall into a particular cluster rather than simply assigning the pitch to the closest one. Due to the higher dimensionality and overlap present in the dataset, it made sense to go with a soft clustering algorithm.
In order to speed up run time and create more well-defined clusters, I first partitioned the data into groups based on pitcher handedness and pitch type. This would allow me to skip one step in the clustering process by grouping pitches that we already know are similar to each other. Here were the partitions I settled on:
Fastball: FF
Moving Fastball: FT, SI
Slider/Cutter: SL, FC
Curve: CB, KC
Off-speed: CH, FS
After standardizing each variable to put them all on the same scale, I tested a number of different potential cluster values for each pitch group, selecting the optimal values using the elbow method. GMM clusters can be evaluated using the Bayesian Information Criterion (BIC). The BIC gives us a sense of how good the clusters are at predicting on the given data. Evaluating the change in BIC from one number of clusters to the next, the optimal value is selected at the “elbow point.” After the elbow point is where the change in BIC starts to plateau and become nearly constant, meaning that subsequent increases in the number of clusters only provide subtle improvements in accuracy.
Each cluster should have characteristics representative of a certain style of pitch. Below are the clusters visualized for RHP four-seamers. Each variable is normalized to be on a 0-1 scale, so points closer to the edges of the radial plots represent larger (positive) values for a particular variable. For instance, Cluster 6 can be understood as high-velocity, low-spin four-seamers with a lot of vertical movement, located primarily outside to right-handed batters. (Click to enlarge.)

Matchup Recommender
Now that I have classified every pitch into a cluster, I can proceed with creating matchups. In order to avoid small sample issues, I only included pitchers with at least 250 batters faced and hitters with at least 100 PA vs. both left-handed and right-handed pitching (since 2016). I used run values in order to measure batter success at the individual pitch level.
However, in order to strip out context from these run values, I took the following steps: for non-BIP outcomes, I used the average run expectancy change of the corresponding event (i.e. a swinging strike was assigned the average change in run expectancy of all swinging strikes in the dataset as its estimated run value). For BIP outcomes, I used a linear regression of run expectancy change against exit velocity and launch angle in order to award outcomes based on quality of contact. I will denote these values as eΔRE (estimated run expectancy change) for short.
After deriving an estimated run value for each pitch, I computed each batter’s eΔRE per 100 pitches in each cluster. This would help better describe which areas hitters succeed or struggle in. I also computed the pitch distribution across all clusters for each pitcher. This would give a more complete depiction of their arsenal.
Given a hitter’s eΔRE/100 in each cluster and a pitcher’s distribution, predicted outcomes would be defined by multiplying the distribution against the batter’s performance. Aggregating these values would result in a predicted performance per 100 pitches if the batter were to face the particular pitcher’s distribution. As an example, suppose there are three total pitch clusters, and a batter has the following eΔRE/100 numbers: -1 (Cluster 1), 2 (Cluster 2), -3 (Cluster 3). Now suppose a pitcher throws 60% of his pitches in Cluster 1, 30% in Cluster 2, and 10% in Cluster 3. The expected outcome would be computed as:
0.6*(-1) + 0.3*(2) + 0.1*(-3) = -0.3
Thus, we would anticipate the batter to achieve a -0.3 eΔRE/100 if he were to only see this pitcher.
Bullpen Tool in Action
Here is a good sample of how this works: If Miami went to their bullpen to face Joc Pederson, now an Atlanta Brave, what would an ideal matchup be for them?
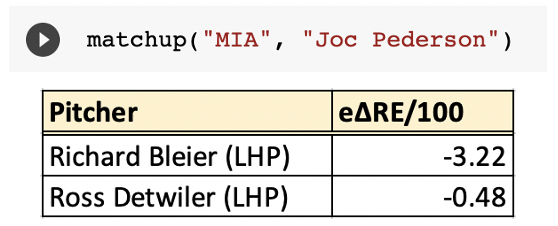
The top candidate would be Richard Bleier. Pederson’s struggles against lefties are well known, so intuitively this makes sense. In particular, he has not had much success against sliders down and away.
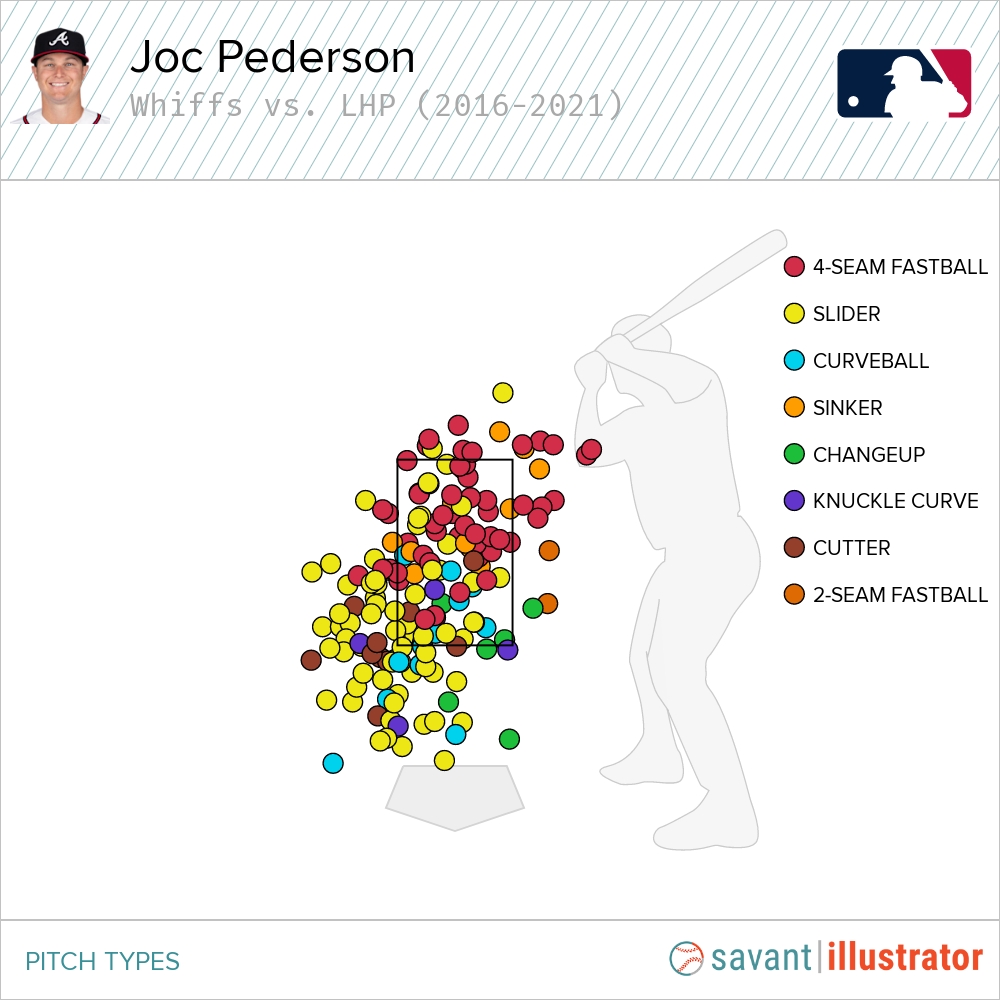
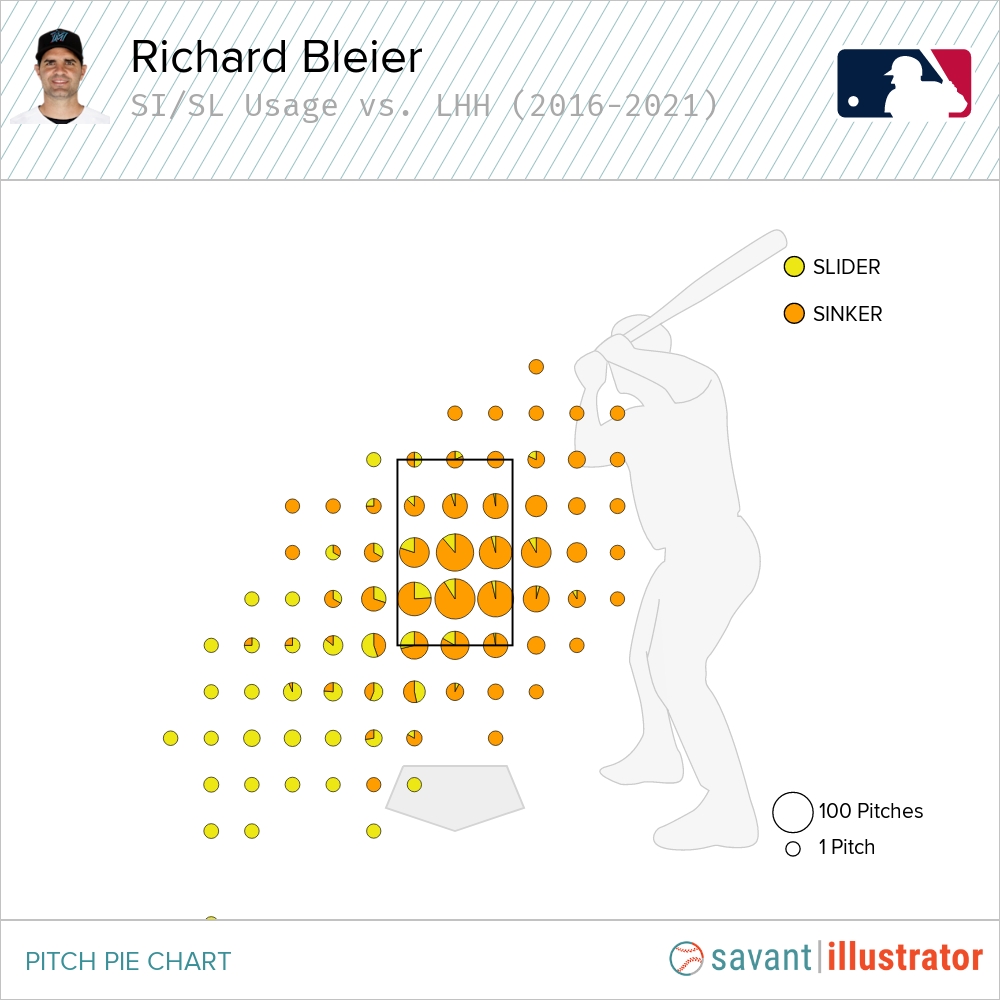
This seems like a good spot for Bleier, who utilizes a sinker-slider combo that could play well against Pederson’s weaknesses. He throws a lighter-than-normal slider (79 mph), and both pitches have excellent vertical movement.
Need a Ground Ball? Or a Strikeout?
Matchups can also be selected based on the desired outcome. I created separate ground ball and whiff models using the Ball Tree Algorithm. The Ball Tree works by clustering data points into “balls” based on their distance between each other. Ultimately, batter-pitcher profiles will be matched up using this nearest neighbor technique – each player will be represented by a point in the 98-dimensional space (98 represents the total number of clusters that I created across all pitch types), and the closest points to the batter represent the most similar profiles. In this case, a batter’s profile is defined by his GB% (Or Whiff%) in each cluster. The optimal pitchers are then chosen based on how their pitch distribution across clusters lines up with these batter profiles.
As an example of the ground ball model put into practice, let’s say we have a double-play situation during an intense Dodgers-Padres game. Who would LA want to bring in to face Eric Hosmer, the lefty known to be grounder-prone?

Scott Alexander would appear to be the right choice! The left-hander has the second highest GB% among relievers over the past five years (69.7%).
* The “NN-Distance” column represents the nearest neighbors output of the BallTree. Scott Alexander’s point was the closest to Eric Hosmer’s point with a nearest neighbor distance of 6.24.
Case Studies
While these seem like good examples in a vacuum, I would still like to know if my recommendations match up with teams’ actual in-game strategies. While I wish there was some sort of performance measure to quantify how logical this tool is, there are several nuances that complicate bullpen usage. For example, the best matchup for a particular hitter may not be feasible in a game because that pitcher was used on the day prior. The best matchup for a hitter may also wind up being the team’s closer, who is probably only going to be used in very specific situations. This is something I would definitely like to look into with access to play-by-play data.
Since I can’t analyze this problem on the whole, I elected to pick out a few instances where I could examine bullpen usage in a vacuum. I looked at games immediately following the All-Star Break so that each team would have a fully rested bullpen.
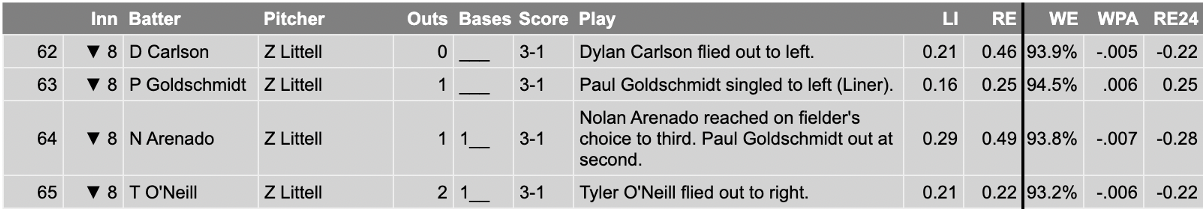
The first contest I selected was a July 17th game between the Giants and Cardinals. In the bottom of the 8th, Zack Littell came in to face the heart of the order in Dylan Carlson, Paul Goldschmidt, and Nolan Arenado. Was this a good matchup on paper? My tool seems to think it would mitigate some of the potential damage (Carlson not included due to low PA totals).
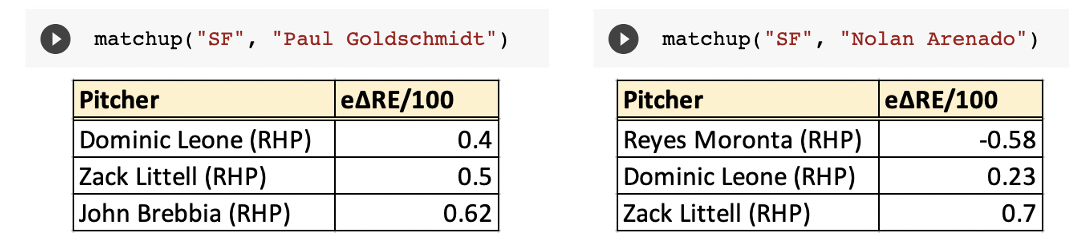
Although some hard contact was yielded, the result was a fairly harmless inning for San Francisco.
Another I looked at was a July 16th game between the Red Sox and Yankees. Domingo Germán was originally scheduled to start on the 15th (canceled due to COVID) and ended up being used out of the bullpen the following night. According to my tool, the Yankees were smart to send him out in the top of the 7th against the right-handed trio of Hunter Renfroe, Christian Vázquez, and Christian Arroyo:
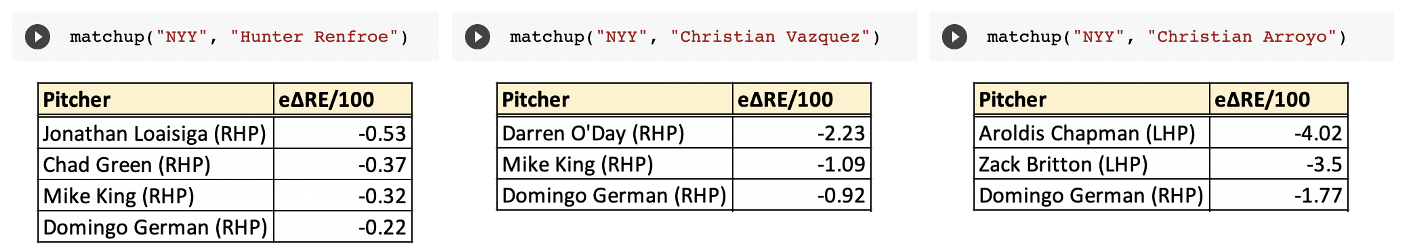
German also gave up a couple of hard hit balls, but the ultimate outcome was a clean inning. In both of these cases, the pitchers exited having increased win expectancy for their respective teams.

Future Work
Anecdotally, the matchup recommendations make sense. For the most part, platoon advantages are detected consistently and pitch arsenals align well with batter weaknesses. However, there is room for improvement. Due to the sheer volume of pitches contained in the dataset, there was a good amount of overlap between clusters. I could rethink the clustering methods as well as the number of partitions for each pitch group in order to improve cluster purity. Feature selection is also something I could potentially improve. I used pitch characteristics in addition to location in order to capture all facets of a pitch that could influence a hitter’s ability at the plate. Would a solely stuff-based model be more appropriate (i.e. excluding pitch location)? Are some variables less important in defining pitch clusters than others? These are some other topics to be investigated. All in all, I hope that this tool can give some sense as to how teams employ bullpens analytically.
Thank you for reading!
Interesting research with a functional tool. Really great work!
Well done, thanks for sharing!!!