The Season’s Least Likely Non-Homer
A little while back, I took a look at what might be considered the least likely home run of the 2016 season. I ended up creating a simple model which told us that a Darwin Barney pop-up which somehow squeaked over the wall was the least likely to end up being a homer. But what about the converse? What if we looked at the ball that was most likely to be a homer, but didn’t end up being one? That sounds like fun, let’s do it. (Warning: GIF-heavy content follows.)
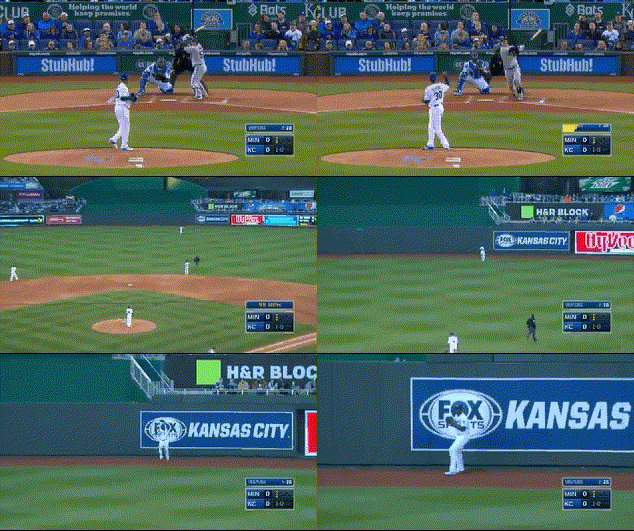
The easy, obvious thing to do is just take our model from last time and use it to get a probability that each non-homer “should” be a home run. So let’s be easy and obvious! But first — what do you think this will look like? Maybe it was robbed of being a home run by a spectacular play from the center fielder? Or maybe this fly ball turned into a triple in the deepest part of Minute Maid Park? Perhaps it was scalded high off the Green Monster? Uh, well, it actually looks like this.

That’s Byung-ho Park, making the first out of the second inning against Yordano Ventura on April 8. Just based off exit velocity and launch angle, it seems like a worthy candidate for the title, clocking in at an essentially ideal 110 MPH with a launch angle of 28 degrees. For reference, here’s a scatter plot of similarly-struck balls and their result (click through for an interactive version):

(That triple was, of course, a triple on Tal’s hill)
But, if you’re anything like me, you’re just a tad underwhelmed at this result. Yes, it was a very well-struck ball, but it went to the deepest part of the park. What’s more, Kauffman Stadium is a notoriously hard place to hit a home run. It really feels like our model should take into consideration both the ballpark in which the fly ball was hit, and the horizontal angle of the batted ball, no? Let’s do that and re-run the model.
One tiny problem with this plan is that Statcast doesn’t actually provide us with the horizontal angle we’re after. Thankfully Bill Petti has a workaround based on where the fielder ended up fielding the ball, which should work well enough for our purposes. Putting it all together, our code now looks like this:
# Read the data

my_csv <- 'data.csv'

data_raw <- read.csv(my_csv)

# Convert some to numeric

data_raw$hit_speed <- as.numeric(as.character(data_raw$hit_speed))

data_raw$hit_angle <- as.numeric(as.character(data_raw$hit_angle))

# Add in horizontal angle (thanks to Bill Petti)

horiz_angle <- function(df) {

angle <- with(df, round(tan((hc_x-128)/(208-hc_y))*180/pi*.75,1))

angle

}

data_raw$hor_angle <- horiz_angle(data_raw)

# Remove NULLs

data_raw <- na.omit(data_raw)

# Re-index

rownames(data_raw) <- NULL
# Make training and test sets
cols <- c(‘HR’,’hit_speed’,’hit_angle’,’hor_angle’,’home_team’)
library(caret)
inTrain <- createDataPartition(data_raw$HR,p=0.7,list=FALSE)
training <- data_raw[inTrain,cols]
testing <- data_raw[-inTrain,cols]
# gbm == boosting
method <- ‘gbm’
# train the model
ctrl <- trainControl(method = “repeatedcv”,number = 5, repeats = 5)
modelFit <- train(HR ~ ., method=method, data=training, trControl=ctrl)
# How did this work on the test set?
predicted <- predict(modelFit,newdata=testing)
# Accuracy, precision, recall, F1 score
accuracy <- sum(predicted == testing$HR)/length(predicted)
precision <- posPredValue(predicted,testing$HR)
recall <- sensitivity(predicted,testing$HR)
F1 <- (2 * precision * recall)/(precision + recall)
print(accuracy) # 0.973
print(precision) # 0.811
print(recall) # 0.726
print(F1) # 0.766
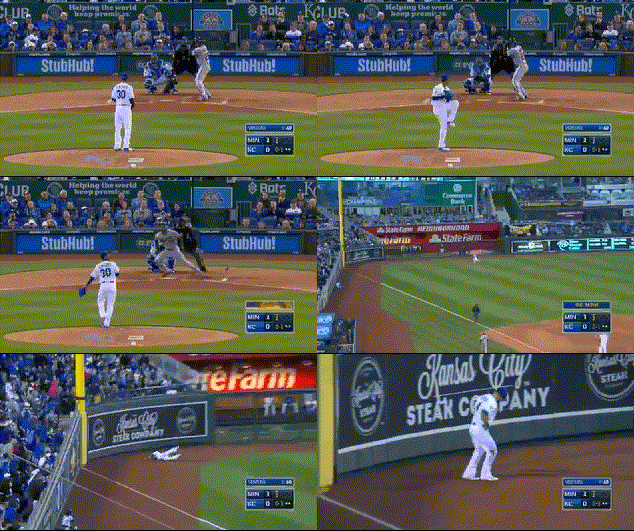
Great! Our performance on the test set is better than it was last time. With this new model, the Park fly ball “only” clocks in at a 90% chance of becoming a home run. The new leader, with a greater than 99% chance of leaving the yard with this model is ARE YOU FREAKING KIDDING ME

I bet you recognize the venue. And the away team. And the pitcher. This is, in fact, the third out of the very same inning in which Byung-ho Park made his 400-foot out. Byron Buxton put all he had into this pitch, which also had a 28-degree launch angle, and a still-impressive 105 MPH exit velocity. Despite the lower exit velocity, you can see why the model thought this might be a more likely home run than the Park fly ball — it’s only 330 feet down the left-field line, so it takes a little less for the ball to get out that way.
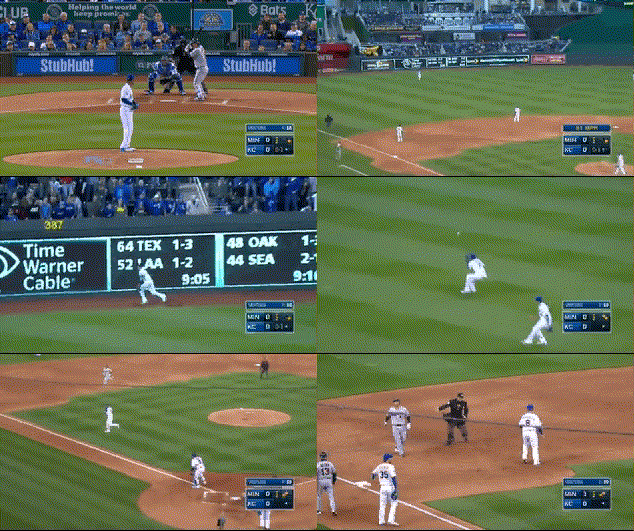
Finally, because I know you’re wondering, here was the second out of that inning.

This ball was also hit at a 28-degree launch angle, but at a measly 102.3 MPH, so our model gives it a pitiful 81% chance of becoming a home run. Come on, Kurt Suzuki, step up your game.
The Kudzu Kid does not believe anyone actually reads these author bios.
A+++
This is terrific, but is there any chance there was error in the data collected at the K / that day / that inning?
It seems more likely that there was a very strong wind blowing in that night, or some other atmospheric condition working to suppress HR.
There’s always the possibility of a statcast error, but the box score ( https://goo.gl/BJz1vM ) says there was a 17 mph wind blowing, and the Twins announcers mentioned it prominently as well. I’m also going to go out on a limb and say Yordano Ventura didn’t have his best stuff that inning.