The Launch Angle Revolution May Save Lives

It’s not news to anyone that being on the receiving end of a 100-mph fastball is an unpleasant experience, but it’s easy for players and fans alike to forget that this little projectile is in fact a deadly weapon. While the tragic death of Ray Chapman along with decades of bruises and broken bones have spurred hitters to don an array of protective items in the box, our baseball culture does not afford pitchers the same protections. This is despite the fact that batted balls regularly exceed the speeds of the fastest fastballs, and occasionally top 120 mph, which may approach the limits of human reaction times at that distance. Additionally, while hitters are selected for their superhuman eyesight and reaction skills, those attributes are generally less important for pitchers. The issue may be further exacerbated by the increasing emphasis on exit velocities in modern hitting analytics:
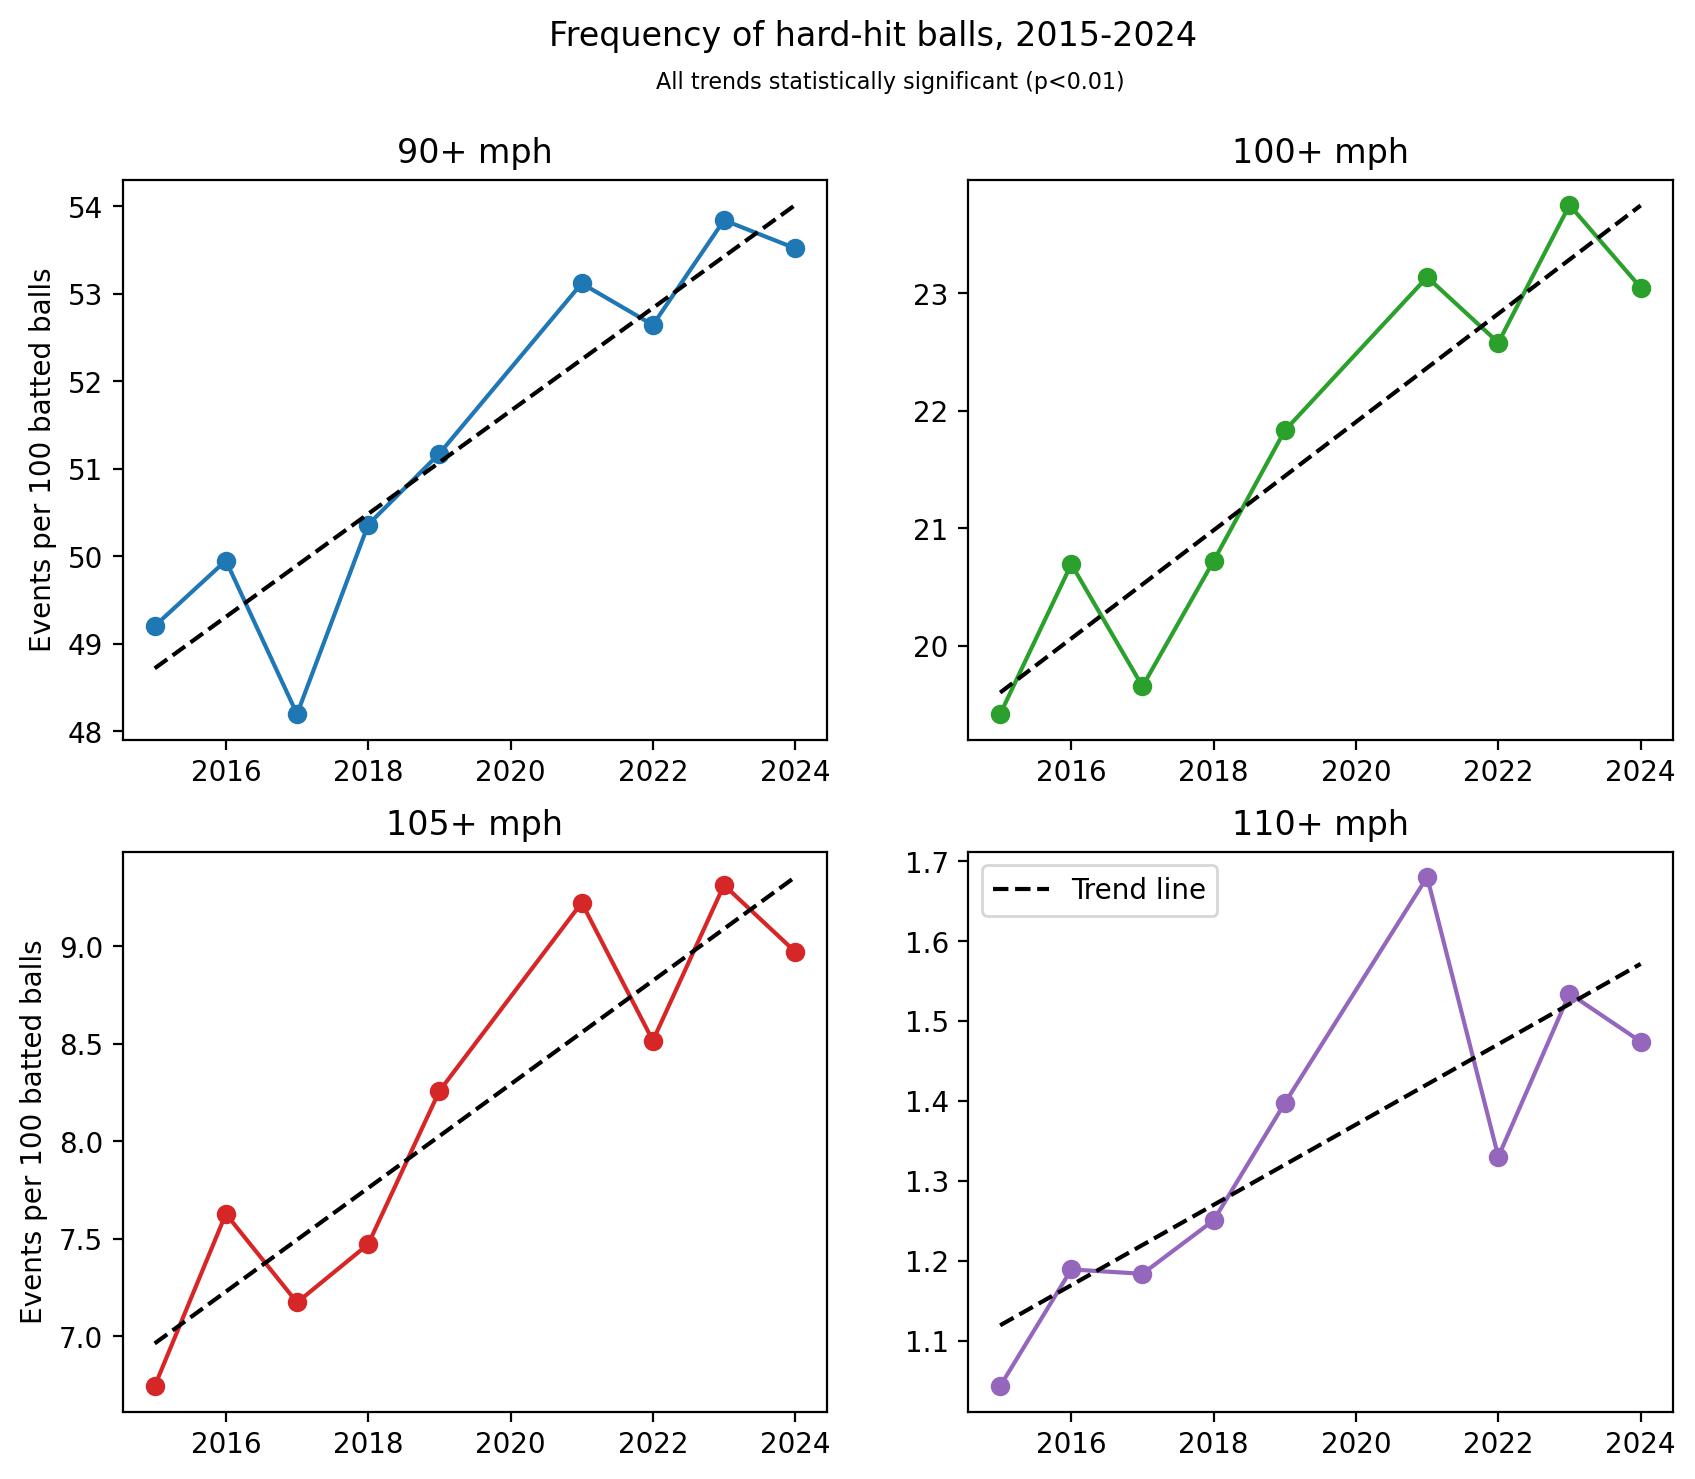
That’s a concerning chart. In particular, notice the difference in scales across the panels; while the frequency of batted balls with exit velocities of at least 90 mph has increased by 8.7% in this span, batted balls hit 110+ mph occur a full 41% more often now than they did in 2015! Let’s find out if this trend is putting our already-fragile pitchers at even more risk.
Counting Black Swans
The study of comebacker injuries is greatly complicated by the minuscule sample size of such events. Although Sports Info Solutions tracks pitcher comebacker events, only around 10 per year result in even a trainer’s visit to the mound. Impacts to the head are even rarer but most concerning, where a few inches can make the difference between what happened to Bobby Miller, when he was relatively unphased this spring after a glancing 105-mph blow to forehead, and Brandon McCarthy, who barely survived a line drive to the temple in 2012.
I tackled this problem instead by looking at the much larger sample of batted balls that had the potential to seriously impact a pitcher. If the rate of these dangerous batted balls has changed, we can assume the risk of actual injuries has changed by a proportional amount, even if our observations of actual injuries are too small to analyze. First, we need a definition of “dangerous” batted balls: It’s not perfect, but I settled on all line drives that pass within three feet of the average pitcher’s chest at follow-through. Since actually measuring the location of the pitcher’s chest is likely impossible with publicly available data, I opted to approximate the average pitcher’s follow-through as the point 55.5 feet from home plate and 4.4 feet above the ground. The former is roughly an average stride length away from the pitcher’s rubber, while I estimated the latter by pretending to throw a few pitches in my living room, measuring the position of my chest as a fraction of my standing height, and applying that to the average height of a major league pitcher, plus 5 inches for the height of the mound at that point. The three-foot buffer is to account for pitchers who veer away from this point after release, such as Andrés Muñoz:
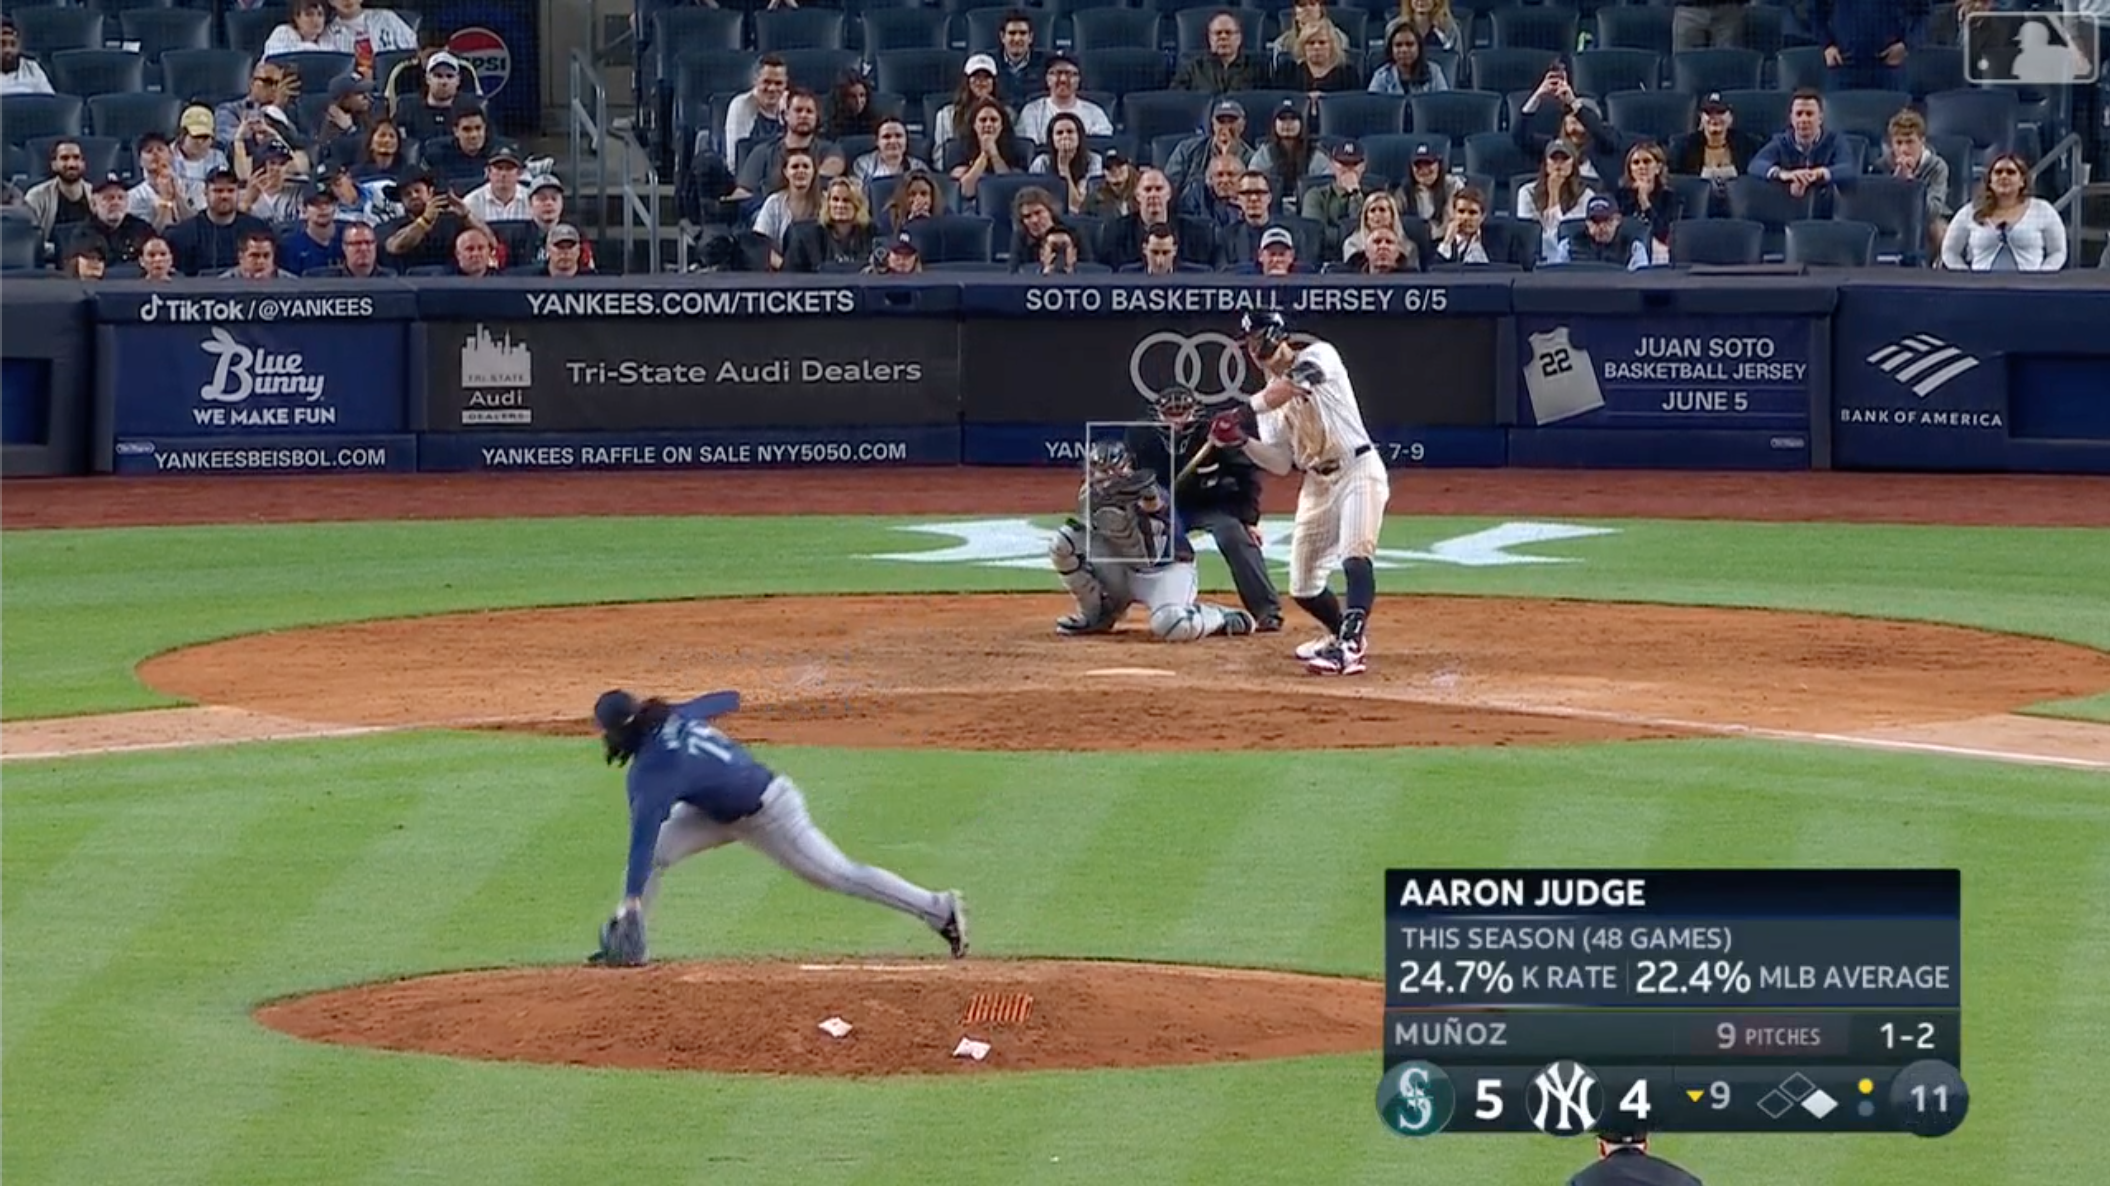
That’s not exactly the athletic fielding position I would choose to put myself in if I had to a dodge line drives off the bat of Aaron Judge, but that’s the risk you take to paint 101 mph on the black, I guess.
With a bit of basic trigonometry, we can cross reference this definition with the launch angle, spray angle, and exit velocity of every batted ball in the Statcast era to determine the ones that were potentially dangerous. The plot below shows — from the batter’s perspective — the most recent 50,000 batted balls in the major leagues through the end of the 2024 season, with at least 95-mph exit velocities colored blue, and “dangerous comebackers” of at least 95 mph colored red.
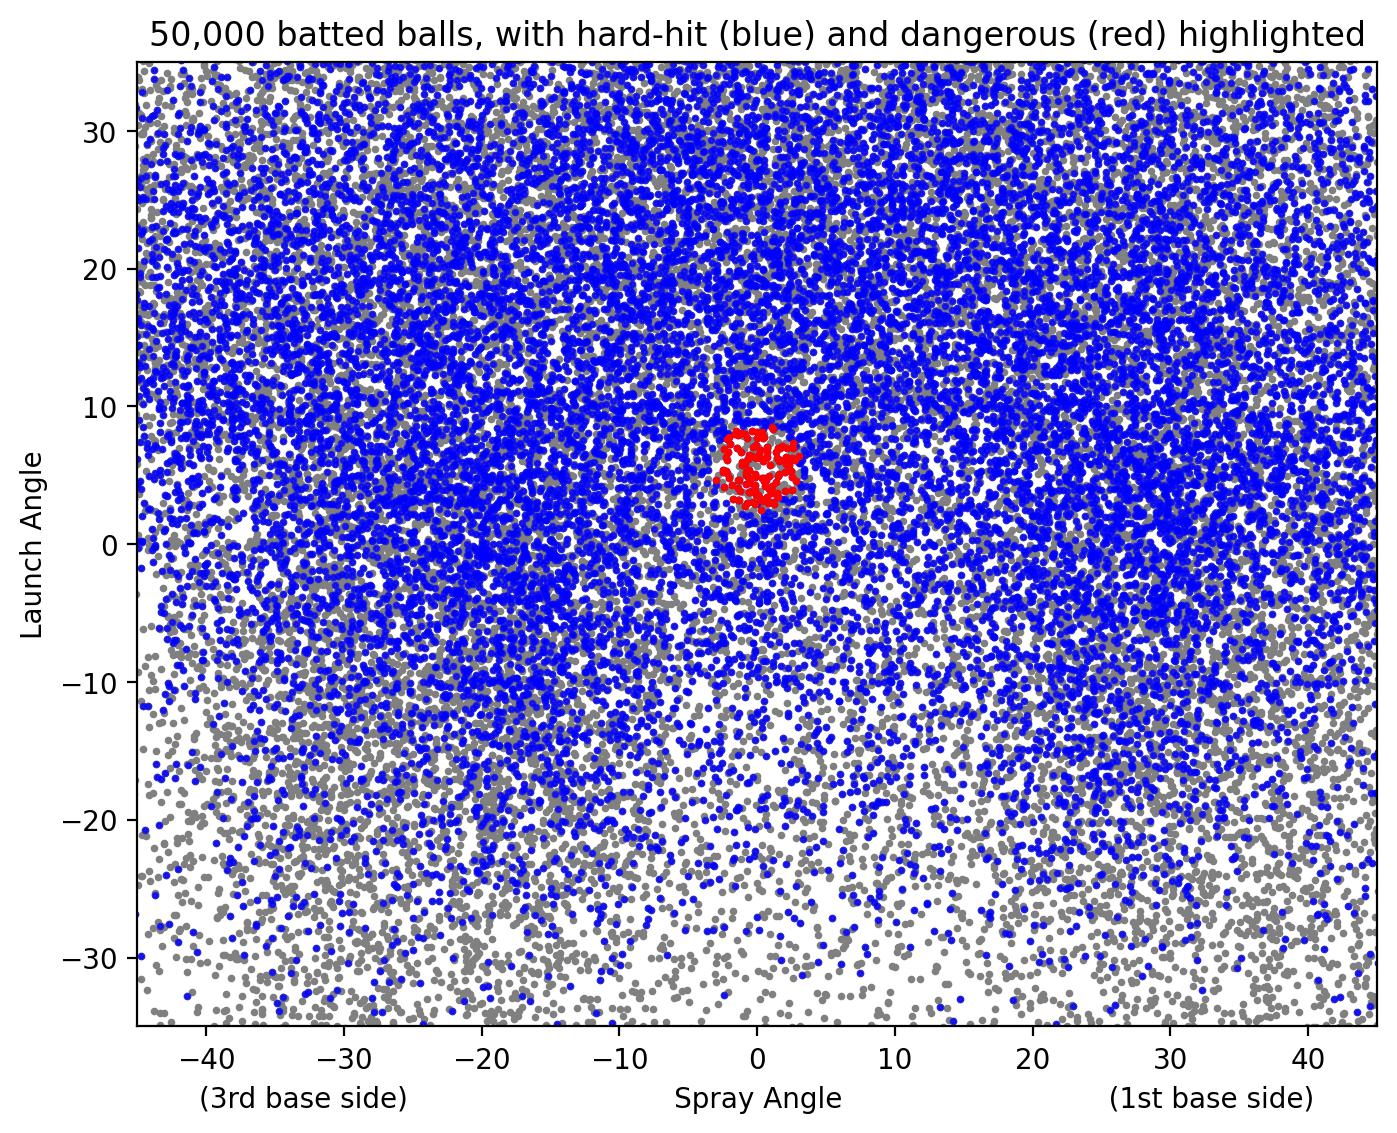
The danger zone is a small but not insignificant portion of the batter’s field of view and receives a fair share of hard-hit balls. It is centered at roughly a 5.5-degree launch angle to straightaway center field, which sounds about right intuitively. Let’s look at a few examples to ensure our definition is working as expected:
First up is a Giancarlo Stanton line drive from August 2, 2018. It had a 119.1-mph exit velocity, a 7-degree launch angle, a spray angle of -0.1 degrees, and it past the mound an estimated 1.4 feet from the average pitcher’s chest:
Pretty good! A taller pitcher could have been in danger from that one.
Next, we’ve got a Vladimir Guerrero Jr. rope from August 31, 2022, with a 118.4-mph exit velocity, a 4-degree launch angle, and a spray angle of -0.9 degrees. It missed the average pitcher’s chest by an estimated 1.8 feet.
Decent. I’d eyeball the spray angle as being a little wider than Statcast’s estimate, but it was still close enough that it could have hit a left-handed Andrés Muñoz. The spray angles are computed from the location that the ball first hits the ground, which in some cases is different from the spray angle off the bat, as sidespin on the ball causes it to cut or tail, but the effect is usually not too strong. Besides, I don’t believe Statcast gives us enough information to correct for it.
Our third example comes from Diamondbacks second baseman Ketel Marte. On April 2, 2025, he nearly nailed Yankees lefty Carlos Rodón in the hip with a 115.5-mph liner that had a 4-degree launch angle and a spray angle of -0.6 degrees, and it was an estimated 1.7 feet away from the average pitcher’s chest.
Fortunately, Rodón got just a bit of glove on it. It seems that the definition is working how we’d expect, so now let’s see what it can tell us.
Danger Over Time
When we apply this definition to the roughly one million batted balls that have been tracked by Statcast from all full-length seasons since 2015 (i.e., excluding 2020 and the current season), we get a few thousand characterized as dangerous; the exact number depends on which exit velocity thresholds we use. We’ll look at 90+ and 95+ mph today, since for higher thresholds the samples become too small, and we’re already slicing the data pretty finely by launch and spray angle. When we plotted over time, we find a surprising trend: The rate of dangerous comebackers has decreased by 25-30% since 2015!

This trend has fairly strong statistical significance (p=0.03 and 0.08 respectively) and a similar pattern for both exit velocity thresholds: a large decrease in 2015-2017, and a more mixed signal since then. If the rate of dangerous comebackers was determined mostly by the rate of hard-hit balls, we’d expect it to look more like the first figure in this piece, with a fairly consistent positive trend across time. Instead, we’re seeing both a different direction and shape.
Since this trend doesn’t seem to be explained by exit velocity alone, let’s look at our other two parameters, launch and spray angle. Here are the average launch and spray angles for all hard-hit balls (not just dangerous comebackers), with spray angle normalized for batter handedness so that pulled balls are indicated by positive spray angles:
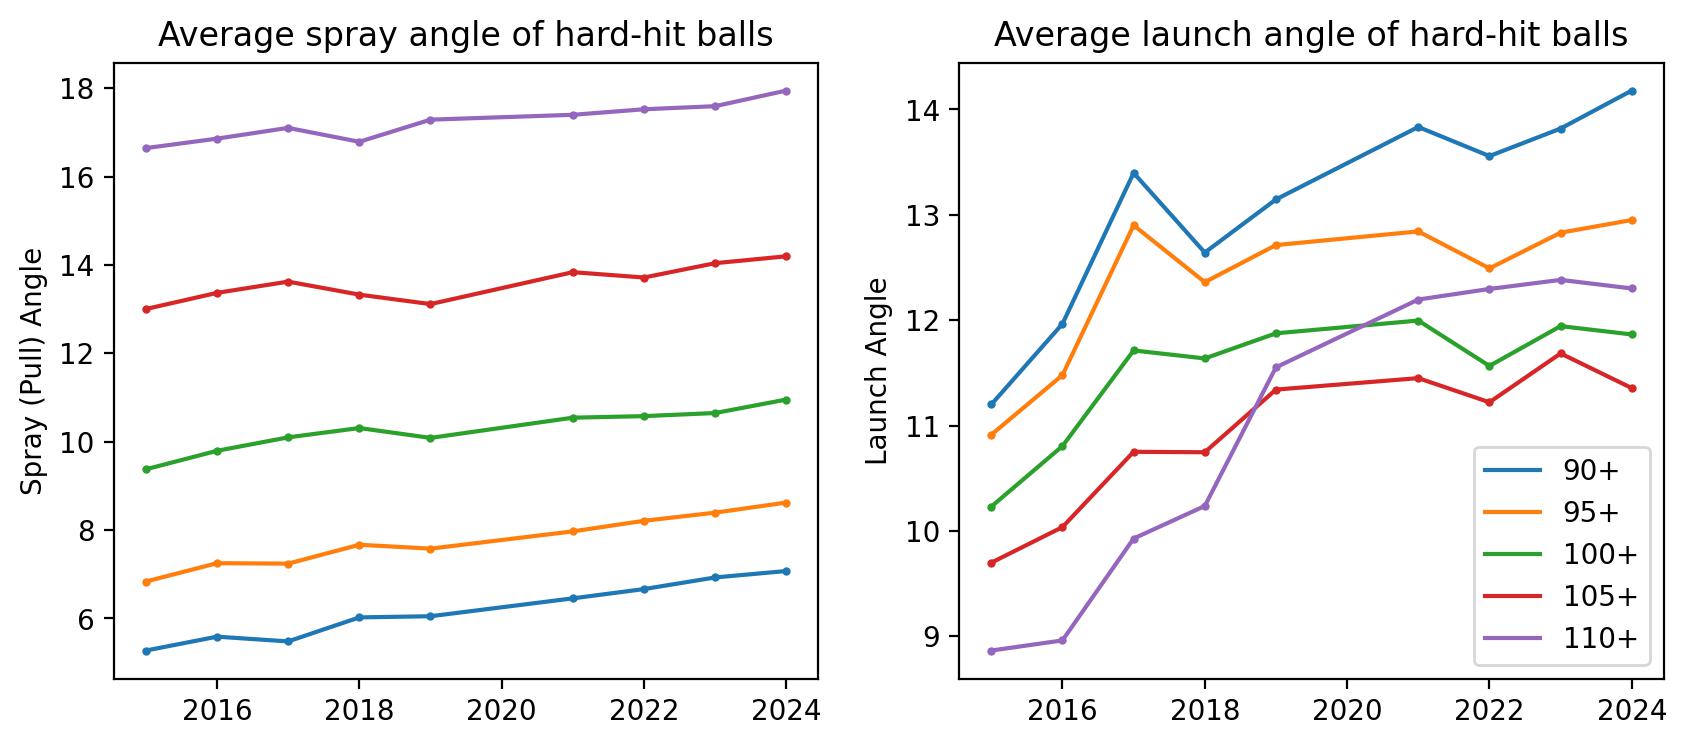
Recall that the danger zone was centered on a launch angle of 5.5 degrees and spray angle of 0 degrees. These data show that hard-hit balls, by any exit velocity definition, are on average being hit increasingly farther from this danger zone both horizontally and vertically. (All trends are statistically significant with p<0.03.) The largest change in launch angles occurred primarily during the 2015-2017 heyday of the so-called launch angle revolution, which explains the substantial decline in comebacker risk we found during that period, while the increasing pull tendency over time shows a slower yet steadier rise that is also contributing to the declining risk of dangerous comebackers.
Also notice from the spray angle chart that as exit velocity increases, so does the pull angle. As Davy Andrews wrote last June, pulling, launching, and hitting the ball hard are not independent phenomena, but are in fact deeply intertwined. As bat tracking technology now confirms, meeting the ball out in front (and therefore pulling it) allows for a faster bat speed at the point of contact, and thus a higher exit velocity. It also means meeting the ball farther along the swing’s trajectory, which results in a slightly vertical plane of attack and thus higher launch angles. These interrelated dynamics are visible in the swings of today’s top hitters.
Yet as these data show, an unintended side effect of this tendency is that it may also help shield pitchers from the most exceptionally dangerous comebackers; the harder a ball is hit, the more likely it is to be pulled and launched away from the vulnerable pitcher. With this context, giving up a couple extra cheap homers down the line to Isaac Paredes seems like a small price for pitchers to pay.
Lastly, one missing piece of this analysis is a deeper understanding of the relationship between comebacker velocity and risk. At the low end, a 50-mph comebacker is about as dangerous as a 60-mph comebacker (not at all). At the high end, however, I suspect risk increases exponentially, though to what degree I’m not sure. Is it 10% harder to avoid a 120-mph comebacker than one hit 100 mph? Twice as difficult? Ten times? Any of those could sound plausible to me.
The Shape of Comebackers To Come
While the data paint a positive picture of the trend in comebacker risk, the issue is by no means alleviated. Regardless of how rare it might be, it will take only one deadly line drive to prompt a day of reckoning in the sport. Sadly, this reactive approach to safety is standard operating procedure for baseball; it was only well after Ray Chapman’s death that batting helmets were mandated, and it similarly took the 2007 death of minor league first base coach Mike Coolbaugh for Major League Baseball to require helmets for base coaches as well.
It’s true that a few pitchers have used protective hats, but their perceived uncoolness has been the primary roadblock to wider adoption. However, history provides some optimism on this front; the arc of baseball is long, but it does bend toward safety. There was a time when catcher’s gear was considered unmanly and possibly unsporting, and yet today, catchers, batters, and even umpires wear an array of personalized body armors that show off individual style, flair, and personality. A similar shift in perception may eventually allow pitchers at least some degree of protection on the mound. Until then, it’s a morbid waiting game to see which happens first: a brave pioneer (perhaps Dodgers utilityman Enrique Hernández) makes pitcher safety cool, or a terrible injury occurs on the mound. By reducing the risk of such a tragedy until our hero arrives, it’s very possible that the launch angle revolution will save a life — or even already has.
The code I used to produce this analysis is available on Github here. You can reach me at laughingstock91@gmail.com
Insightful analysis, thank you!