As we start a new baseball season, I start a new season of my own. This is my first – of many I hope – analysis and write-up on baseball that I am submitting. I am an avid fan, a numbers geek, an aspiring writer and lastly a bored software engineer. I am also very fortunate. I have a close connection with a former major league player and the ability to leverage his vast experience and knowledge of the game. Hopefully, I can parlay the knowledge I have learned from many years of observation along with the knowledge I have gleaned from my connection to realize my goal as a contributor to the sabermetric community and to the enjoyment of baseball fans everywhere. Here we go!
Question
Is the effectiveness of a sinker dependent on from which side of the rubber the pitcher throws?
I was in Florida in mid March for spring training, talking with a minor league coach when he mentioned that he and a former all star pitcher were in a disagreement about how to throw a sinker. Their debate centers on where a pitcher should stand on the rubber to throw a sinker most effectively. We all understand that a pitcher should not move all over the rubber to become more effective on a single pitch. This would obviously tip off the hitters as to what type of pitch might be coming. But for argument’s sake, a team might have some newly transformed position players learning to throw different pitches. Wouldn’t a team want to know if, for some pitches, it was more beneficial to stand on one side of the rubber than another?
I consider myself a pretty observant guy, but I will have to admit that I never really paid much attention to where a pitcher stood on the rubber. To me the juicy part is watching the ball just after it is released. The dance, dip, duck and dive a pitcher is able to command of the ball is where the action is as far as I am concerned. So watching what a pitcher does before he even starts his motion was asking a little much. Nonetheless, I was certain that with so many pitchers in the majors, that a breakdown of data would show that there was not a singular starting point on the rubber. Every pitcher is different, right?
Setup
I started my analysis by downloading the last 4 years (2009-2012) of PitchFx data. Most of us know this already but by using PitchFx data there are some limitations to analysis. Unlike Trackman, PitchFx initially records each pitch at 50’ from home plate, not the actual release point of the pitch. For PitchFx this data point is called “x0”, and for all intents and purposes this is pretty good data, as for most pitchers their strides are approximately 5 to 6’ from the rubber, and with arms length added in we are talking about a difference of a couple of percentage points from being the same as the release point metric from Trackman. But full disclosure, it is not exactly the release point. Another factor that I didn’t measure is a pitcher’s motion to the plate. Some pitchers throw “across” their bodies and not down a straight line, and even fewer open up their body to the batter (stepping to stride leg’s baseline). Also, there is probably a bit to glean from going between the stretch and wind-up, but again without doing a very in-depth study I assume no factor in the analysis. Lastly, arm length is an unmeasured factor. For example, I didn’t check to see if there were any right-handed pitchers with extra long arms standing on the first-base side of the rubber distorting the data.
I started by combining the PitchFx Sinker (SI) and Two-seam fastball (FT) data into a single database. The reason to combine the data is due to the fact that the grips for each pitch are the same, combine this with a two-seam fastball can and a sinker break the same way (down and in to a RH batter from a RH pitcher), and lastly they are also somewhat synonymous in major league vernacular. Maybe somewhere along the line the pitch was invented twice (north or south), the name given is based on region like when asking for a Coke… it’s a “soda”, a “pop”, or a “tonic” depending on where you are in the states. Maybe in the South it was labeled a sinker and the North it was taught as a “two-seamer”? Either way it’s the same pitch as far as I am concerned, and the etymology of pitch naming is a different topic for a different time.
Back to the question above about every pitcher being different, I was wrong. Using the 2012 data I created a frequency distribution for right-handed pitchers (figure 1), and as you can see there is definite focal area at around -2’ point from the centerline of the pitching rubber (and home plate).
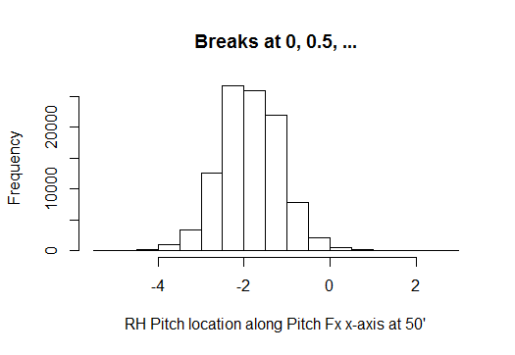
Figure 1 – Right-handed pitchers in 2012
This shows that most pitchers start from about the same side; which I determined to be the right side of the rubber (3rd base side). I determined this by adding 9” to one-half the length of the pitching rubber (24”) which comes to 21” (9”+12”). Add in arm length and you can see that using an x0 that is less than or equal to 2’ (remember we are using negatives here) should prove that the pitcher is throwing from the right side. I would like to add that the 9” used above is based on the shoulder width of an average man, which is around 18”. This metric is based on studies on the “biacromial diameter” of male shoulders in 1970 (pg. 28 Vital and Health Statistics – Data from the National Health Survey). I think we can all agree that the 18” is probably conservative by today’s growth standards. I mentioned in the limitations of the analysis written above, I don’t account for arm length or pitcher motion. Therefore I needed to make sure that there are right-handed pitchers who are throwing from the left hand side of the rubber; just not a bunch of super long-armed, cross bodied throwers. With the data in hand I was able to identify which pitchers had thrown the ball closer to centerline of the rubber and therefore would be good candidates for standing on the left side of the rubber. The first pitcher who had a higher (>-2) x0 value was Yovani Gallardo of the Milwaukee Brewers. Without knowing Gallardo’s motion I needed to go to the video. From the video, you can clearly see that Gallardo starts on the left side of the rubber and throws fairly conventionally, straight down the line to the batter.
I wanted to keep this as simple as possible, breaking up the pitchers in two categories – Left side or Right side. Without looking at video for each pitcher I had to come up with a tipping point for classifying the side based on the x0 data I had available. If we simply take what we determined above and correlate it to the left hand side we will come up with 1 (starting on left side of rubber) and an x0 of 0. But it isn’t quite that simple. The frequency chart shows that there are less than 1000 balls thrown in 2012 with an x0 greater than or equal to 0. Gallardo threw 504 pitches himself in 2012. So we have to increase the scope a bit. By arranging the x0 data into quartiles we see that upper or lower quartile – depending on handedness – is around -1 or 1 (remember we are using negatives) so for a right handed pitcher the x0 splits are:
|
Min
|
25%
|
Med
|
Avg
|
75%
|
Max
|
|
-5.264
|
-2.315
|
-1.868
|
-1.849
|
-1.372
|
2.747
|
For left handers:
|
Min
|
25%
|
Med
|
Avg
|
75%
|
Max
|
|
-3.787
|
1.455
|
1.953
|
1.924
|
2.401
|
5.378
|
As I am trying to stay conservative, and the fact that these are not release point numbers I use 1 and -1 as the cut off for classification based on the handedness of the pitcher. Using these numbers provided a pretty clean break in the distributions (90-10%).
Findings
So who was right, the all star pitcher or the minor league pitching coach? Is there an advantage depending on where the pitcher stands on the rubber? Neither – both of them. It’s a tie.
What can I say; my initial analysis is a bit anticlimactic, but not because of lack of effort. To denote the labels below:
- LH or RH (Handedness)
- RR or LR (Right or Left Rubber)
- B – Balls
- K – Strikes
- P – In play (No Outs)
- O – In play (Outs)
- BackK – Called Strikes
- FT – Two seam fastballs
- SI – Sinkers
- Efficiency – O/(P+O)
- XSide – Cross Side (i.e. RH-LR or LH-RR)
- Same side – LH-LR or RH-RR
| LHData |
194487
|
pitches |
|
|
|
| LH_LR |
173145
|
89.03%
|
LH_RR |
21342
|
10.97%
|
| LH_LR_B |
62957
|
36.36%
|
LH_RR_B |
7932
|
37.17%
|
| LH_LR_K |
75241
|
43.46%
|
LH_RR_K |
9067
|
42.48%
|
| LH_LR_O |
22610
|
13.06%
|
LH_RR_O |
2843
|
13.32%
|
| LH_LR_P |
12335
|
7.12%
|
LH_RR_P |
1500
|
7.03%
|
| LH_LR_FT |
108600
|
62.72%
|
LH_RR_FT |
15846
|
74.25%
|
| LH_LR_SI |
64545
|
37.28%
|
LH_RR_SI |
5496
|
25.75%
|
| LH_LR_BackK |
34932
|
46.43%
|
LH_RR_BackK |
4406
|
48.59%
|
|
|
|
|
|
|
| RHData |
473032
|
pitches |
|
|
|
| RH_LR |
48791
|
10.31%
|
RH_RR |
424241
|
89.69%
|
| RH_LR_B |
18266
|
37.44%
|
RH_RR_B |
153014
|
36.07%
|
| RH_LR_K |
20486
|
41.99%
|
RH_RR_K |
180611
|
42.57%
|
| RH_LR_O |
6453
|
13.23%
|
RH_RR_O |
58895
|
13.88%
|
| RH_LR_P |
3583
|
7.34%
|
RH_RR_P |
32459
|
7.65%
|
| RH_LR_FT |
21781
|
44.64%
|
RH_RR_FT |
194582
|
45.87%
|
| RH_LR_SI |
27010
|
55.36%
|
RH_RR_SI |
229659
|
54.13%
|
| RH_LR_BackK |
10520
|
51.35%
|
RH_RR_BackK |
82482
|
45.67%
|
|
|
|
|
|
|
| Xside |
667519 |
pitches
|
Same Side |
|
|
| LH_RR&RH_LR |
70133
|
10.51%
|
LH_LR&RH_RR |
597386
|
89.49%
|
| LH_RR&RH_LR_B |
26198
|
37.35%
|
LH_LR&RH_RR_B |
215971
|
36.15%
|
| LH_RR&RH_LR_K |
29553
|
42.14%
|
LH_LR&RH_RR_K |
255852
|
42.83%
|
| LH_RR&RH_LR_O |
9296
|
13.25%
|
LH_LR&RH_RR_O |
81505
|
13.64%
|
| LH_RR&RH_LR_P |
5083
|
7.25%
|
LH_LR&RH_RR_P |
44794
|
7.50%
|
| LH_RR&RH_LR_FT |
37627
|
53.65%
|
LH_LR&RH_RR_FT |
303182
|
50.75%
|
| LH_RR&RH_LR_SI |
32506
|
46.35%
|
LH_LR&RH_RR_SI |
294204
|
49.25%
|
| BackK |
14926
|
50.51%
|
BackK |
117414
|
45.89%
|
| Efficiency |
|
64.65%
|
Efficiency |
|
64.53%
|
The efficiency is so very close. Twelve-hundredths (.12) of a percent is not a lot – 169 outs out of 140678 – but give any Chicago Cub fan five of those outs in 2003 and Mr. Bartman would be an afterthought. Which, I am sure is the way he and all Cub fans around the world would like it. The efficiency is the same, no other way to put it which is the beauty of statistics and sabermetrics. Numbers can say so much, even when they are the equal.
But the analysis wasn’t all for naught, there are some nuggets to glean from the numbers above. As a segue, I am currently watching Derek Lowe of the Texas Rangers pitch on opening night and from the left side of the rubber he throws a sinker and it dips back over the rear part of the plate for a called strike. With all of the similarities within my analysis the most striking observation is the difference in called strikes depending on the side of the rubber. If a pitcher, coach or manager could get a strike or a strike out without the fear of having a batter get a hit or moving a runner forward they would do it every time. With a five percent difference in getting a strike and not having the worry of the ball being put into play would be an interesting thing to know in some tight situations with runners on base. My thought on the difference revolves around the back door being open a little wider when it comes to getting called strikes. With a pitcher throwing X-side you can definitely see a pattern of called strikes on the same side of the plate from which the pitcher throws from. Positive numbers in figures below indicate right side of plate (1st base side)
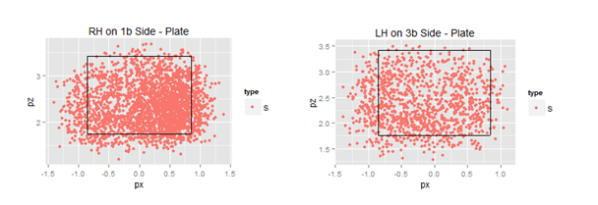
With today’s specialization where pitchers are matched up to batters based on handedness, the ability for a pitcher to throw a strike as it tails back over the plate or close to the plate (or maybe not even close for some of the pitches above ) is essential. It appears that umpires are a little more flexible with their perception of the strike zone for these pitchers as well.
Closing
I didn’t get the results that I anticipated when I started this analysis, and that is great! As a society we are determined to have a winner! Just as there is “no crying in baseball”, there are no ties in baseball. Even when there is a tie; like on a close play at first – it proverbially goes to the runner. We can’t settle for a tie…. hockey reduced ties by adding a shootout after overtime. College football removed the tie by introducing sudden death (hopefully the bowl playoff with help eliminate the subjective BCS tie). With no clear cut advantage (read – TIE) identified in my analysis means that a more in depth analysis could/should be performed to validate. Maybe expanding the percentage of X-side pitchers to 15-20, or identifying when pitchers are throwing from the stretch and removing those instances would alter the results and provide a much needed winner? If after all analytical statistical avenues have been exhausted there’s still not a proven advantage, we can always resort to having the coach and player settle it with a coin flip?




