Archive for Mark Reynolds

The Bad Aaron Judge Comps

Aaron Judge is good.  Some might say he is great.  The front-runner for AL Rookie of the Year and MVP is the face of MLB for 2017, but the face of MLB for the future?  Unfortunately, maybe not.

It’s hard to find something negative to say about the New York Yankees right fielder, but in order to play devil’s advocate and not get our hopes up too high about Aaron Judge, just in the event that he has a down season, I was able to find some rather unflattering comps for the slugger.

First, there’s his minor-league career.  Aaron Judge was a pretty good prospect ranking first in the Yankees’ system in 2015 and 17th in baseball according to MLB Pipeline.  However, just because a prospect is ranked highly does not mean they are without flaws.  Judge would strike out in at least 21 percent of his plate appearances in all levels in the minor leagues.  This article from 2016 even identified Judge’s proficiency to strikeout:  

Judge’s Triple-A debut at the end of 2015 did not go well. He slashed .224/.308/.373, well below both his career levels and expectations. More alarming, he struck out a career high 28.5-percent of the time (74 times in 260 plate appearances). [The 2016 season] has been more of the same. His batting average is a bit deceiving sitting at .284 (heading into this weekend), considering he currently has a nice .354 BABIP compared to last seasons .289. His plate discipline is troubling.

Perhaps the lofty expectations of Judge have him pressing. You simply can’t overlook the fact that his strikeout rate is nearly identical to the small sample size of last season’s Triple-A numbers (27.2-percent). It has to be at least a slight bit worrisome that this is a trend and not a slump. His walk right is dropping daily to a new career low (6.8-percent or eight walks in 103 plate appearances).

The article seems to point to his plate discipline as his main flaw — as other evaluators have — but is overall positive with his prospect status.  But his strikeout tendency should not be overlooked.  He has failed to improve on that statistic in his short major-league career, where he has struck out in 32 percent of his plate appearances between his call-up in 2016 and now.  However, because he also takes his walks, his walk percentage is rather high, which puts him in exclusive company.

Since 2000, there have only been four players with at least 300 plate appearances who have struck out in over 29 percent of their plate appearances and walked in at least 16 percent of them: Jack Cust (2007, 2008, 2010, 2011), Ryan Howard (2007), Adam Dunn (2012), and Aaron Judge (2017).  All of these seasons resulted in wRC+ well above 100, which means that they were productive players; however, these player were known to be the embodiment of the “three-true-outcome” hitters.  Dunn had five consecutive seasons of 40 or more home runs, but also led the league in strikeouts four times; Cust led the league in walks once and strikeouts three times; and Howard led the league in home runs twice and strikeouts twice.  Admittedly, these comps are not encouraging.  Although these players were not horrible in the simplest definition, their careers were short-lived and their production sharply declined.  For Cust and Dunn, it forced an early retirement, and Howard a well-publicized and sad end to an illustrious career.

But it’s not just Aaron Judge’s strikeout and walk percentage — it’s also his raw strikeout numbers.  Judge is on pace to strike out over 200 times this season.  While it’s already been established that he is strikeout-prone, it does not serve him justice that the 200-strikeout threshold is upon him.  No player who has struck out 200 or more times in a season has had a very high average.  As the legendary Pete Rose noted, the highest single-season average for a player with 200 or more strikeouts was .262 (Chris Davis holds that honor).  The short list of 200 single-season strikeout players is a whopping five players long: Mark Reynolds, Adam Dunn, Chris Davis, Chris Carter, and Drew Stubbs.  Kris Bryant had 199 in his rookie season (he was called up late to the bigs due to service-time considerations, so it’s likely that he would have joined this club), and Ryan Howard had 199 twice and Jack Cust had 197 once.  Dunn, Howard, and Cust again…

I love Aaron Judge, and I love 500-plus foot home runs, but we also have to be realistic and rational in our love and praise for the slugger.  The worst thing that the New York sports world can do is rattle this kid if, and when, he goes from being an All-Star to the 25th man on a roster.  There is nothing I want to see more, as a Yankees fan and a baseball fan, than Judge succeed; it’s good for the sport.  But I also don’t want to get my hopes up too high, because nothing stings more than a player of his caliber going down the path of Adam Dunn, Jack Cust, or Ryan Howard.


How to Make Yourself Interesting

Allow me to start this post off with a couple of charts without any context about the player we are talking about.


Let’s talk about this player for a second. His name is not of consequence, yet. This player has fluctuated from being an above-average producer of runs and slightly-below-average producer of runs for close to 10 years now. This means he’s been around a long time, so his profile as a hitter is solidified; he has a reputation. Something funny has happened in 2016 and 2017 as evidenced by the LARGE upward line. That’s good! Can you guess who this player is? No? Come on, one guess. Okay, fine. It’s Mark Reynolds! Yes, that Mark Reynolds!

Mark Reynolds once hit 44 home runs. Do you remember that? When I said, he had a reputation, I meant to say that he’s well-known for the three true outcomes: walks, strikeouts, and home runs. Not much else. He’s a first baseman, which means his defensive value is minimal at best. So basically, his value is his offense. He’s signed for $1.5 million this year and is currently a top-10 first baseman in the MLB by fWAR. He’s top-8 by wRC+, and top-4 by wOBA. He’s already exceeded the value of his contract. The obvious caveat here: it’s May 9th. The other obvious caveat is he plays for the Rockies now, which means he gets to play 81 games (give or take) at Coors Field.

I don’t know if he can sustain this. I too see the name Mark Reynolds and think, 30% K rate, with a decent amount of power. The thing is, he’s not striking out in 30% of his plate appearances. He’s not even striking out in 25% of his plate appearances. You want to know how often he’s striking out? After today’s day game with the Cubs, he’s striking out only 21.1% of the time. That’s, dare I say, below league average (League wide K% currently is 21.5%). I’m going to throw some more numbers together to try and articulate an idea: Mark Reynolds is up to something.

This doesn’t seem to be a one-year fluke. Reynolds is a slightly different player than he was two years ago. His K% has been on the decline since 2015, when it was 28%. Last year it was 25.4% and obviously now it’s 21.1%. So let’s go to his plate discipline to see what’s changed.

Looking at his O-Swing% and PITCHf/x O-Swing%, there isn’t a huge difference. They both hover in and around his rate of 26-27%, though PITCHf/x has him at 29.5%. The real difference is in his Z-Swing%, where he has decreased his percentage over the last two years. In 2015, it was around his career norm of 70% by Baseball Info Solutions and 67% by PITCHf/x. The last two years: 69.4% and 66.2% respectively by Baseball Info Solutions, 66.2% and 64.9% respectively by PITCHf/x. He seems to be pickier in the zone overall and there is a tangible result.

His Z-Contact% career average as calculated by PITCHf/x and Baseball Info Solutions is 74.3% and 74%, respectively. In 2015, he made contact with pitches in the zone 80% of the time by both systems. Last year? 81.9% by Baseball Info Solutions and 84.6% by PITCHf/x. This year? 85.4% and 84%. He’s making more contact overall for the last two years, as it’s been in the 70% range rather than the 60% range. His SwStr% has been decreasing too! It’s been below 13% the last two years, where his career average is 15.7%. This is a different Mark Reynolds.

Maybe Reynolds is trying to take more pitches in the zone so he can focus in on his best pitch. The power is there — his ISO is .339, with 12 home runs thus far. Probably not sustainable, but 30 home runs can be reached even with a return to the average.

About that park factor, though. He really hasn’t hit much differently at Coors versus away from Coors.

The same amount of hits, admittedly more home runs, same amount of strikeouts, same amount of walks. Slightly odd thing — he has a reverse platoon split. Let’s chalk that up to small sample size. One more chart that I feel is important:

This chart befuddles me. He’s hitting fewer fly balls than league average (opposite league trend as touched on at FG main page), more ground balls than league average, and slightly more line drives than league average. Something funny is happening here. So, here’s the thing. His HR/FB is 44%. Aaron Judge is at 46.4% and no one expects him to sustain it. League average is 12.8% and Reynolds’ career high is 26%. His career average is 19.4%, which he hasn’t reached since 2011.
It all comes back to small samples, but even if he comes crashing back down, there’s still proof he’s trying to make a change. He’s making more contact and we know contact is a good thing, and this has been happening for more than just 30 games. If he sustains a fraction of this pace, he becomes trade bait at the deadline, or he stays part of a contender, and he may even get a pay raise in free agency. Mark Reynolds has made himself interesting.

Mark Reynolds’ Whiffs by Pitch Type

Mark Reynolds is perhaps one of the more interesting power hitters heading into his prime this season. He has led the entire league in strikeouts since 2008, holding the all-time record for most strikeouts in a season with 223 K’s last season.

This year, he leads the league once again in strikeouts, as well as perennial leader in swinging strike percentage. He has whiffed on 17.3% of all pitches this season, second place being Ryan Howard at 14.4%. Interestingly, Reynolds does not actually swing at everything a la Jeff Francoeur (60.7% swing percentage) and is barely in the top 50 in percentage of pitches he swings at with 46.8%. This makes it even more amazing that Reynolds leads the league in strikeouts and swinging strike percentage regularly without even taking that many swings. That’s a lot of whiffing going on, and I do suppose that the rare times he does connect the bat to the ball, he hits it hard.

I wanted to know more about Mark Reynolds’ swinging strike percentages to see how he fares against certain pitch types by handedness. Of the five main pitch types, fastballs, sliders, cutters, curveballs, and changeups, Mark Reynolds has seen cutters less than 200 times since his debut, 139 cutters from right-handed pitchers and 41 cutters from left-handed pitchers. He has seen at least 200 pitches for the other pitch types for right-handed pitchers or left-handed pitchers. Ignoring cutters due to small sample size, I will take a look at Reynolds’ swinging strike percentages against four-seam fastballs, sliders, curveballs, and changeups.

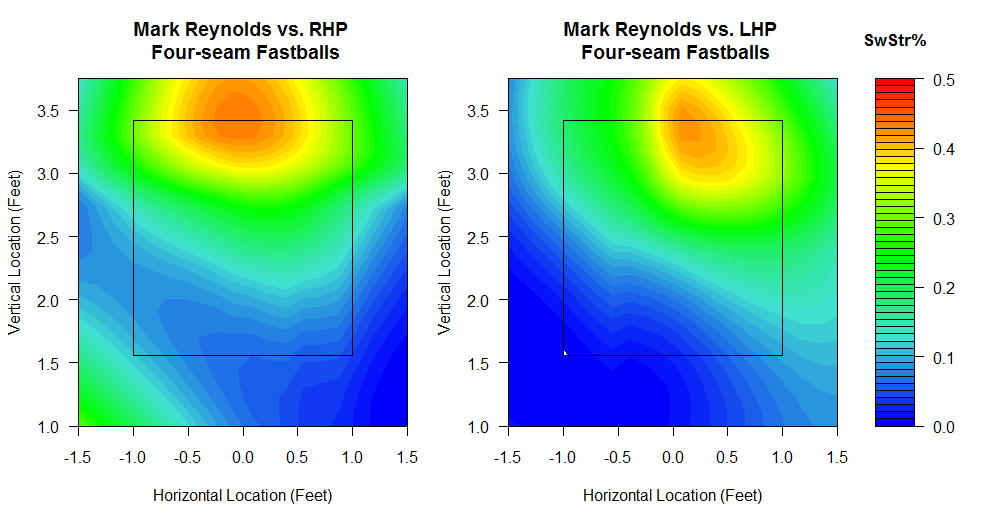
Let’s take a look at Mark Reynolds’ swinging strike percentages against four-seam fastballs split by RHP and LHP (1435 pitches from RHP, 468 pitches from LHP):

Four-seam fastballs

Here, it looks like Reynolds falls victim to high fastballs from both right-handers and left-handers. For Reynolds, he whiffs on the outside fastball from LHP stick out as well as the low and inside fastball from RHP.

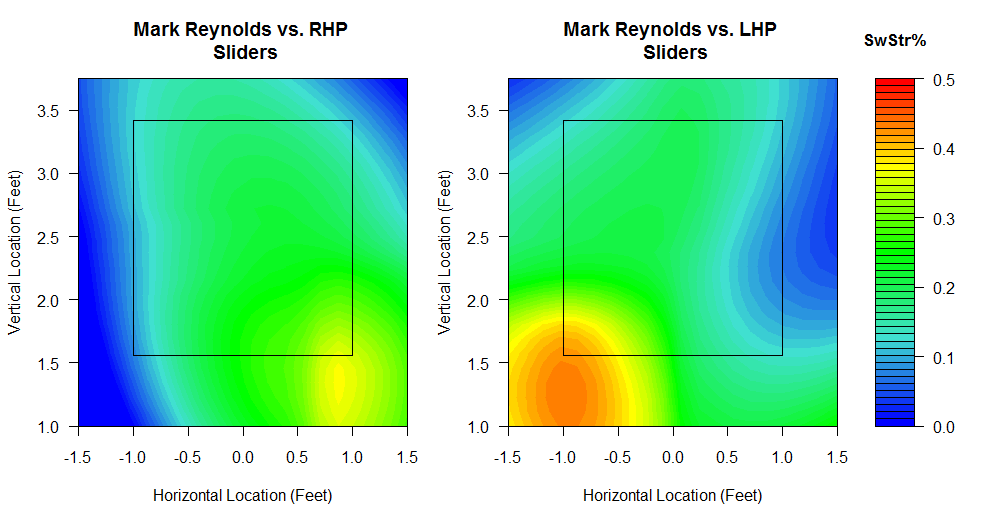
Here’s a look at Reynolds against sliders (1542 from RHP, 224 from LHP):

Sliders

This is interesting. Reynolds strikes out far more against right-handed pitchers than against left-handed pitchers, but he tends to swing at (and miss) sliders coming from LHP more than he does from RHP. LHP sliders come low and inside while RHP sliders go low and outside, but even LHP sliders coming in from low and outside are swung at and missed by Reynolds.

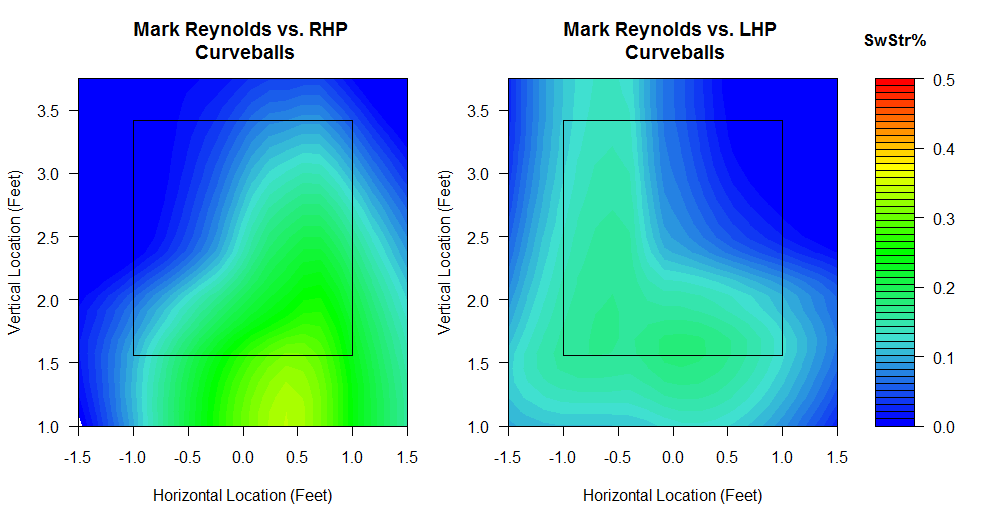
Curveballs against Reynolds are a whole different story (567 from RHP, 228 from LHP):

Curveballs

Here, Reynolds clearly struggles at connecting on curveballs from right-handed pitchers, some in the strikezone and most low and outside the strikezone. Curveballs from LHP also get Reynolds to whiff sometimes on the inside part of the plate as well as the lower part.

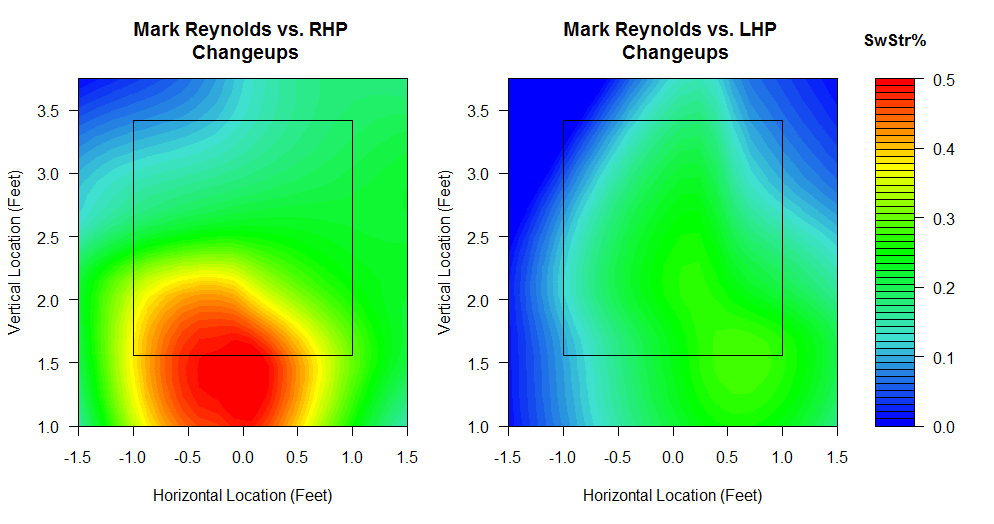
Finally, here’s a look at Reynolds against changeups, which look like his greatest weakness when it comes to missing pitches (430 from RHP, 338 from LHP):

Changeups

This is very telling. The splits against changeups are very different, as Reynolds whiffs on over 50% of changeups from right-handers that are located on the edge of the strikezone at the bottom. This is much different from LHP changeups, where any spot doesn’t look to cross over 30% whiff rate, except the lower righthand corner of the zone. What’s also crazy about this is that when you look at Reynolds against changeups in general, he misses at around 20% of nearly all changeups low outside and nearly all areas within the strikezone as well.

From these plots, there are characteristics of Reynolds’ swinging strikes that are similar to conventional thought and common knowledge, such as chasing high fastballs or low breaking balls. But the key to exploiting Reynolds’ weakness at missing the ball when swinging is definitely throwing timely changeups, especially from right-handed pitchers, while it seems that Reynolds is less prone to whiff against LHP curveballs the most.

This article was originally posted at Think Blue Crew, a blog dedicated to data visualization of baseball, basketball, and football statistics. Check it out for more f/x visualizations like this.