Six Feet Under: Evaluating Short Pitchers
It’s September 10th, 1999, and the small flame-throwing right-hander from the Dominican Republic just struck out Scott Brosius and Darryl Strawberry. He’s about to get Chuck Knoblauch swinging (and missing) on 1-2 count for his 17th strikeout of the night to finish the game. He does, and the fans at the old Yankee Stadium go nuts, for they’ve just seen Pedro Martinez’ finest start in the greatest pitching season of all time. The final score is 3-1, with the only Yankee run, and hit, coming off a Chili Davis home run. Pedro is 5’11’’ and 170 lb, one of the smallest pitchers in baseball. While most players tower over him off the mound, Pedro writes a different story when he’s pitching. The Yankee hitters fail to notice his height when he kicks his leg up, down, and serves a 95-mph fastball from a three-quarters delivery at their eyes.
The average male height in the U.S. is 5’10’’. You’d never know this from watching a baseball game, where the average height is about 6’2’’, with pitchers just a little taller at about 6’3’’. We all remember the success Randy Johnson had at 6’10’’, and his height was always considered an advantage. When we watched Pedro Martinez, however, commentators and baseball men viewed him as an exception to some obscure and unwritten rule: that shorter athletes can’t become successful pitchers.
Six feet, like 30 home runs or a .300 batting average, has become a number associated with a distinct meaning. If you hit 30 home runs, you’re a power hitter. Hit 29 homers, and you have some pop. If you hit .300, you’re a great hitter. Hit .299, and you just missed hitting .300. Similarly, if you’re six feet, you can pitch. If not, you’re short, but at least you might get an interesting nickname like Tim Lincecum’s (5’11”) “The Freak.”
Most Major League pitchers fall between 6’1’’ and 6’4’’. We can look at the height distribution for pitching seasons of the last 5 years and see that it’s approximately normal:
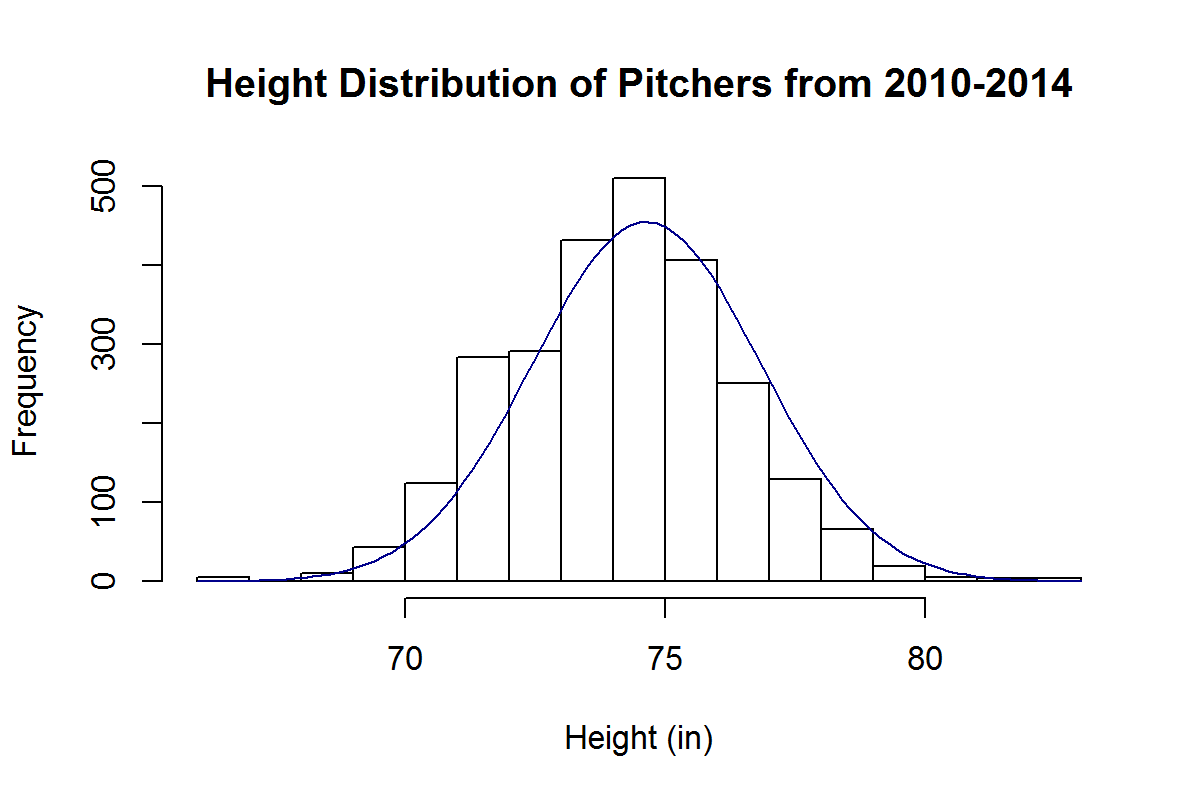
By this approximation, the chance of randomly selecting a pitcher of the last 5 years who is shorter than 5’11’’ is about 5%.
Are short pitchers really destined to fail? We’ve all been told that it’s better to be taller if you pitch. But is this true? Let’s consider short pitchers to be 5’11’’ or under and examine their effectiveness and distribution in comparison to taller pitchers, who we’ll consider to be 6 feet or taller.
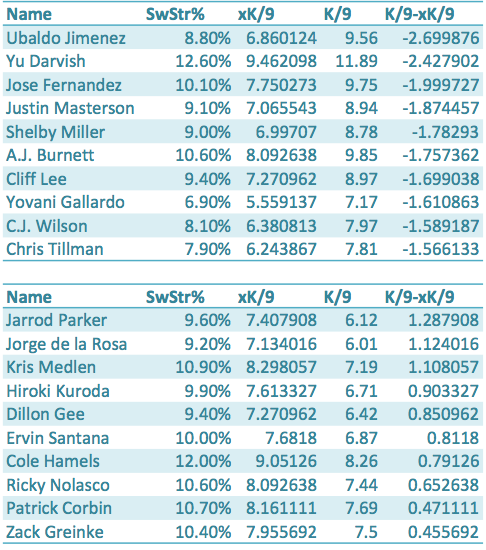
The top ten best pitching seasons for shorter pitchers of the last 5 years are:
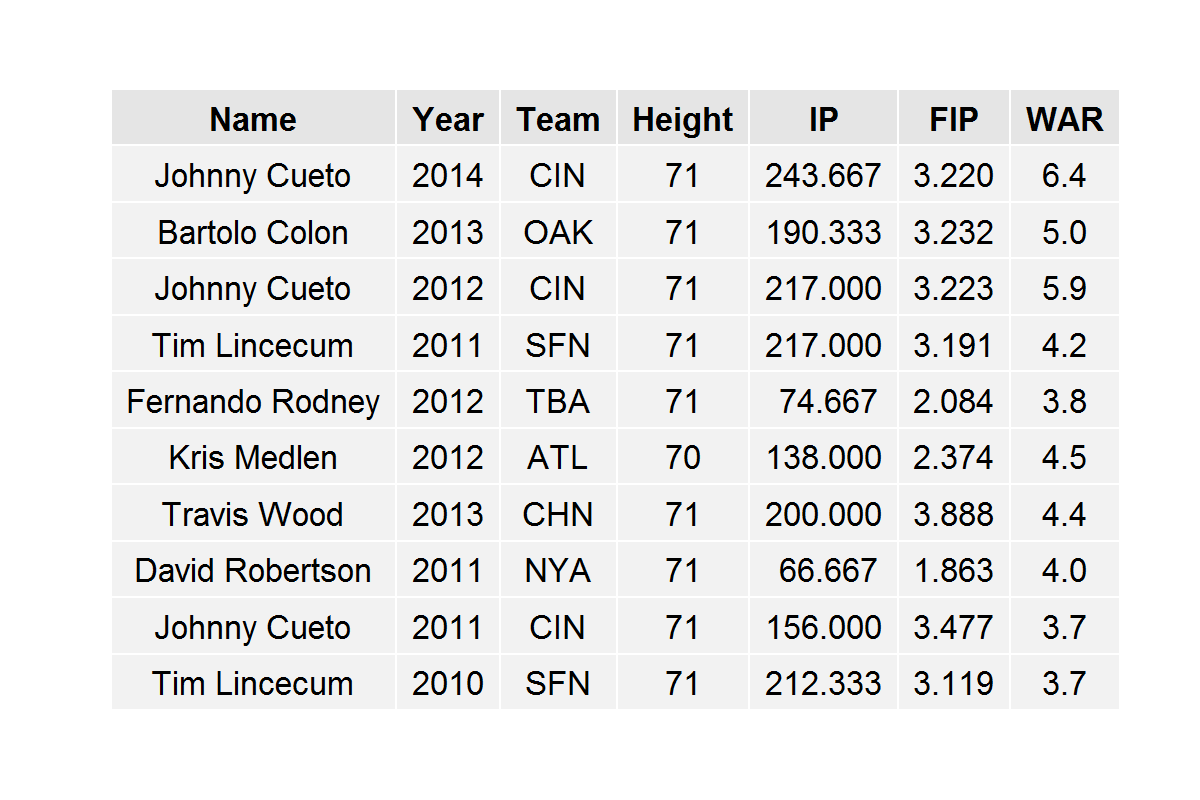
We notice that Tim Lincecum appears on this list twice and Johnny Cueto appears on it three times. All of these pitchers are 5’11’’ with the exception of Kris Medlen, who is 5’10’’. So, we see that successful pitching seasons by short pitchers don’t come completely out of the blue. Short pitchers can be successful and can dominate batters, most of whom are much taller, as Cueto did last year and in 2012.
In fact, short pitchers aren’t all that rare to come by, although they’re considerably rarer than taller pitchers. In the last 5 years, there have been 23 instances of short starting pitchers throwing at least 150 innings. In comparison, there have been 402 instances of this type for taller starting pitchers.
Shorter pitchers are generally relegated to the bullpen; there have been 95 instances in the last 5 years of full-time short relief pitchers and 968 instances of full-time taller relief pitchers.
We can see the average WAR breakdowns for all of these pools of players in the following table, along with P-Values for a two-sided t-test comparing the short relievers against the tall relievers and the short starters against the tall starters:
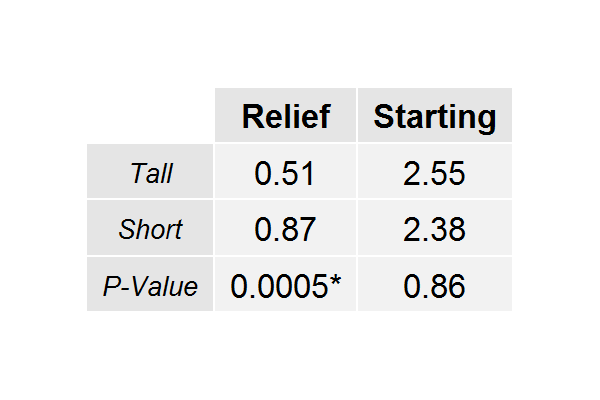
What the 0.0005 is telling us, here, is that we would observe these results by chance alone with probability 0.0005. Thus, there is actually a significant difference in the mean WAR for short relievers and the mean WAR for tall relievers (obviously favoring short relievers). On the other hand, the difference between the starters is not significant. Either way, we have no evidence to suggest that shorter pitchers are any less effective than taller pitchers.
Are shorter pitchers undervalued in the baseball market? If so, to what extent? We can approach this by examining the WAR value of a pitcher relative to his salary in free agency. We can do this by comparing the height groups within relievers and starters (since relievers are generally valued differently than starters).
However, we find that in the last five years, there are only 4 instances of a starter 5’11’’ or shorter pitching for a team that acquired him via free agency; and all of them are Bartolo Colon seasons from 2011-2014.
Fortunately, there are more instances of this in relievers, which is what we’ll examine. We notice the distribution of WAR and relievers’ salaries in free agency:
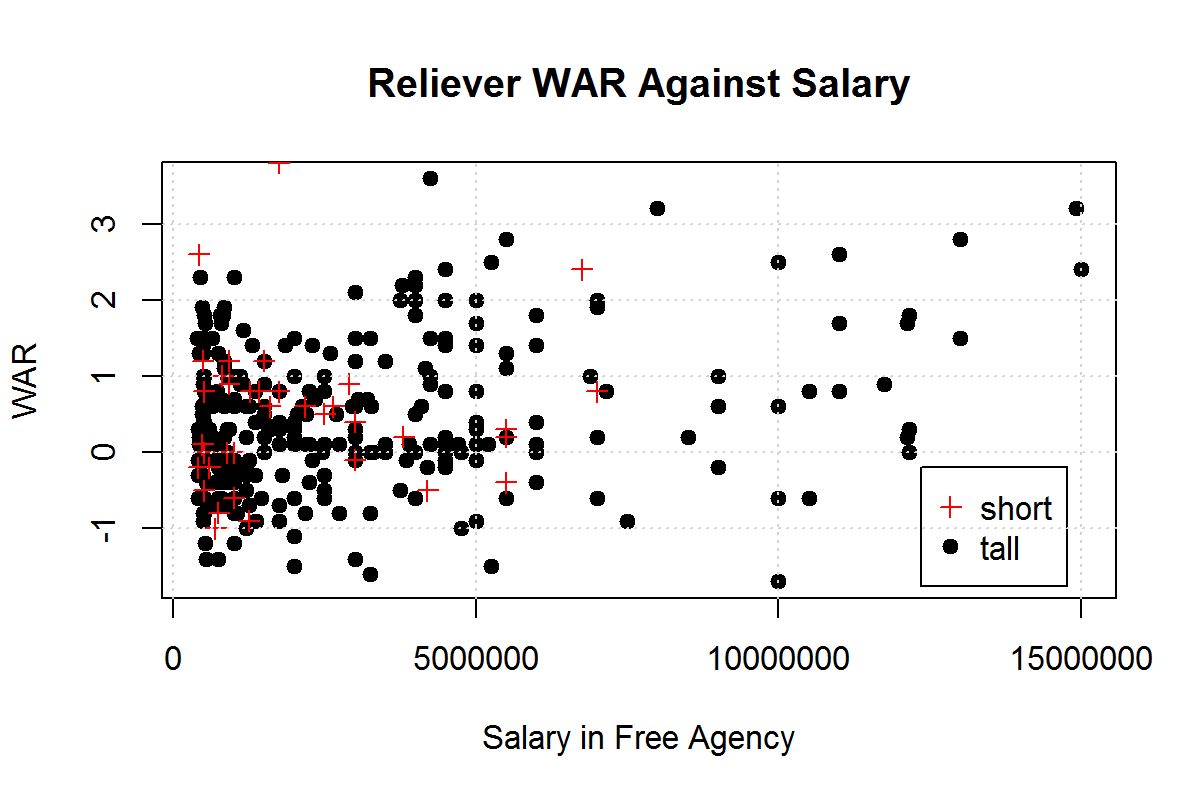
We see that short and tall relievers are clustered between -1 and 1 WAR and $1 million and $5 million dollars. However, we see several taller relievers past the $7.5 million mark with unremarkable WARs, which we don’t see for shorter relievers. From this, we would suspect that taller relievers are being overvalued while shorter relievers are being undervalued.
This is, in fact, the case: short relief pitchers are producing 2.33 WAR for every $10 million they earn in free agency while taller relievers are producing 1.36 WAR for every $10 million they earn. In comparing these values with a one-sided t-test, we acquire a P-Value of 0.0018, meaning these are results we would acquire by chance only .18% (a significant value) of the time. And so it goes, relievers under 6 feet are actually about 1.7 times as valuable as their taller counterparts.
Is there something inherently different about shorter pitchers that makes them less capable of pitching successfully in the big leagues? The evidence says no. In fact, it might be more worthwhile for General Managers to draft pitchers under 6 feet tall and reap the rewards.
Just because an athlete doesn’t tower over his opponents off the mound, doesn’t mean he can’t bring 55,000 dumbfounded Yankee fans to their feet on an unassuming September evening.