Archive for K%

The Free Agent Value of Michael Pineda

Michael Pineda is having by far the best season of his career ever since he broke into the big leagues with Seattle in 2011. This is good news for Pineda who is in a contract year and looking to earn a huge payday on the open market this winter. However, this is bad news for teams, especially the Yankees, who have many questions surrounding their starting rotation with CC Sabathia also in a contract year and Masahiro Tanaka having the chance to opt out of his current contract after the season (although the latter seems unlikely at the moment). Pineda reminds me of one player in particular: former Yankee Ivan Nova.

Like Pineda, Nova has a fastball in the mid-90s and good secondary pitches, including a nasty curve and a change-up which he has begun to develop under Pittsburgh Pirates pitching coach Ray Searage, aka “the pitcher whisperer”. While Nova’s strikeout numbers have gone down, he has learned to pitch rather than just throw, which has resulted in fewer guys getting on base against him as well as his K/BB ratio going down, which I believe have been key contributing factors to his success in Pittsburgh. Also like Pineda, Nova hit the ground running, going 16-4 with a 3.70 ERA in 2011, and he was arguably the Yankees’ second-best starter behind Sabathia. However, as teams began to expose tendencies, combined with mounting injuries, Nova was never able to maintain the same level of success in New York.

The same could be said for Pineda, who missed two full seasons and most of 2014. Even after coming back in 2015, Pineda still struggled to maintain any level of consistency, after posting respectable numbers as a rookie. Now, Pineda has harnessed the power of his wipe-out slider and has become a ground ball pitcher (51.5%) to cope with the home-run haven that is Yankee Stadium. His K/BB ratio has gone down and his WHIP has dropped from 1.35 to 1.13 this season. The formula is simple: the fewer baserunners there are, the better a team’s chances are of winning. Also, like Nova, Pineda is using a change-up more in his pitching repertoire, to complement his slider. As a result, he has generated a 43.3% swing and miss percentage on pitches outside the zone, a 7% increase from last season. Additionally, they are close in age, since Nova was 30 when he signed his new contract, and Pineda will be 29.

The Pirates ended up giving Nova a three-year, $26-million contract last offseason. As long as Pineda continues to have success this season, he will also end up getting a similar deal. I predict he will end up staying with the Yankees for three years for somewhere in the range of$36-39 million simply because the Yankees will be desperate for starting pitching and may even pay a little bit over his market value to keep him. These types of deals are always risky, and many look to the Dodgers signing Rich Hill. However, Pineda has proven that he has always had the talent to pitch in New York and it seems that he finally has his head in the right place to help him reach his full potential. I believe that the Yankees will also re-sign Sabathia to a one-year deal in the range of $5-10 million, considering he will be 37 next season. If the Yankees manage to acquire another lefty or even sign Jake Arrieta, the Yankees starting rotation could be something to look out for in 2018.


Prospect Watch: 5 Future All-Stars No One Is Talking About

I chose to stick with hitters in this article, because pitching prospects are extremely difficult to predict, and I think the pitchers who do get the hype are typically deserving. However, I do see a trend of some unnoticed hitting prospects turning out great careers in the majors. Let’s get right to it.

1. Travis Demeritte – 2B – ATL

In 2016, Demeritte went from the Rangers’ to the Braves’ system and spent the entire year in high-A ball, where he dominated at the plate. A 2B with power like Cano, good speed and the ability to get on base is such a rarity.

In my opinion, Demeritte has the highest chance of being a perennial All-Star out of these five prospects. The middle infield in Atlanta has an extremely bright future. I’m predicting that Demeritte will make his splash in 2018, and make his first ASG appearance by 2020 (age 25). Let’s look at his numbers from a season ago:


Name Age G AB PA H 2B 3B HR BB SO SB CS BB% K% OPS ISO wOBA wRC+
Travis Demeritte 21 145 547 635 145 33 13 32 78 200 20 4 12.3% 31.5% 0.905 0.283 0.393 139


Let’s compare these to the four All-Star 2B in 2016 and Brian Dozier.

Name G AB PA H 2B 3B HR BB SO SB CS BB% K% OPS ISO wOBA wRC+
Jose Altuve 161 640 717 216 42 5 24 60 70 30 10 8.4% 9.8% 0.928 0.194 0.391 150
Robinson Cano 161 655 715 195 33 2 39 47 100 0 1 6.6% 14.0% 0.882 0.235 0.37 138
Brian Dozier 155 615 691 165 35 5 42 61 138 18 2 8.8% 20.0% 0.886 0.278 0.37 132
Dustin Pedroia 154 633 698 201 36 1 15 61 73 7 4 8.7% 10.5% 0.825 0.131 0.358 120
Ian Kinsler 153 618 679 178 29 4 28 45 115 14 6 6.6% 16.9% 0.831 0.196 0.356 123


Some things to keep in mind as we compare these players: Demeritte was playing in A+ ball, but he did play an average of 12 less games than these major-leaguers. As you can see, it’s basically a two-man race (other than Dozier’s 42 HRs) between Altuve and Demeritte here. While we cannot expect these A+ ball numbers to translate directly against ML pitching, Demeritte definitely deserves more attention in top-prospect lists. While he’s not quite as speedy as Altuve, he has more power, and he walks at a far higher rate. The one glaring weakness is the K numbers for Demeritte. However, some of the top players in the league K at very high rates. As long as the OPS stays high, it doesn’t really matter how a guy makes outs anymore.

I should note that 2016 was a breakout year for Demeritte; in years past he didn’t quite live up to his potential, and also served an 80-game PED suspension. These could be the main reasons why he hasn’t garnered much attention yet. He still has to prove himself to most. However, I’m sold. I’d pencil him in for the majority of the 2020s’ ASGs right now.


2. Ramon Laureano – OF – HOU

Laureano has all the tools: he can play any OF spot well, he has speed and pop, and he gets on base. Houston’s farm has taken a bit of a hit due to some trades in the last two years, but that’s because they knew they had guys like Laureano who don’t have super high trade value, but have a chance to be great ML players like the guys they traded. Let’s look at Laureano’s 2016 numbers.

Name Age G AB PA H 2B 3B HR BB SO SB CS BB% K% OPS ISO wOBA wRC+
Ramon Laureano 21 128 461 555 146 32 9 15 73 128 48 15 13.2% 23.1% 0.943 0.206 0.418 159


The numbers speak for themselves. This is the making of a star; where is the hype? I know it’s not a huge sample size, and we don’t have much to go off from the previous year either, but in A+ and AA last year he put up those phenomenal numbers you see above.

If those aren’t All-Star numbers, then I don’t know what are. Laureano’s ability to play all three OF spots will keep him in the lineup everyday and help his chances of making it to the ASG. When he does get the call-up, if his numbers stay relatively close to this, there’s no way he doesn’t make three to four All-Star Games. As of now, he’s more of a speed threat, but as he develops, the speed/power combo will even out and he will be an Andrew McCutchen-type player. Keep tabs on this guy.


3. Christin Stewart – OF – DET

While researching Stewart, I couldn’t find an article more recent than September of 2015. There’s no one talking about him…why? As we know, Detroit is aging and looking to deal top players. So, I’m assuming we will be seeing a lot of opportunities for young guys to step up and prove themselves. Detroit’s system isn’t super deep, but that could change anytime if they do decide to move some key pieces. Regardless, I see Stewart as the prospect to watch moving forward; he has the tools to be an All-Star. Let’s check out his numbers from 2016.

Name Age G AB PA H 2B 3B HR BB SO SB CS BB% K% OPS ISO wOBA wRC+
Christin Stewart 22 147 514 622 132 29 2 31 93 154 4 2 15.0% 24.8% 0.883 0.245 0.407 156


The power is impressive, and by this chart he looks even a bit better than the two previous guys I mentioned. However, with the K numbers pretty high up there, and not a whole lot of speed, Stewart is a player that could fall into slumps. Often times, adjusting to the majors can be challenging, and some top prospects never quite figure it out. While Stewart’s MiLB numbers are pretty insane, his slump potential makes him a pretty risky pick here. However, I do believe that if he does indeed figure it out, he will make it to a few ASG and serve as an everyday player in this league for a decade. HRs and BBs get it done. Keep an eye on Stewart.


4. Jason Martin – OF – HOU

Another Houston OF prospect…another future All-Star? I think so. The future is certainly bright over at Minute Maid Park: Altuve is a cornerstone, Correa is a centerpiece, Springer is a baller, and they have prospects for days. If they can just figure out how to pitch, they could be a WS contender for the next eight years.

Why Martin, though? Let’s check out his 2016 numbers from high-A ball.

Name Age G AB PA H 2B 3B HR BB SO SB CS BB% K% OPS ISO wOBA wRC+
Jason Martin 20 121 431 502 114 25 7 23 63 112 22 12 12.5% 22.3% 0.874 0.251 0.382 131


Impressive, to say the least. At just 20 years old, he pumped out 23 homers in 121 games. He walks every eight at-bats, and he also grabbed 22 bags on the season. The ability to walk and run (lol) will typically keep guys out of major slumps. While Martin is not a highly-touted prospect at this point, I think he will be a household name by 2022. I expect him to get the call-up in 2019 and play a significant role during a pennant race that year. In 2020, he will burst onto the scene and prove his worth to this franchise.

With Houston’s current build, this might be a guy we see dealt if they are trying to add talent at the deadline this year. That doesn’t change my prediction, however. I see Martin suiting up for the ASG a few times throughout his career. Stay posted.


5. Tom Murphy – C – COL

You can’t keep putting Yadier Molina in there every year. And with Buster Posey most likely making that change to 1B full-time within three years, Jonathan Lucroy getting dealt to the AL, Kyle Schwarber playing OF, etc, pathways for guys like Tommy Murphy open up. Making the All-Star Game as a C is not saying as much as other positions, in my opinion. A decent hot streak in the first half will inflate your hitting numbers. For example, Derek Norris in 2014. It may seem like he was the best catcher in the league at the halfway point, but, as usual, it evened out by season’s end.

With that being said, Murphy has proven he has pop, and playing in Colorado is a huge advantage for him. While I don’t think he will be a Hall-of-Fame catcher, I do think he’s flying under the radar right now and will probably open some eyes in 2017. I’d say he makes two appearances in the ASG before 2022. However, once he gets up near 30 and he’s no longer playing in Colorado, I think he will have trouble keeping a job.

I have him on the list, first of all, because he meets the criteria, and also because I think people should pay attention to him, and lastly because he’s ML-ready, unlike the rest of these guys. Trevor Story didn’t have a whole lot of hype; most people didn’t expect him to make the team out of spring, but with the Jose Reyes situation, the kid got a shot and as we all know, he ran with it. I’m not saying Murphy will make a cannonball-esque splash like Story, but I think he will turn some heads and maybe even get some ASG votes this year. Anything can happen, especially in Colorado. Keep tabs on him.

Honorable Mentions

Dylan Cozens – OF – PHI

There’s not a lot of buzz surrounding Cozens, which is surprising to me, because usually when we see 40 HR in 134 games, we really perk up. In his age-22 season, he played all 134 games at the AA level for the Phillies affiliate, Reading Fightin’ Phils, a place where most Phillies prospects prosper. The reason why Cozens doesn’t quite make the cut here is because of the words, “future All-Star.” He is one of those lefties that mash in the right ballpark and against RHP, but usually career platoon hitters, even if they are highly effective, don’t make the ASG.

Rhys Hoskins – 1B – PHI

Hoskins is another AA player in the Phillies system. He probably has a little bit more of a well-rounded hitting ability than does Cozens, but he’s a 1B, and that’s an overloaded position. You have to be incredible to crack that ASG squad, and I just don’t think Hoskins will ever be quite at that level. I do believe he will pan out to be an everyday guy for a good amount of time in this league. He has really good power and he gets on base, two things that will keep you in the lineup more often than not.

Bobby Bradley – 1B – CLE

Bradley is another guy I would keep an eye on; I’m just not sold on him yet. He has a a lot of raw power, but a really high K rate in the low levels of the minors. Also, he’s a 1B, so once again, really hard to make the ASG at that position.


Will the Real Tyler Goeddel Please Stand Up?

Similarly to a large portion of the FanGraphs community, I am a Philadelphia Phillies fan.  I was born in South Jersey just 20 minutes away from the stadium and grew up watching every game.  I was there for the tough times in the late 90’s / early 2000’s, and I was there for the glory days of 2007-2011.  After an abysmal last few seasons of baseball in Philadelphia, we have finally seen some promise this season leading us to believe that better days are coming soon.  One of the bright spots on the team so far this year has been Rule 5 pick, Tyler Goeddel.

After being selected in the first round of the 2011 MLB Rookie Draft, Tyler Goeddel began his professional career with the Tampa Bay Rays.  Goeddel was drafted out of high school as a third baseman and for the first three years of his minor league career that would be the only position he played.  In 2015, however, the Rays decided to move Goeddel to the outfield.  His athleticism allows him to play all three outfield positions and that type of versatility is very sought after by big league clubs.  While defense was never his problem, Goeddel’s bat didn’t develop as quickly as the Rays had hoped.  He was a career .262 hitter with 31 home runs across four full seasons in the minor leagues.  Ultimately the Rays made a tough decision and left him off their 40-man roster, knowing there was a great chance another team would select him in the Rule 5 Draft.  Shortly after, the Phillies did just that and selected Goeddel with the first overall pick of the 2015 Rule 5 Draft.

The Philadelphia Phillies have historically been excellent in finding talent in the Rule 5 Draft.  (2004 – Shane Victorino, 2012 – Ender Inciarte, 2014 – Odubel Herrera).  In the early going, I (like most Phillies fans) was very skeptical as to whether or not Goeddel could follow in the footsteps of players like Shane Victorino and Odubel Herrera and become a valuable contributor to our big league team.  Goeddel had a mediocre spring training but with no other serious competition in the corner outfield spots, there was no harm in keeping him around for a rebuilding year and seeing what the kid could do.

The beginning of Tyler Goeddel’s major league career could not have gone much worse.  Take a look below at his stats through his first nine games:

4:6 - 4:19 Stats

In only 16 at-bats, Goeddel recorded only one hit (a single), and struck out a whopping eight times!  Now obviously this is a VERY small sample size, and we should expect some struggles while adjusting to big league pitching.  Up until this point, Goeddel has never seen pitching above the Double-A level.  Now let’s take a look at his plate discipline stats over the same time frame:

4/6 - 4/19 Plate DisciplineO-Swing % – Percentage of time a batter swings on pitches outside the strike zone
Z-Swing % – Percentage of time a batter swings on pitches inside the strike zone
Swing % – Percentage of time a batter swings at a pitch, regardless of location
O-Contact % – Percentage of times a batter makes contact with a ball when swinging outside of the strike zone
Z-Contact % – Percentage of times a batter makes contact with a ball when swinging inside of the strike zone
Contact % – Percentage of times a batter makes contact with the ball when swinging
Zone % – Percentage of overall pitches thrown to batter that were in the strike zone

There is nothing noteworthy about his swing percentages as they are all just about equal to the league averages, but the contact percentages are quite alarming.  Through his first nine games, Goeddel only made contact 53% of the time he swung his bat.  Rather than just writing this off as a rookie being over-matched by big league pitching, I decided to dig deeper into these stats and figure out exactly where Goeddel was struggling.  Check out the video below that I put together which basically sums up the beginning of Goeddel’s career in 30 seconds:

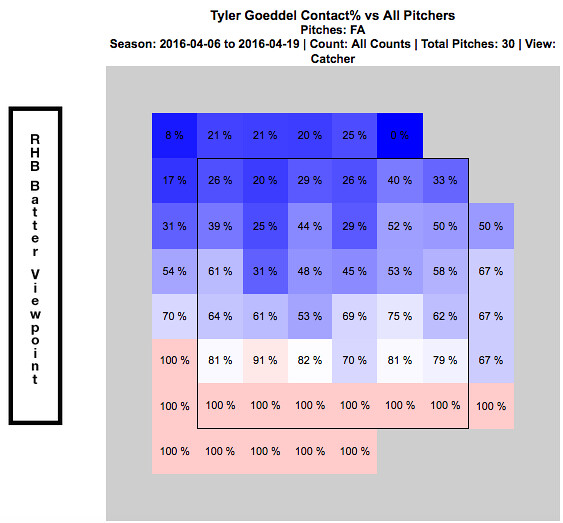
Whether or not you realized from watching the above video, every one of these swing and misses came on a fastball.  They all also came in the upper portion of the strike zone.  Just by watching Goeddel’s at-bats through this point of the season, it was clear as day to see opposing pitchers were attacking Goeddel with fastballs up in the zone.  The chart below shows every fastball that was thrown to Goeddel over his first nine games.  It is broken up by hot and cold zones and shows his contact percentage versus the fastball at every portion of the strike zone:

4:6 - 4:19 Contact % vs Fastball

This chart verifies for us what we saw in the video…Goeddel really struggled to hit fastballs up in the zone to begin the season.  At this point, everyone was frustrated.  Tyler Goeddel was frustrated because he knew he was much more talented than his results thus far have showed.  The Phillies organization was frustrated because they had such high hopes for Goeddel entering the season.  And most importantly, the Phillies fans were frustrated and began questioning what the Phillies could possibly see in this guy.  (Search for Tyler Goeddel’s name on Twitter and read old tweets from this time period if you don’t believe me!!)

An important thing to remember while looking at these stats, is that up until this point of his career Goeddel has been an every-day player.  Not only is he adjusting to big league pitching, but he is also trying to adjust to not having consistent at-bats.  Since the Phillies unexpectedly got off to such a hot start, an important decision needed to be made.  On one hand, they have this young promising player who will need consistent at bats in order to show his true potential.  But on the other hand, this team is surprisingly in the hunt in the NL East and may not want to allow Goeddel to go through his growing pains while they are competing for the division title.  Eventually, a decision was made and manager Pete Mackanin started to put Goeddel in the every-day lineup. Below are some quotes from Goeddel at this time speaking of the decision:

“Getting regular playing time and the confidence [from that] is huge, but I try to get started a little earlier on my swing so I can be on time with the fastball. You need to hit the fastball if you want to play up here, obviously. I feel like I’ve made that adjustment and it’s been a huge help.” – Tyler Goeddel

“I didn’t play how I wanted to play in April.  And I’m glad he’s (Pete Mackanin) giving me a chance, because I really didn’t play my way into a chance; he just gave it to me. So I’m trying to make the most of it.” – Tyler Goeddel

The video below (from 4/23/16) summarizes Goeddel’s early season struggles and the decision to give him more playing time:

The Phillies coaching staff deserves a lot of credit.  They recognized early on that Goeddel was struggling with fastballs up in the zone and prior to this game really worked with him in that area and promised him more playing time moving forward.  Here is a video of his next at bat in the game, where the pitcher tries once again to attack Goeddel with some high heat:

Goeddel responds with another base hit and his first RBI of the season.  Take a look below at how his stats over his next seven games compare to his stats from his first nine games.

4:23 - 5:6 Stats

4:23 - 5:6 Contact %

You can very easily see that Goeddel drastically improved his contact percentage over this time frame, which resulted in a huge drop in his strikeout rate.  The video below is from 5/8/16, right after the stretch of stats we just evaluated.  Goeddel had a big hit late to tie the game for the Phillies and later came in to score the winning run.

As you could see, the hit came on a high fastball.  A few weeks ago, Goeddel could not touch this pitch…but all of a sudden he is beginning to prove that he can.  The next video is from after that game.  Tyler discusses the adjustments he has made and also how playing every day has contributed to his recent success:

This hit was the start of a new Tyler Goeddel.  Pitchers continued to attack him with fastballs up in the zone and Goeddel really started to make them pay.  This is what he did to a Brandon Finnegan fastball just a few days later:

Ever since that hit on May 8th against the Marlins, Goeddel has been the player the Phillies could have only hoped he one day would become.  He has flashed signs of brilliance in just about every game since that have Phillies fans drooling over what the future outfield could look like.  Even though he has made adjustments and is seemingly now catching up to big league fastballs, opposing pitchers continue to test him.  Check out the video below that I put together showing what Goeddel has done to fastballs in the upper portion of the strike zone over the last few weeks.

As you can clearly see, this is a different player than we saw early on in the season.  Take a look at how his recent stats compare to those early on:

5:6-5:20 Stats

5:6-5:20 Contact %

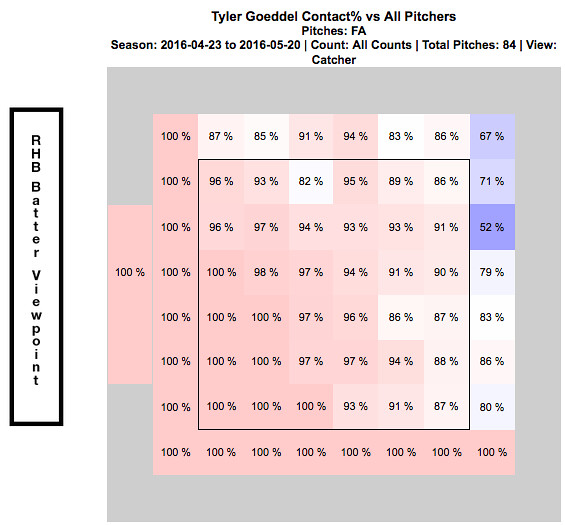
Goeddel’s contact percentage over his first nine games was only 53%.  Over his last 10 games, it is 91%.  That is an incredible difference and clearly his adjustments are paying off.  In turn, his improved contact has led to a strikeout percentage of only 5.4% over his last 10 games.  The chart below shows how Goeddel has fared against the fastball since he noted his adjustments on April 23, 2016.

4:23 - 5:20 Contact % vs Fastball

Now go back up to the top of the article and compare this chart to what it looked like at the beginning of the season.  More consistent at bats have clearly translated into him catching up to the fastball and the results thus far have been phenomenal.  I have to admit that I was a doubter early on, but I am now completely on board the Tyler Goeddel bandwagon.  This kid is only 23 years old and the fact that he was able to so quickly make an adjustment like this and immediately see results is remarkable.  Now that he is having some success, opposing pitchers will start to change their game-plan against him.  While the pace he is on now may not be sustainable over the course of a full season, I am confident that Goeddel will continue to make the necessary adjustments and help this Phillies team continue to find ways to win ball games.  Although the video below doesn’t exactly relate to his success at the plate, I had to throw this in here and it is a must watch if you have not seen it already:

The last video I will show features Goeddel’s post game interview after this throw:

Recent Quotes:

“It’s exciting.  Coming to the field everyday I’m expecting to see myself in the lineup. That’s a feeling I didn’t have last month. It’s a lot more relaxing, less stressful.” – Tyler Goeddel

“It was definitely a big adjustment, going from playing everyday my whole career to having a specific role, and then not performing well in my role, it was a little tough.  But, you know, they’re giving me an opportunity now and I feel like I’m playing better, which is nice. I’m happy for myself. I always knew I could play up here, but I needed some results to prove it to myself. I’m glad, finally, there are some results to show.” – Tyler Goeddel

I love how confident Goeddel is when he speaks of his game and I am so glad the numbers back him up.  I continue to be blown away watching him play every day, especially due to the fact that he has only been playing the outfield for one year.

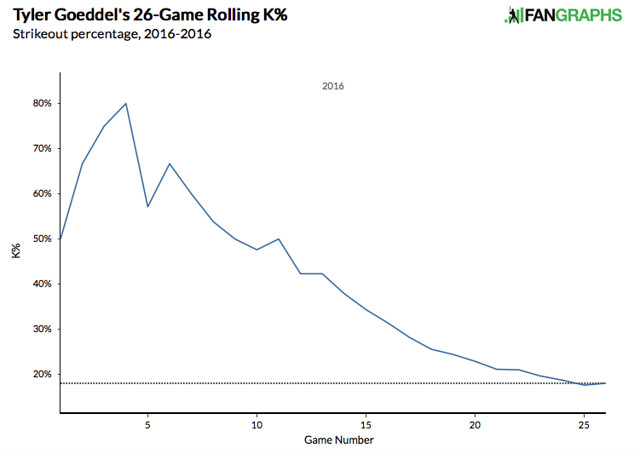
Lastly, I want to show a few graphs.  The first one shows a rolling total of Goeddel’s strike out percentage so far this season.  The statistics earlier show you that it has decreased, but this graph makes it much easier to see his progression:

Rolling K%

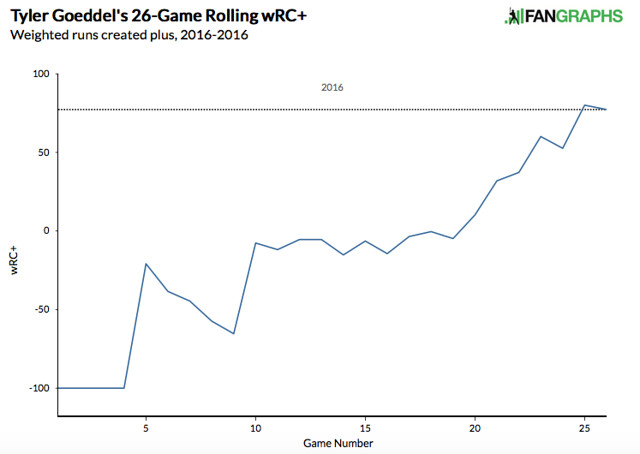
The next graph is another rolling total showing how Goeddel’s wRC+ has progressed throughout the season.  For those of you who are unfamiliar with the stat, wRC+ stands for weighted runs created plus.  It attempts to quantify a player’s offensive value in terms of runs.  An average wRC+ is 100.  Check out how Goeddel’s wRC+ has improved throughout the season:

Rolling WRC+

What do you think, Phillies fans?  Can Tyler Goeddel keep this up?  Is the Tyler Goeddel that we have seen over the last few weeks the real Tyler Goeddel?  Are you ready to hop on the bandwagon yet or do you need to see more from him to believe?  Only time will tell, but I’m buying into the hype and am excited to see what the future holds for this promising young player.

Twitter – @mtamburri922


Stephen Strasburg Is Better Than You Think

To a casual baseball fan, Stephen Strasburg’s numbers are not pretty. The owner of a 4.76 ERA and a 1.38 WHIP, Strasburg is clearly having the worst season of his career. But how bad has he been, really? Not as bad as you think. Take a look at these 2015 stats:

Player A: 3.48 xFIP, 22.8 K%, 5.5 BB%
Player B: 3.31 xFIP, 24.1 K%, 5.3 BB%
Player C: 3.18 xFIP, 24.9 K%, 6.0 BB%

Player A is none other than Johny Cueto, recently traded to the Kansas City Royals. 12th in ERA among qualified pitchers, Cueto is widely considered among the best, and perhaps deservedly so with five straight years of a sub-3 ERA. While he has consistently outperformed the above metrics, they are still indicative of general pitcher performance and should not be overlooked when comparing the quality of different pitchers.

Player B actually has the fifth lowest ERA among qualified pitchers and was also traded at the deadline. He’s been one of the most reliable pitchers over the past five years and has been an ace on every staff for which he’s pitched. Player B is David Price.

Player C is obviously Stephen Strasburg, and as you can see, his peripheral stats stack up against the best in the game. In addition to these 2 players, Strasburg also compares positively to others like Sonny Gray and Scott Kazmir, both of whom have better ERAs but a worse xFIP, K%, and BB%.  Strasburg is pitching like an ace, and xFIP shows that, so why have his results been so poor?

Well, first of all, there’s his .345 BABIP. Not only is this high compared to the league average (.296), it’s well above his career mark of .302. Considering he’s not giving up any more line drives or hard contact than usual, his BABIP should fall back to around the .300 mark and bring his ERA down with it.

Not only is his BABIP at an all-time high, his LOB% is at an all-time low. Currently at 65.3%, it figures to inch back up to his career 73.2% mark, or at least to the league average of 72.4%. Considering his strikeouts have not dropped off, there’s no reason for his drop on LOB%, and it can simply be chalked up to bad luck, something that he’s had plenty of this year.

Looking at these stats, there’s nothing that suggests Strasburg is anything but unlucky. However, as Jeff Sullivan pointed out here, Strasburg’s problem could stem from the injury he suffered in the spring. He had apparently adjusted his mechanics to compensate for the discomfort, and even though it appears as though he has fixed this, it’s possible that when pitching from the stretch and in higher leverage situations, he returns to this altered motion by default. When looking at the difference in Strasburg’s stats between pitching from the windup and the stretch, this is what we see:

K% xFIP
Bases Empty 30.1 2.73
Runners on Base 17.0 3.98

Evidently, this claim has some ground. Strasburg is clearly having some problems with runners on base, particularly in striking batters out. Before we deal with the strikeout numbers, let’s take a look to make sure that he’s not just getting killed during the at bats that don’t end in strikeouts.

GB/FB Batted Ball Velocity (mph) Hard Hit % Infield Hit %
Bases Empty .98 89 29.7 4.5
Runners on Base 2.05 88 28.7 12.2

Strasburg is actually generating more ground balls and weaker contact with runners on base. His infield hit percentage is triple what it is when the bases are empty, something that can be attributed to luck. With such weak contact, it’s safe to say this isn’t the problem. So it must be the strikeouts. If we take a look at his whiff rates, the results are intriguing:

2010-2014 2015
Bases Empty 20.1% 17.5%
Runners On Base 17.9% 8.6%

OK, so there’s definitely a problem here. With runners on base, he’s only whiffing batters at half the rate he’s done previously in his career, as well as half the rate that he does with the bases empty. So what’s the issue? Well, it’s not his pitch velocity:

4 Seam 2 Seam Changeup Curve Slider
Bases Empty 95.1 mph 95.4 mph 88.4 mph 81.3 mph 86.7 mph
Runners on Base 95.2 mph 94.9 mph 88.0 mph 81.5 mph 87.2 mph

Strasburg’s average velocity with runners on base is 91.5 mph, compared to 91.0 mph with the bases empty, so he’s actually throwing the ball harder when there’s runners on base. That can’t be the problem. He’s also not walking a significant amount more batters when there are runners on base, so it’s not like he’s sacrificing control for increased speed.

Without any numbers to provide a reason, it appears Strasburg’s struggles when striking out batters with runners on base are either based purely in luck or are completely mental. This is not necessarily a good thing, as we have no idea if or when he will sort it out. With his skill, Strasburg has the potential to be one of the best in the game. He just needs to get out of his own head, and maybe get just a little bit luckier.


What Has Happened to the Second Basemen?

 2nd Base hasn’t been a particularly stacked position in the major leagues in the past five years. Entering the 2015 season, the 2nd base position was headlined by Jose Altuve and Robinson Cano. The second tier arguably consisted of Ben Zobrist, Neil Walker, Dustin Pedroia, and Ian Kinsler, and maybe Brian Dozier. Then the next level housed names like Jason Kipnis, Daniel Murphy, and maybe DJ LeMahieu. I’m here to analyze what has possibly happened to this group of baseball players in the past few months.

According to the Depth Charts pre-season projections, the top eight second basemen ranked by wOBA were Robinson Cano, Neil Walker, Ben Zobrist, Jose Altuve, Dustin Pedroia, Ian Kinsler, Howie Kendrick, and Chase Utley. The projections are usually somewhat accurate, but if you’ve been following baseball at all this season, just by looking at those names, you know that we’ve found an exception to that.

These are the top 10 second baseman thus far in the 2015 season ranked by wOBA:

Name Team G PA HR BB% K% ISO BABIP wOBA wRC+
Jason Kipnis Indians 69 322 5 10% 13% 0.17 0.396 0.409 169
Brian Dozier Twins 70 310 14 9% 19% 0.257 0.276 0.363 133
Logan Forsythe Rays 72 284 8 9% 15% 0.161 0.325 0.363 139
Joe Panik Giants 69 296 6 9% 12% 0.156 0.326 0.362 137
Dustin Pedroia Red Sox 68 311 9 9% 12% 0.147 0.325 0.358 127
Dee Gordon Marlins 68 311 0 3% 15% 0.071 0.418 0.347 120
Danny Espinosa Nationals 62 229 8 9% 22% 0.187 0.317 0.345 118
DJ LeMahieu Rockies 68 274 4 7% 16% 0.103 0.373 0.344 102
Kolten Wong Cardinals 69 284 8 7% 14% 0.163 0.3 0.336 114
Jace Peterson Braves 66 270 2 11% 17% 0.103 0.337 0.327 107


If I told you in April that Logan Forsythe would be the 3rd best second baseman in the league, you would think I’m ridiculous. He came absolutely out of nowhere to raise his BABIP nearly 60 points and raise his ISO 55 points! Joe Panik’s beautiful swing has moved him up to be the 4th best-hitting 2nd baseman. Jason Kipnis has shut up all the critics. He took his .310 2014 OBP as confidence going into this year, and now has a wOBA over .400. Danny Espinosa, who has been previously known as a ‘defensive’ second baseman, has skyrocketed his offensive production into a player who Matt Williams is comfortable having run onto the field every day. Cardinals 2B Kolten Wong is pulling the ball more and more every season. He’s also upped his LD% from 19% to 25%. Braves utility-infielder Jace Peterson is doing a bit of hitting in his rookie year, after being traded from San Diego (who, it turns out, could really use him) to the Braves in December. Think back to when I mentioned the tiers up top. Where is Robby Cano on the list above? Where’s Altuve? I don’t see Zobrist, Walker, or Kinsler on this list either. It is not an error.

So we talked about the breakouts at 2nd; now lets talk about the guys who haven’t or haven’t yet lived up to expectations.

Lets start with the guy who all of his fantasy owners hate this year. Robinson Cano. Yeah, the six-time All-Star Robinson Cano. The 32-year-old — the guy who has a wRC+ of 76. This is easily, by far, his worst season of his 11-year career. Why? Lets talk about it.

Cano has raised his Hard% and his Pull% over 4% each! What does jump out at you is that he’s making a ton less contact than he did last year. Actually, the least of his whole career. His Contact% has plummeted down almost 5%. Along with a raised K%, his BABIP has jumped down nearly 50 points.

The next guy is Altuve. Altuve hasn’t been that bad this year, but compared to his 2014 campaign, he’s not playing like Jose Altuve. He’s even fighting with a mild hamstring injury, but in his 287 PA’s, every single one of his numbers are down. His wOBA has decreased .363 to .304. BB% is down, strikeouts are up, OBP and SLG are both way down. He’s swinging more, and making less contact which isn’t a combination that pulls you in a positive direction.

Same can be said for Neil Walker. Almost all his numbers are down. One of the positives that I found, though, is that he’s hitting the ball harder. My prediction is that the .303 wOBA will start to show positive regression. Ian Kinsler isn’t having a horrible season. He’s raised his OBP a bit, but he’s becoming more of a singles hitter, dropping his SLG from .420 to .338.

Almost every starting second baseman in the big leagues has totally changed their style of hitting this year. Guys like Forsythe and Panik, who were projected to be replacement level or below, have made their names rise to the top of many leaderboards. Cano and Altuve’s value have fallen. Here’s your homework: Think of all the 2nd baseman in the major leagues. How many of them have close to similar stats from their projections? Comment down below.


Different Aging Curves For Different Strikeout Profiles

What follows will look at aging curves as they relate to players with specific strikeout profiles. Specifically, we will look at how wOBA ages for players that strikeout more than the league-average strikeout rate and less than the league-average strikeout rate.

Through the research that is presented in this post, two points will be proven:

  1. Players of different strikeout profiles age—their wOBAs change—at different rates.
  2. The aging curve for players of different strikeout profiles has changed over time.

Before I present the methodology, the research that was conducted, and their conclusions, I want to give a big thank you to Jeff Zimmerman, who has not only done a lot of research around aging curves, but has also helped me throughout this process and pushed me in the right direction several times when I was stuck. Thank you.

Population

In order to give a non insignificant amount of time for a player’s wOBA to stabilize, but not place the playing time threshold for plate appearances so high that we artificially limit the population even more than it naturally is at the ends of the age spectrum, I looked at all player season from 1950 to 2014 where a player had a minimum of 600 plate appearances for the first aging curve in this post. The second aging curve in this post looks at all player seasons from 1990 to 2014 with a minimum of 600 plate appearances.

Now that we have our population, we need to split our population into two groups: players that strikeout more than league average and players that strikeout less than league average.

Because the league average strikeout rate of today is very different than it was 65 years ago, we can’t look at a player’s strikeout rate from 1950 and compare it to the league average strikeout rate of today.

In order to divide the population into two groups, I created a stat that weighs a player’s strikeout rate against the league average strikeout rate for the years that they played. For example, if a player played from 1970 to 1975, their adjusted strikeout rate would reflect how their strikeout rate compares to the league average strikeout rate from 1970 to 1975.

Players were then placed into two buckets based on their adjusted strikeout rate: players that struck out more than league average and players that struck out less than league average.

Methodology

There has been a lot of discussion over the years about the correct methodology to use for aging curves. This conversation has had altruistic intentions in the sense that it’s aim has been to minimize the survivorship bias that is inherent in the process, and, through the progress that has been made over the years, this study uses what the author has found to his knowledge to be the best technique to date. This article by Mitchell Lichtman summarizes a lot of the opinions.

While there is a survivorship bias inherent in any aging curve, the purpose of the different techniques used to create aging curves is to minimize the survivorship bias wherever possible.

What We Don’t Want In an Aging Curve 

An aging curve is not the average of all performances by players of specific ages. For example, say you have a group of 30-year-old players that have an average of a .320 wOBA and group of 29-year-old players that have an average of a .300 wOBA.

The point of an aging curve is to see how a player aged, not how they played. The group of 30-year-old players has a high wOBA because they are a talented group of players; they lasted long enough to play until they are 30. As they aged from the previous year, when they were 29 to their current age 30 season, they lost the bottom portion of players from their player pool. These are the players that couldn’t hang on any longer, whether it be because of a decline in defense, offense, or a combination of both. This bottom portion of players lower the wOBA of the current 29-year-old population through their presence and raise the wOBA of the 30-year-old population through their absence.

At the same time, the current 30-year-olds aged from their age-29 season to their age-30 season. Sure, there may be players who had a better age-30 season than age-29 season, but the current group of 30-year-olds, as a whole, still played worse at 30 than they did at 29.

When you look at the average of a particular age group, in this case 30-year-olds, you only see the players that survived, and, because they no longer play, you leave behind the players that are hidden from you sample. The method that follows resolves this issue to an extent.

What We Do Want In an Aging Curve

This study uses the delta method which looks at the differences of player seasons (i.e. a players age 29 wOBA minus their age 28 wOBA) and weighs those differences by the harmonic mean of the plate appearances for each pair seasons in question.

I would explain this further, but Jeff Zimmerman does an excellent job of this in a post on hitter aging curves that he did several years ago. While Jeff Zimmerman looked at RAA, which is a counting state, the methodology is basically the same for our purposes and wOBA, which is a rate stat:

In a nutshell, to do accurate work on this, I needed to go through all the hitters who ever played two consecutive seasons. If a player played back-to-back seasons, the RAA values were compared. The RAA values were adjusted to the harmonic mean of that player’s plate appearances.

Consider this fictional player:

Year1: RAA = 40 in 600 PA age 25
Year2: RAA = 30 in 300 PA age 26

Adjusting to harmonic mean: 2/((1/PA_y1)+(1/PA_y2)) = PA_hm
/((1/600)+(1/300)) = 400

Adjust RAA to PA_hm: (PA_hm/PA_y1)*RAA_y1 = RAA_y1_hm
(400/600)*40 = 26.7 RAA for Year1
(400/300)*30 = 40 RAA for Year2

This player would have gained 13.3 RAR (40 RAA – 26.7 RAA) in 400 PA from ages 25 to 26. From then, I then would add all the changes in RAA and PA together and adjust the values to 600 PA to see how much a player improved as he aged.

Findings

Below is an aging curve by strikeout profile for all player seasons with over 600 plate appearances in a season from 1950 until 2015.

Screen Shot 2015-04-18 at 1.23.52 PM

We can see several findings immediately:

  1. Players do age differently based on their strikeout profile.
  2. Players that strikeout more than league average peak at 23.
  3. Players that strikeout less than league average take longer to hit their peak—their age 26 season.
  4. Players that strikeout more than league average age better than players that strikeout less than league average.

From a historical perspective, this graph is fun to look at, but the way the game was played over half a century ago is eclipsed by societal evolutions that today’s players benefit from.

To give us a more realistic idea of how today’s players age relative to their strikeout rate, I made another graph the at looks at player seasons from 1990 to 2014.

Screen Shot 2015-04-18 at 1.40.36 PM

What we find in this graph, which is more current with today’s style of play, is that players still age differently dependent on their strikeout profile, but not in the same way that they did in the previous sample.

Players that strikeout more than league average still peak earlier than players that strike out less than league average, but in this more current population of players, players that strikeout more than league average peak very early—their age 21 season. This information would reciprocate the sentiment that has been conveyed through recent work that suggests that the aging curve has changed to the point that players peak almost as soon as when they enter the league.

The peak age for players that strikeout at below league average rates is still 26, but whereas this group aged more poorly than the strikeout heavy group in our previous population, players that strikeout at below league average rates now age better than their counterparts.

Conclusions

This information can make material differences for our overall expectations and outlooks on players.

Previous knowledge would suggest that players like George Springer and Kris Bryant—players who have exorbitant strikeout rates—are still on the climb as far as their talent goes, but this information shows that these players may already be at/close to their peaks or on the decline as far a their wOBA is concerned.

This information also shows that we should be patient with prospects that have a penchant to put balls is play; while they peak more quickly than they did in the previous population, they take longer to develop than players with more swing and miss in their game, and when they do start to decline, there isn’t much need to worry, because their climb from their peaks will be gradual.

Like many other studies that have looked at new aging curves, this study confirms that players/prospects peak earlier now than at any other point throughout history, but it also shows that a player’s trajectory upward and downward is dependent on characteristics specific to their approaches at the plate.

Devon Jordan is obsessed with statistical analysis, non-fiction literature, and electronic music. If you enjoyed reading him, follow him on Twitter @devonjjordan.


Hitting Wins Championships(?)

Over the past week or so, there have been baseball playoffs. And, like you, I have heard so many different opinions about what it takes to win a World Series Championship. Usually you hear “pitching wins championships”. This year, it’s “destiny”, “shut down bullpens”, and being a member of the San Francisco Giants. But what about hitting? Why is everyone so down on hitting? Isn’t it weird that the part of baseball people marvel at is brushed aside when trying to explain success in the postseason? Why have we never heard this?

Since I mostly despise the people that exclaim “THEY JUST KNOW HOW TO PLAY IN THE POSTSEASON” without any regard to statistics, I went back and looked at the World Series winners since 2002. I only went to 2002 because some data isn’t available on FanGraphs for the stats that I wanted to use.

The stats I used for this article

Starting Pitching and Relief Pitching

I used Wins, Saves, and Beard Length GB%, K%-BB%, and WAR because these are generally the three most looked at stats in terms of success for starting pitchers. I also felt it would give me a broader picture of the staff instead of just looking at WAR and being done with it.

Hitting

I used Runs, RBI, Bunts wRC+ instead of WAR because I wanted to isolate what the player did at the plate. We’ll look at defense and base running later. I also used K%, BB%, BB/K, ISO, and O-Contact%. I used the percentage and ratio stats to see if good discipline or free swinging mattered most. ISO is a better indicator of power than SLG and home runs. Using O-Contact%, however was a niche of mine that I threw in because I’ve always been scared of guys that have a bigger strike zone than others. It was also inspired by this Ken Arneson series of tweets. In theory, guys with higher O-Contact% rates are also harder to strike out, are more prone to BABIP luck, and also “put more pressure on the defense.”

Baserunning

I used BsR to measure both the weight in stolen bases and base running performance.

Defense

Even though it is far from perfect, I used UZR to quantify defense. Inspired by the Kansas City Royals, I also included outfielder UZR for this exercise.

Methodology

I picked out every WS winner since 2002 and wrote down the number of each stat mentioned above, and the league rank that went along with it. Here is my Excel spreadsheet, if you’re interested. I picked out the importance of each statistic based on top-5 and top-10 rank, and, to mirror the successes, bottom-10 and bottom-5 rank.

Results

If you looked at the spreadsheet that I linked to, you’ll notice that the statistic with the most top-5 rankings, the fewest bottom-10 rankings, AND the highest average ranking is wRC+. In fact, four of the top five stats with the highest average rank were hitting statistics. The top-5 with average rank: wRC+ 7.58, BB/K 9.17, SP WAR 10.17, ISO 10.25, O-Contact% 10.42. I’m not trying to say nothing else matters, but the data seems to suggest that teams need a better offense more than they do starting pitching, if only slightly so.

On the flip side of things, the statistic with the most bottom-10 ranks, and lowest overall ranking (K% would be lowest, but remember, lower is better with K%) is GB% for starting pitchers. Only the ’04 and ’11 Cardinals had a top-5 GB% while also getting league average (Rank > or = to 15) WAR from their starting pitchers. Six out of the 12 teams listed here posted bottom-10 ranks in GB%, which is incredibly interesting, given the theories behind ground ball pitchers that are so commonly found on the web nowadays. Does this mean ground balls are not important? Well, no. But it does mean that they may not be as important as they once were thought to be.

Base running didn’t end up being as big of a factor as I thought it would be, the Cardinals apparently care not for good defense, but look at O-Contact%! It was the fifth most important stat by average rank, and finished with only one team (’04 Red Sox) in the bottom ten, as opposed to six top ten placements. Furthermore, the rate at which teams struck out mattered more than how often they walked, but BB/K is the peripheral that seems to be the most telling.

We’ll probably never hear about how an offense won a team a World Series. In fact, we’ll probably instead hear it spun as a pitcher blowing the game. But at least now we have statistical evidence (even if it is only the past 12 years) that offense IS a major player in deciding who wins the World Series. We also have evidence to suggest that maybe hitters who expand the strike zone to their advantage are more valuable than has been discussed recently. Admittedly, this would take another article to deduce. Any takers?


Battle of the Ks: K/9, K/BB and K%

The great debate has been raging for years: which strikeout-related metric is a better predictor of actual pitching success? Some would say there is no right or wrong answer — that each metric has it’s own unique merit and value. That one must look at certain strikeout-related metrics in combination with others. Unfortunately, as tragic as it may seem, statistical evidence begs to differ. Statistics tell us there is in fact a right answer, and it’s a whopper.

Let’s start with K/9. Looking at all 2013 pitchers with 80+ innings, the correlation (R2) between strikeouts per 9 and ERA is a solid  .1081. This correlation has been consistent, plus or minus a few hundredths, for the past five years. So nothing exciting or anomalous can be found in looking at other seasons. Yu Darvish leads the category with Tony Cingrani, Max Scherzer, Anibal Sanchez, and A.J. Burnett rounding out the top five. Additionally, eight of the top ten K/9 leaders ended up with sub 3.10 ERAs. So a decent indicator all-around.

 photo 53a65e17-24d6-482d-b2de-766753f09051_zps2940fbe7.png

K/BB get’s a bit more interesting. We see a jump in linear correlation to .1671 — more than a 50% increase over K/9. Clayton Kershaw, Cliff Lee, and Adam Wainwright  all leap into the top ten of this metric, with Hisashi Iwakuma climbing into the top fifteen — four elite hurlers in 2013 left out of the K/9 leaderboard.

 photo 98225caf-a307-44c3-850b-d610a9444d32_zps70ee67d9.png

But the real gem is K%. It shows double the correlation versus K/9. Plus, the top fifteen in this category ended the year with sub 3.30 ERA — whereas Scott Kazmir (4.04) and Josh Johnson (6.20) smeared the good name of the K/9 leaderboard; with Kevin Slowey (4.11) and Dan Haren (4.67) unpleasantly loitering on the K/BB board.

The reason K% is so powerful is that it simplifies how effective a pitcher is at simply striking out each batter he faces. When BABIP gets involved — as it does for K/9 (high BABIP pitchers are rewarded on K/9 since the number of outs remains the same even if they’re giving up, say, 10+ hits per game) — the value of each strikeout is severely reduced.

 photo 17feabf1-8665-45c5-af39-48d69923e54a_zpsf45972cf.png


To recap:

2013 R2 (correlation to ERA)
K/9 .1081
K/BB .1671
K% .2089

So should we end the debate completely? No. But if you asked me to put money on Tim Lincecum, a career 25.8 K% pitcher with no decline in the stat over the past 2 years, over Tyler Chatwood, a career 13.0 K% who had a breakout year in 2013 with his freakish 76.3% LOB, I would bet on Lincecum every doggone time.