Archive for Jon Lester

Who Obtains the Most Assistance in Pitcher Welfare?

Nobody’s perfect, especially umpires. This is the case at any level of the game. Be it softball, tee ball, or baseball, from Little League to the Big Leagues, you will have undeniably disagreed with a call that an ump has made.

Given the movement, velocity, and the newly anointed skill of pitch framing, it’s becoming more difficult for umpires to get the calls right. The robo ump has been discussed quite a bit but I’m not sure how I feel about a machine making decisions in lieu of accepting the concept of human error. We did it for decades before instant replay was instituted.

Umpires get balls and strikes wrong a lot. It’s the way it goes. Given that understanding, I wanted to know which pitcher has in recent years been the beneficiary of favorable calls.

And, like the umpires, not all (strike zone) charts are 100% accurate; leave a little room for error here.

I’ve parsed data on which pitchers have had the most declared strikes that were actually out of the zone. I decided to stop at 2014 because I felt that four years of information was sufficient for the study.

First, the accumulated data.

From 2014 to 2017, the amount of pitchers with phantom strikes has been increasing at fairly high rate; the biggest leap was from 2014 to 2015 (36 pitchers).

chart (4)

Interestingly, the pitchers with at least 100 ‘phantom strike’ calls has actually decreased.

chart (6)

And, despite the jump in total pitchers involved from ’14 to ’15, the pitchers with <=100 strikes called decreased at the highest rate.

Should we go tin foil hat and infer that umps are no longer favoring certain pitchers as much as they used to? Doubtful, but I’m not investigating integrity here.

So who is getting the most benefit from the perceptively visually impaired? First, I took the last four years of pitching data for our parameters. Then, I cut final the list down to a minimum of 10,000 pitches thrown. Lastly, I included only the top 20 pitchers in the group.

20PhantomStrikes

As we can see, Jon Lester of the Chicago Cubs has been the most aided overall; 562 non-strikes in four years.

For the optically minded, here is the pitch chart of Lester’s data.

Jon Lester
That’s A LOT of Trix!

Now, lets see if the percent of pitches has any impact on our leader(s).

20PhantomStrikesPercent

Not a whole lot of variance, at least near the top. Lester clearly wins The MLB Umpires’ “Benefit of the Doubt Award”.

OK, so now we’ve got our man. Case closed, right?

Oh…that little caveat of ‘pitch framing’. Perhaps its that Lester has had great framing from his catchers. Let’s look into that.

For the moment, we are going to focus on Lester and his primary catcher from 2014-2016, David Ross.

dRossLester

Clearly 2014 was Lester’s most favorable year with Ross. That year, Lester ranked third in total pitches called favorably out of the zone (156) and 11th in ratio of calls (4.47).

The subsequent years with Ross are as follows:

2015- 6th (141), 10th (4.43)
2016- 5th (125), 7th (3.95)

Here’s where things get a bit intriguing. Recapping 2017, things appear to fall apart completely for the Cubs in the context of pitch framing.

2017CubsFraming

The only catcher who was able to garner a positive framing rating was Kyle Schwarber, who caught just seven innings that year. But even his stats are far from impressive.

And how did Lester fair in terms of ‘phantom strikes’ that year? He ranked first in overall strikes called out of the zone (150) and fourth in total call ratio to pitches thrown (4.46).

He wasn’t all that far from the top under Ross, but was basically the frontman of the metrics in 2017.

Some things are hopelessly lost in the sphere of the unexplained. But, the research didn’t set out to find reasoning. In this case its more fun to be left with subjective theories. However, it’s a bit silly to think that there is actually an umpire conspiracy allowing Lester to succeed when he apparently shouldn’t.

My best guess is maybe they feel sorry for him since he can’t accurately throw the ball in the infield anywhere other than to the catcher (which did changed a bit in 2017)?

Regardless, Lester is our guy, here; receiving a sizable edge in terms of missed calls. It will be interesting to see if this trend continues this season.


Poking Holes In Some of the Best Players of 2016

We are reaching the end of the 2016 fantasy-baseball season, which means two things: 1) It’s time to look ahead to next season a bit, and 2) the sample sizes on many metrics are either stabilized or right around the corner from stabilizing.

With that in mind, let’s take a look at a few of players who are sure to be trendy draft picks in 2017, and see what their potential downfalls might be. This is not to say to avoid these players, but rather to spot a potential weakness so that if you do draft this player, and they start to struggle you can maybe know why, and see if it is a recurring issue, instead of just a bit of bad luck. Let’s meet our contestants:


Rougned Odor

In many ways Rougned Odor has had his coming-out party this season. He has hit 31 home runs through 135 games, adding in 12 steals, to go along with a .282 batting average, and strong production (85 runs and RBI each). He’s been the fifth-best second baseman by the ESPN player rater, and that’s with two players (Daniel Murphy and Jean Segura) with multiple positions above him in the ranks. He even got famous on the national scene with his punch heard round the hot-take tables in May.

However, when looking at his plate discipline, it has somehow got even worse than it was last year. His walk rate has dropped to 3.0 percent (17 walks all season!), while his strikeout rate has climbed above 20 percent (20.9, to be exact). His swing rate on pitches outside the zone is seventh in all of baseball, while his contact on those pitches outside the zone isn’t even in the top 80. That’s a dangerous duo. Talented players who hit the ball as hard as Odor can sustain success while flailing that much for a little while, but in the long haul, it almost always burns you. Odor could certainly make strides to improve his discipline, but coming off the season he is having, why is he going to try to change anything? He may well need a rough season, or at least rough couple of months, to admit he needs to fix the holes in his swing, and you don’t want to deal with that when he does.


Jon Lester

With a record of 16-4 and a 2.51 ERA, Lester is having arguably the best season of his career. He’s a candidate for the Cy Young, and currently trails only Noah Syndergaard and teammate, Kyle Hendricks, in the race for the lowest ERA in all of baseball. There are plenty of signs for regression, though.

For starters, Lester is 32, and while left-handed pitchers seem to age like a fine wine sometimes, that’s only because we forget about the guys who crash and burn and are out of the league by 34. Now Lester is showing no real signs of aging, but he also has signs of regression elsewhere.

His left-on-base rate is currently leading all qualified pitchers, at 85.5 percent. That’s more than 10 percent higher than his career rate, and by far the highest percent of his career. That’s especially amazing considering Lester can’t even throw to first base, meaning runners should be moving around the bases faster on him if anything. He is also one of the FIP-ERA leaders, thanks to a well below-average opponent BABIP (.257).

There’s also the fact that, while not by a huge margin, Lester’s strikeout rate has also dropped this season, while the rest of the league is striking out more batters than ever. If you’re already going to get some regression in terms of ERA and wins, you best not be losing strikeouts, as well.

I don’t think Lester is going to fall off a cliff, but I also don’t think he’ll be repeating his 2016 performance next year.


Michael Fulmer

We’ll start with the most obvious candidate for overdrafting. Fulmer will be a 23-year-old, (likely) coming off an American League Rookie of the Year Award, and pitching for a strong Tigers team. He may well win the AL ERA crown, and will easily have a winning record. Heck, he’s got an outside shot at a Cy Young in what has been a weak year for AL pitchers.

That being said, there are some definite weak spots in his profile, the most obvious being his FIP-ERA. If one were to simply go to the FIP-ERA leaderboard — a good spot to at least start to find potential regression candidates — Fulmer’s name is sitting there in fourth, trailing only Kyle Hendricks (borderline historic ERA), Brandon Finnegan (a guy who would have certainly made this list if he were famous enough), and Ian Kennedy (a professor at Hogwarts in the baseball offseason).

It’s more than just the FIP with Fulmer, though. His left-on-base rate is over 80 percent (81.3, to be exact), and his opponent BABIP is just .251. He allows over 30 percent hard-hit rate and his line-drive rate allowed is nearly 20 percent, which while not terrible, do not portend a Cy Young winner.

With Fulmer, it’s more an accumulation of slights rather than one big one, combined with the fact that he will be an extremely trendy pick. There’s no reason to believe he won’t finish the year 13-8 with a 3.35 ERA and 140 strikeouts, but you’ll have to pay for much better stats than that to land him.


Ryan Braun

Like all of the players on this list, Braun is having one of his best seasons in 2016, which is saying something for the six-time All-Star. Braun is hitting .310 with 27 home runs, both of which are his highest since 2012. He has also stolen 14 bases, and only been caught three times, impressive for a 32-year-old.

But it’s not Braun’s age that is troubling (although it is obviously worth remembering come draft day); it’s his ground-ball rate. Braun is seventh in all of baseball in ground-ball rate, surrounded by names like Jonathan Villar and Cesar Hernandez. He has hit ground balls on 55.6 percent of the balls he has put in play in 2016, and has only hit fly balls on 25.4 percent. Because of that, it’s hard to imagine his home-run totals staying as high as they are right now in 2017.

Braun is currently sporting a HR/FB rate of 28.4 percent, highest in the major leagues. Ask Jose Abreu owners what it is like to own the reigning HR/FB rate champion. Here’s how the last four HR/FB rate champions fared the next season:

2012 Adam Dunn – 41 HRs; 2013 Adam Dunn – 34 HRs

2013 Chris Davis – 53 HRs; 2014 Chris Davis – 26 HRs

2014 Jose Abreu – 36 HRs; 2015 Jose Abreu – 30 HRs

2015 Nelson Cruz 44 HRs; 2016 Nelson Cruz 35 HRs (with 18 games to go)

Only Chris Davis fell off the earth, but none of the four went up. If you’re buying on Braun’s power, you’re basically buying at its highest point, which is never a good idea. Especially with a 32-year-old.


Jose Fernandez

Yes, we are getting a little bit into “snake eating his own tail,” by turning advanced metrics against Jose Fernandez, after spending all of the first couple months using the advanced numbers to show a turnaround was imminent, but it was foolish to ignore Fernandez’s biggest weakness: his line-drive rate allowed.

Opponents are hitting line drives off Fernandez 29.3 percent of the time in 2016, by far the highest percent among qualified pitchers, and a rate that tops even Freddie Freeman, the 2016 league-leader in line-drive rate.

Part of that can be explained by the fact that Fernandez throws so hard, that of course the ball is going to come out faster — that’s just physics. It also isn’t as big a deal to allow such a high line-drive rate, when you also have, by far, the highest strikeout rate in the big leagues this season (34.9 percent). It doesn’t matter how hard you hit it, if you simply can’t hit it.

However, that line-drive rate certainly helps to explain the fact that opponents have a BABIP of .341 off Fernandez this year, a figure that would seem due for some regression in favor of Fernandez if we missed looking at the full picture. Some 2017 drafters may see Fernandez’s .341 BABIP and his 2.27 FIP and assume that his 2017 ERA will drop into the low 2.00s. If Fernandez keeps allowing line drives at the rate he has this season, there’s no reason to think his ERA will drop at all. Now drafting a player with an ERA of 3.00 and the best strikeout rate in baseball is still never a bad idea, but if batters start to elevate their swings against Fernandez, while maintaining that same hard contact, Jose could see his home-run rate jump up quite a bit, even when pitching in pitcher-friendly Marlins Park.

Fernandez allowed just as high a line-drive rate in his 11 starts in 2015, and while some of it may still be noise, it is something to keep an eye on. Especially if you have Fernandez in a long-term keeper league, and he eventually makes a move to somewhere like Fenway where the stadium might be a lot less forgiving than in Miami.


The Resurgence of Jon Lester: How a Small Mechanical Change Brought Back a Pitch that Earned Millions

Jon Lester just got paid. Early Wednesday morning, it was announced that Jon Lester accepted a 6-year $155M contract with a vesting option for a 7th year to become a member of the Chicago Cubs. This is over $20M more than the FanGraphs readers predicted in the offseason free agent crowdsourcing. This is the same pitcher that the Red Sox offered a 4-year $70M extension to prior to the season and proceed to nearly double their offer to $135M in the off-season. Before 2014, it was reasonable to think Jon Lester might be looking at a deal similar to the 5 years $90-95M that has been predicted for James Shields. What did Lester do to convince teams he is closer to a $200M pitcher than a $100M pitcher? He looked like the elite Lester we saw in 2009-2010, and not the merely very good pitcher he was in the past few years. How did he improve in his contract year? Let’s take a look.

Jon Lester fWAR/Season fWAR rank FIP FIP rank K% K% rank Contact % Contact% Rank
2009-2010 5.8 9th 3.14 10th 26.4% 2nd 76.1% 7th
2011-2013 3.6 16th 3.84 60th 20.4% 48th 80.9% 68th
2014 6.1 6th 2.80 9th 24.9% 12th 78.6% 29th


Lester was one of the top pitchers in the game during the 2009 and 2010 seasons, and even placed 4th in AL Cy Young voting in 2010. His peers were Felix Hernandez and Adam Wainwright, along with Lincecum and Sabathia (before they became husks of their former selves on the mound). While WAR still treated Lester well in 2011-2013, partially due to the sheer number of IP and park and league statistical adjustments, his FIP placed him in the leagues of Kyle Lohse, Homer Bailey, Yovani Gallardo and Ian Kennedy. During that period, Lester’s opponent contact rate and swinging-strike rate were the same as those of Clay Buchholz. So comparing a theoretical Lester deal to the Bailey extension, which was looked at as an overpay by some, didn’t seem unfair. From 2011-2013, Lester trailed Shields by over 2 WAR, so a similar contract didn’t seem unfair prior to 2014.

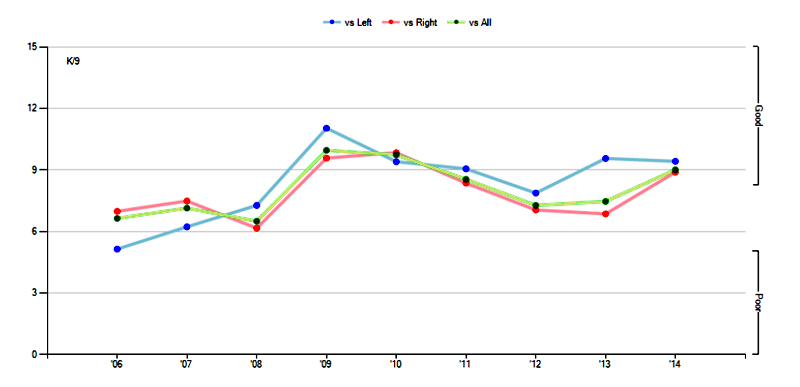
What caused Lester to fall from the ranks of the elite and become more of a number-two starter? The strikeouts disappeared.

800x387xlester-l-r.png.pagespeed.ic.p9Ej

800x394xlester-k9.png.pagespeed.ic.-Zrox
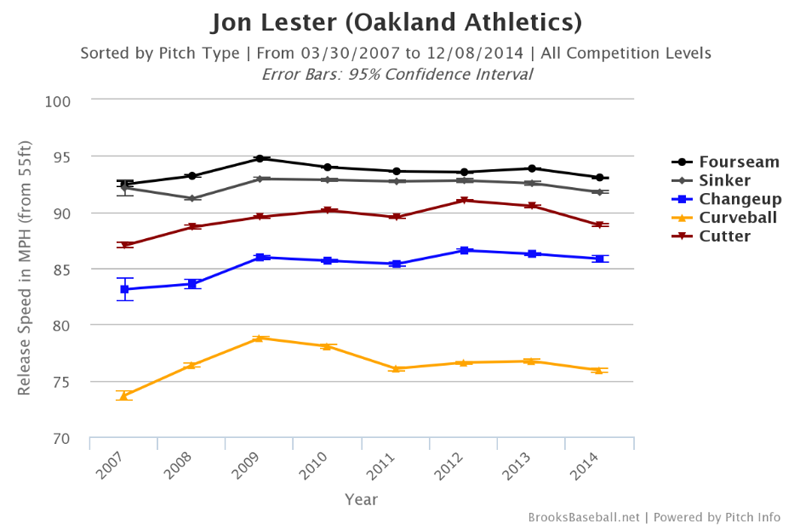
The problem was especially apparent against righties, whom he struck out at only a 17.9% clip in 2013 (compared to 26.3% in 2010). What caused this decline? Let’s take a quick look at the Pitch F/X data. A lot of people are under impression that the decline was due to velocity loss that occurs with aging. This isn’t really the case for Lester. Lester’s fastball velocity has declined by less than one mile per hour, from 94 MPH in 2010 to 93.2 MPH in 2014. While the cutter and curveball have lost velocity, they aren’t as dependent on velocity as the fastball:

800x529xlester-pitch-type.png.pagespeed.
If we take a look at his pitch usage, we notice two things: He has for the most part ditched the sinker and changeup in favor of the fastball, cutter, curveball combination that our Matt Trueblood detailed in his recent piece.

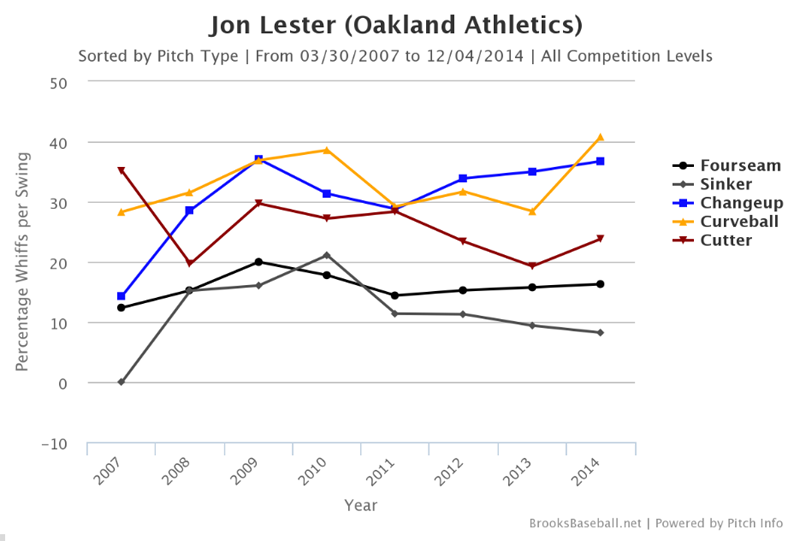
Let’s take a look for the most telling data for any pitcher: the ability to get hitters to swing and miss.

800x541xlester-whiff.png.pagespeed.ic.Br

Lester’s fastball generated whiffs on 16.3 percent of all swings in 2014, his best mark since 17.8 percent in 2010. That is around the league average of 16.4 percent, according to Eno Sarris’s benchmarks. The cutter, which he is throwing at a career-high frequency of 31.0% of all his pitches, is generating a whiff-per-swing rate of 23.8 percent (5th in MLB, minimum 500 pitches thrown), above the league average of 21.4%. The pitch isn’t as good as it used to be, when it generated whiffs on over 28 percent of swings, for reasons Sarris detailed last year. However, it’s still a very good pitch that was even better in 2014 due to improvements in the horizontal movement.

The curveball, though, is what’s special. In 2014, Lester’s curveball generated whiffs-per-swing on 40.8 percent of opponents’ swings, the highest mark of his career—and 12 percentage points more than in 2013, when his curveball was league-average in that regard. In 2014, It was the best curveball in the league in terms of whiffs per swing, with pitchers like A.J. Burnett, Adam Wainwright and Sonny Gray behind him.

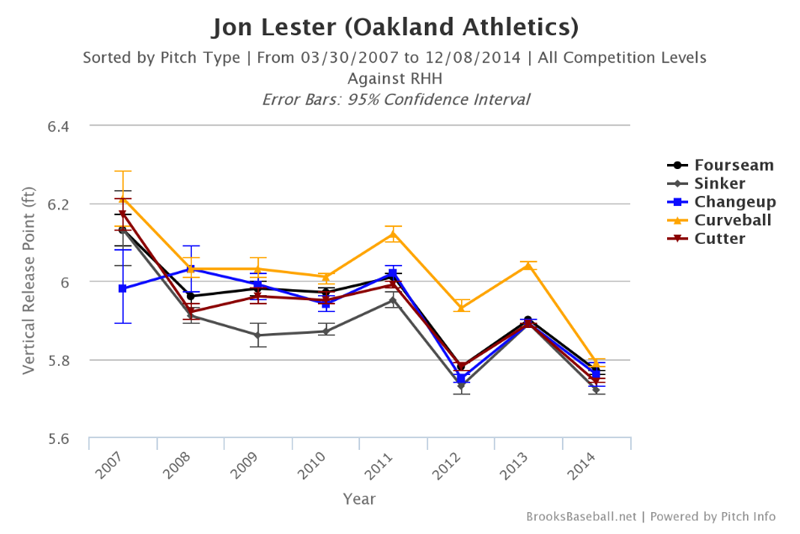
Now what happened to the curveball? It didn’t gain velocity. It didn’t gain movement. It gained a more consistent vertical release point. Look at 2014. Lester changed his release point on all pitches, but as you can see, the release points of the fastball, cutter, and curveball are tightly grouped together. Now look at 2009 and 2010, and compare it to 2011-2013. It appears that in his “peak years,” Lester maintained a better-disguised release point on the curve than he did in 2011-2013.

If the curveball was being tipped or was less deceptive, righties would have the best look at it.  Let’s check that out:

800x534xlester-release.png.pagespeed.ic.

nAa3HGr.png


NqtDfGc.png

There is something incredibly satisfying in finding the results we might expect. The curveball generated 41.4% Whiffs/Swing vs. righties compared to the 25.8% in 2013. Lester’s Curveball caused 25 Ks against righties, 6th in baseball compared to 2014 when it only caused 6. This is exceptional because he only generated 55 whiffs on the CB vs. RHH. When righties do make contact, they aren’t hitting it hard, only slugging .151 against the hook last year, compared to .338 in 2013. Righties aren’t picking up the curveball like they were before, and in 2014, that solved the platoon issues he had against them in previous years. Trueblood said, “Lester might have tapped into something that will allow him to dominate right-handed batters in the future.” That something is the curveball. It allowed him to ditch his changeup with little consequence.

The gist is that 2014 Jon Lester was more like 2009-2010 Jon Lester than 2011-2013 Jon Lester. A mechanical adjustment allowed the curveball to reemerge as an elite weapon in Lester’s arsenal, complementing a very good cutter and an above average fastball. It also allowed him to enjoy success versus righties again. The question is: How sustainable is this change? If Lester can lose his mechanics for years, is there serious risk of him losing them again? Can he continue to improve? If he can bring the curveball back to its former glory, can he regain a bit more movement on the cutter again? Can he bring back an effective sinker, giving him a deeper arsenal? These are the questions on which the Cubs will be betting $155 million on. If these changes can be sustained, it wouldn’t be surprising if Lester is worth the contract barring injury. Just one 5 WAR season can be worth $40M on this market. Lester made a slight change to his mechanics and it just might have earned him tens of millions of dollars.