Archive for Fantasy Baseball

Ottoneu Tools: Advanced League Standings

Ottoneu Tools: Advanced Standings (Part One)

Whether you’re brand new to Ottoneu or a “seasoned” veteran in your fourth year, your league’s Standings page is likely to become your best (or worst) friend over the course of a given baseball season. However, if you often find yourself cheering or panicking based on just a few days’ worth of small but evolving linear weights data without the proper, broader context with which to make meaningful decisions about your team, you are not alone. Welcome to the Ottoneu “Advanced Standings” dashboard. The brainchild and early creation of Bill Porter (@wfporter1972), the Advanced Standings dashboard will provide you with the sabermetric performance data you want with the detail you need.

How It Works:

Before you get started you will need to download the current version of the Advanced Standings dashboard here (http://goo.gl/Tozhy4). Note: You will need the most up to date version of Excel to take full advantage of the dashboard features. Also, this Advanced Standings dashboard only works with FGPoints Ottoneu format leagues (for now).

While it may look overwhelming at first, the dashboard is designed to be easy to use. In fact, it’s designed to be updated quickly and often without requiring a lot of Excelmanship. With as little as two easy steps you will be able to see “inside” your league standings in a way not available on the website.

First, go to your league’s traditional STANDINGS page within Ottoneu. From the bottom right of the standings stats (begin just to the right of the last P/IP on the right hand bottom corner), highlight all standings data with your cursor (including team names). Do not export the standings to Excel. Also, do not highlight the headings bar that includes the column titles (AB, H, 2B, etc.). COPY this information and then go to the first tab (“Advanced Standings”) of the Excel dashboard. In cell A4 (1st team name in column), PASTE SPECIAL and select TEXT. When pasted, your league’s standings will populate this tab and you will have visibility of many advanced statistics tailored exactly to your league.

Second, to have more accurate league standings information, go to your league’s REPORT page within Ottoneu and at the bottom of the page highlight all the information (excluding the column headings) in the “Projected Games Played and Innings Pitched” section. Once selected, COPY this information (including team names), and PASTE SPECIAL – TEXT this data into Tab 2 (“Reports”) of the dashboard spreadsheet, in cell A2.

Yeah, it’s that easy.

In Part Two I will revisit some of the key features of the Advanced Standings Dashboard and how it can be best used to analyze your league  You can also learn how to go much deeper into these advanced standings from reading Bill’s recent post on this subject here (http://goo.gl/XkDzXV). Until then, enjoy playing with the dashboard tool. If you have questions or want access to some additional Ottoneu tools, feel free to DM me on Twitter @Fazeorange and I will send you a link to the Ottoneu Dropbox folder.

Enjoy

Expected RBI Totals: The Top 267 xRBI Totals for 2013

While there is almost zero skill when it comes to the amount of RBI a player produces, through the creation of an expected RBI metric I have found a way to look at whether or not a player has gotten lucky or unfortunate when it comes to their actual RBI total.

I hope I don’t need to do this for most of our readers, because it’s 2014 and you’re reading about baseball on a far off corner of Internet, so you obviously are more informed than the average fan who consumes ESPN as their main source of baseball information, but lets talk about why RBI, as a stat, and why it is not valuable when you look at a players’ talent. The amount of RBI a player produces are almost—we’ll get into the almost a little later—entirely dependent on the lineup a player plays in. If a player doesn’t have teammates that can get on base in front of them in the lineup, there aren’t very many opportunities for RBIs; that’s the long and short. Really, RBI tell more about the lineup a player plays in than the player himself.

Intuitively, this makes sense.  The more runners there are on base, the more chances the batter will have for RBI, and the more RBI the batter will accumulate. When I said, “The amount of RBI a player produces are almost…entirely dependent on the lineup a player plays in”, lets be a little more precise. My research took the last three years of data (2010 to 2013) and looked at all players that had 180 runners on base (ROB) during their at bats over the course of a season. Over the three seasons, which should be enough data—it was a pain in the ass to obtain the data that I did find—ROB correlated with RBI by a correlation coefficient of .794 (r2 = .63169), which is a very strong positive relationship.

But hey, that doesn’t mean that you can be a lousy hitter get a lot of RBI. That would be like if you threw a hobo in the Playboy Mansion and expected him to get a lot of tail; all the opportunity in the world can’t mask the smell of Pall Malls, grain alcohol and a lifetime of deflected introspection; trust me, I worked at a liquor store for three years in college, and I know.  In the same sample of players from 2010 to 2013 as used above, the correlation between wOBA—what we’ll use here to define a player’s ability at the plate—and RBI is .6555. So there is a relationship between a player’s ability and their RBI total, but nowhere near as strong as the relationship between their RBI total and their opportunity—ROB.

However, when we combine a player’s opportunity—ROB—with their talent—wOBA—we should get a good idea of what to expect for a hitter’s RBI total. Here is the formula for the expected RBI totals based on the correlations between ROB and wOBA, and RBI: xRBI =- 85.0997 + 262.7424 * wOBA + 0.1918 * ROB.

When you combine wOBA and ROB into this formula you end up with a correlation coefficient of .878 and an r2 of .771. Wooooo (Ric Flair voice)!!!!!  With the addition of wOBA to ROB we increase our r2, from .63 with just ROB, by fourteen percent.

2013 Expected RBI Leaders

Click Here to See xRBI Leaderboard

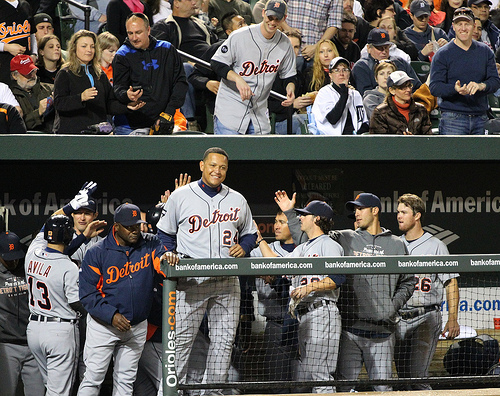
Miguel Cabrera
Photo by: Keith Allison

Let’s think about why Chris Davis’ xRBI is so much lower than his 2013 actual RBI total.

Davis had 396 runners on base while he batted in 2013, which is 140 ROB less than Prince Fielder who led the league with 536 ROB; Davis’ opportunity was limited.

Davis’ RBI total was considerably higher than what his opportunity would suggest his RBI total should be, and one of the reasons that he outperformed his xRBI total by so much was because of the amount of home runs he hit. Davis, or any batter, doesn’t need a runner on base to get an RBI when he hits a home run. But beyond home runs there is another reason why Davis and other batters outperform their xRBI totals: luck.

Hitting with runners on base is not a skill. A batter has the same probability, regardless of the base/out state, of a hit. Lets forget pitcher handedness and Davis’ platoon splits at the moment. With a runner on second base and two outs Chris Davis will get a hit .272 (27%) of the time—I averaged his Steamer and Oliver projections for 2014 together. Davis, and Alfonso Soriano for that matter, who was the only player to outperform his xRBI by more than Davis in 2013, was lucky and happened to have runners on base the majority of the 28.6%—Davis’ 2013 batting average—of the time he got a hit in 2013.

To put Davis’ 2013 136 RBI season into perspective, in the last five seasons there have been eight players to record 130 or more RBI in a season. Of those eight players, only two—Ryan Howard (2008-9) and Miguel Cabrera (2012-13)—were able to duplicate the performance the following year.

While the combination of ROB and wOBA has allowed us come up with a reliable xRBI, the next step, to increase the reliability of xRBI and account for players who produce a large amount of their RBI from home runs (i.e. Davis), is to include a power component in xRBI: HR/FB ratio.

Follow Me on TwitterDevin Jordan is obsessed with statistical analysis, non-fiction literature, and electronic music. If you enjoyed reading him, follow him on Twitter @devinjjordan.


Justin Verlander: Ready to Regain Righteousness

So last year in my 10-Team, 35 man roster, dynasty fantasy baseball league, I found myself in need of some starting pitching after the first two months of the season. I was last in my league in quality starts, and near the bottom in ERA and WHIP. Manny Machado was my cornerstone 3rd baseman, and he was hitting a fiery .355 for the month of May. For how good he is, I did not believe he was a batting title contender, so was interested in seeing what I could get for him.

Enter Justin Verlander. The Tigers’ ace, (at the time) had a 1.83 ERA and was 3-2 in April, and had hit a rough spot in May where he surrendered 16 ER in 12.2 innings. After going 17-8 with 239 K’s in 2012, I felt like this was a great time to buy low on the guy, while selling high on Machado. So I traded the Orioles’ phenom for the Mr. Kate Upton. Well, safe to say, that WAS NOT the trade that ended up winning me the league. From the end of May forward, Verlander posted a 3.36 ERA for the remainder of the season and was walking batters like it was the cool thing to do, posting a 3.07 BB/9 (which is AWFUL for him). He ended the season with a 3.46 ERA and only 13 wins, which were his worst totals in those categories since 2008. This isn’t an argument against Machado’s lack of offensive ability, which I will discuss at a later date. Instead, I will be telling you why Verlander’s performance last season was a fluke, and he will regain his Cy Young form in 2014.

As pitchers age, they usually lose a little oomph on their fastball. People will probably look at Verlander and assume this is the reason why he was less effective in 2013.


Year

Age

Fastball Velocity (average)

2010

27

95.5

2011

28

95.0

2012

29

94.7

2013

30

94.0


Based on the table above, you can see how he has lost some velocity on his fastball. For more detail, follow this link to view his velocity charts for 2013 and compare it to his prior years. If you notice, in his first five starts of 2013, his fastball average was hovering around the 93 mph mark, well below his average of the last four years, 95.2 mph. In those first five starts, Verlander posted an ERA of 1.83, had a K/9 of 9.38, WHIP of 1.19, and held batters to a .242 average. Even with a fastball that seems to be slowing down, Verlander has still found a way to retire batters, and more importantly, still strike them out. So the argument that his fastball is becoming “too hittable” isn’t necessarily correct.

BABIP, for those of you who don’t know, is the percentage of time that if a batter makes contact with a ball and puts it in the field of play, it will go for a hit. Generally, the league average for hitters falls somewhere between .290-.310. But there are plenty of factors that can influence BABIP, such as a player’s skill, defense behind a pitcher, and our good friend LUCK. More on that in a moment, but first, let’s establish what factors influenced Verlander’s BABIP. From 2008-2012, Verlander had an average BABIP of .282, which is below the league’s average range of .290-.310. Based on this sample size, we can assume Verlander’s skill set is above the mean for pitcher. Secondly, Defense. According to baseballreference.com, the Detroit Tigers ranked 12th out of 15 AL teams last year in errors and double plays. On a more optimistic note, they were 4th in fielding %. Those numbers indicate that they were a mediocre, at best, defensive team, which would cause Verlander’s BABIP to slightly increase toward the league mean. Lastly, we don’t have a way to measure luck, but Verlander’s 2013 BABIP was way above his recent average of .282, sitting at .316.

Point being, there were too many balls that were put in play that fell for hits considering all the conditions I stated above for Verlander.

It was not just his inflated BABIP that led to a down year in 2013 for Verlander. He posted a five-year high in BB/9, at 3.09. When you walk people and then give up hits, runners are bound to score. In 77.2 innings in June and July of last year he walked 33 batters. In the final 97.2 innings of last season and the playoffs, he only walked a combined 22 batters. He was able to regain his control in the second half that he had lost mid-way through 2013. I think the control he demonstrated toward the end of 2013 will carry over into 2014.

One more random stat to consider: Verlander’s IFH% (infield hit percentage) for his career sits at 5.9%. Last season, that stat jumped up to a recent high at 8.3%. Reasons for that stat being high could result from the inefficiencies of Miguel Cabrera at 3rd base, or inconsistent defense of Jhonny Peralta. The Tigers now have the more athletic Nick Castellanos at 3rd, and made a mid-season trade last year for Jose Iglesias. Both of those additions provide upgrades defensively for the Tigers compared to last year.

With everything that I’ve discussed, this guy is being way undervalued in fantasy drafts this year, going in the 5th or 6th rounds depending on the format. If you can grab him in the 4th over guys like Zach Greinke or Madison Bumgarner, I would do so. He still strikes people out at a high rate, posting 217 K’s last year. Also, don’t forget that he pitches for a team with one of the most potent offenses in the game. When Verlander’s BABIP regresses, his improved defense and control kicks in, he will regain his righteousness.


Ottoneu Tools: FGPoints

Below are two tools for Ottoneu FGPoints players to be used for the 2014 MLB season.  The first tool is a roster building tool that will provide 2013 statistics, including platoon splits, for offensive players.  Ottoneu players can use this tool to construct their team and prepare for 2014 auction drafts.

The second tool is a 2014 player projection tool that Ottoneu players (and commissioners) can use to estimate player projections for the 2014 season.  The tool incorporates Steamer, Oliver, and 3 Year Average stats for each player and then allows you to enter your own projections for the 2014 season.  Your own projections (will auto-populate FanGraph’s “Fans” projections as of 2.8.14…you can override these projections by entering your own) will load the team dashboard at the top of the tool and provide you with a summary of what you can expect from your Ottoneu team in 2014.

Roster Breakdown w/platoon splits:

http://bit.ly/1iCKkvl

2014 Team Projections Tool:

http://bit.ly/1eh614z