Hit Batters as Collateral Damage of Rising Strikeout Rates
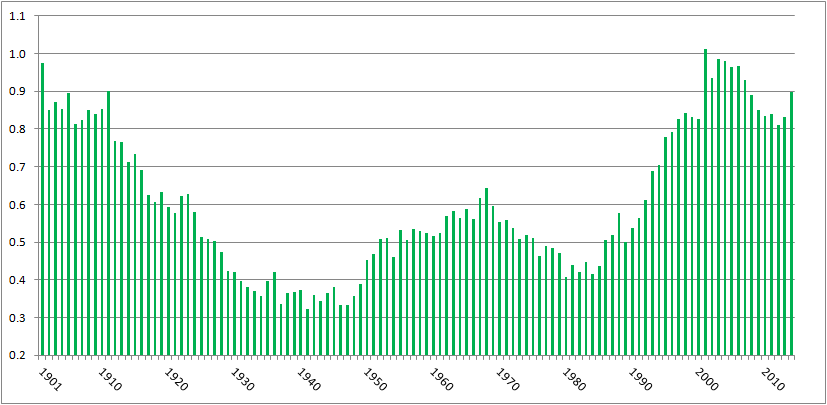
In the past, I’ve written about batters being hit by pitches–specifically, how the rate of hit batters is near all-time highs yet it hasn’t generated much, if any, outcry. Here’s a chart of hit batters per game, from 1901 (the start of the two-league era) to 2014:

There were 0.68 hit batters per game in 2014, the eleventh-highest total over 115 years of two-league play. The top ten years, in order, have a 21st century slant: 2001, 2004, 2003, 2006, 1901, 2005, 2007, 2002, 2008, 1911.
Or, pretty much the same chart, here’s hit batters per 100 plate appearances:
There were 0.898 batters hit per 100 plate appearances in 2014, the tenth highest amount in the two-league era. The ten top years are, in order, 2001, 2003, 2004, 1901, 2006, 2005, 2002, 2007, 1911, and 2014.
Commenter jaysfan suggested that the modern emphasis on going deep into counts has changed the number of pitches thrown per game, so perhaps hit batters per pitch haven’t changed much. It turns out the pattern still holds. Here’s a graph of hit by pitch per 100 pitches, using actual pitch counts from FanGraphs for 2002 to present, and Tom Tango’s formula of Pitches = 3.3 x plate appearances + 1.5 x strikeouts + 2.2 x walks for the preceding years:
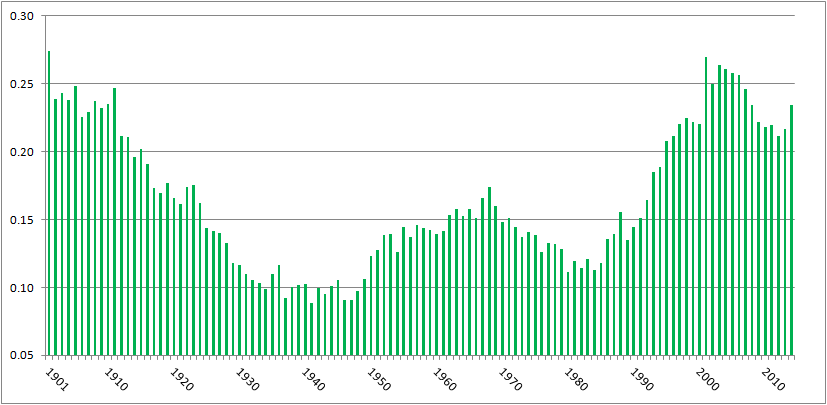
With 0.234 hit batters per 100 pitches, 2014 ranks 16th all time, behind 1901-1905, 1908, 1910, 1911, and every year from 2001 to 2007. Again, a pronounced millennial bias. (Source for all the above graphs: Baseball Reference and FanGraphs)
It’s clear, then, that we’re seeing batters getting hit at the highest rate in a century. I tried to figure out why, and came up dry. Left-handed batters, who face a wider strike zone than righties, aren’t leaning across the plate and thereby getting hit at a proportionately higher rate. HBPs are not inversely correlated to power, with pitchers more willing to pitch inside now to hitters who less frequently pull inside pitches down the line and over the fence. College graduates are slightly more likely to get hit by pitches than other hitters, but not enough to explain the change. Batters setting up deeper in the batter’s box, as measured by catcher’s interference calls, isn’t correlated to HBPs.
However, commenter Peter Jensen noted, “I don’t think there is any question that pitchers throw more to the edges of the strike zone when they are ahead in the count. This could be confirmed with a pretty simple Pitch Fx study. And if they pitch to the edge more they are also going to miss inside more (and outside more) so this could partially or even wholly account for why there are more HBPs in pitcher counts.”
I did the PITCHf/x study Peter suggested. Using Baseball Savant data, I looked at hit by pitch by count, and as Peter found when he studied the data from 1997 and 2013, HBPs occur more when pitchers are ahead on the count. Here are the data from 2014:
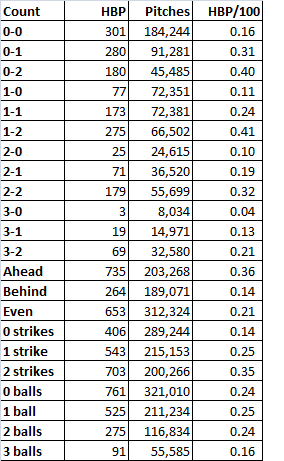
When the pitcher was ahead on the count, the batter was nearly three times as likely to get hit as when the batter was ahead. The most common counts for hit batters: 1-2, 0-2, and 2-2, and 0-1, all counts that encouraged pitchers to try to get batters to chase pitches on the border of the strike zone. Is this trend consistent? Baseball Savant’s data go back only to 2008, but using that season’s data, yes, the trend’s unchanged:
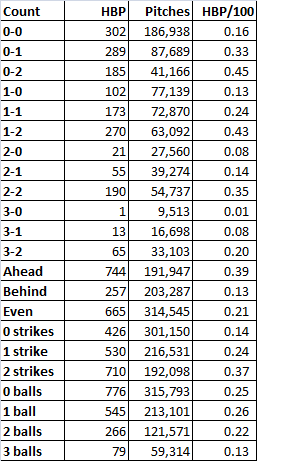
Same thing. Batters are three times more likely to get hit when the pitcher’s ahead on the count, and the three most common HBP counts are two strikes with zero, one, or two balls, followed by 0-1.
So why the increase in hit batters? It appears that, as Peter implied, it’s because of the increase in strikeouts. Every three strike count requires a two strike count, obviously. In 2008, 22% of at bats went to 0-2 counts, 34% went to 1-2, and 29% went to 2-2. In 2014, those percentages had risen to 25%, 36%, and 30%, respectively, in line with the increase in strikeouts from 17.5% of plate appearances to 20.4%. The route to three strikes, which is being traveled more frequently, includes the four counts most likely to result in a hit batter. That’s why we’re seeing batters hit by pitches at rates not seen since before the first World War.
Here’s a graphical representation. In 2014, the Pirates led the majors in hit batters, handily, with 88. Here’s where Pirates pitchers threw on the hitters’ counts of 1-0. 2-0, 3-0, and 3-1:

Those greenish-yellow areas in the middle of the zone indicate that when the pitchers fell behind, they tended to locate their pitches in the strike zone. By contrast, check out the location for pitches thrown on 0-1, 0-2, 1-2, and 2-2 counts, when the pitcher could waste a pitch trying to get the batter to chase it:
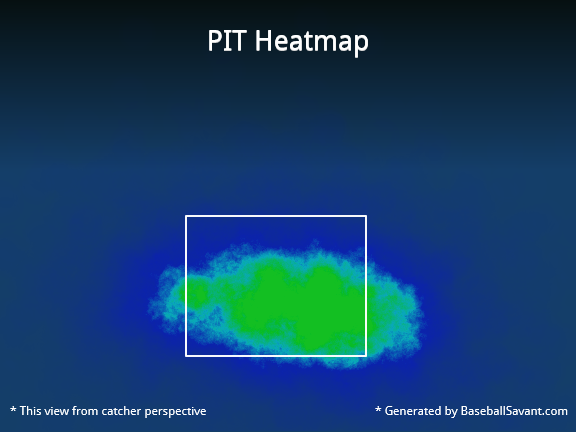
That’s a much less concentrated blob, with a higher percentage of pitches outside the strike zone, where the batter can get hit.
As a final check, I ran a correlation between strikeouts per plate appearance and hit batters per plate appearance post-World War II. The correlation coefficient’s 0.82. That’s pretty high, suggesting a link between strikeouts and batters getting hit. Granted, correlation is not causation. But given that there’s an empirical link–to get to three strikes, you have to get to two, and batters with two strikes are at the highest risk of getting hit by a pitch–it’s enough to make me believe that while there are a lot of reasons more batters are getting hit by pitches, a major explanation is that hit batters are a consequence of rising strikeout rates.
CODA: If there were a day last season that I thought might’ve turned to tide on batters getting hit by pitch, it was Thursday, September 11. That day, there were 15 HBPs in 11 games. That doesn’t include the horrific fastball to the face that ended Giancarlo Stanton’s season; that pitch was a strike. A lot of stars got hit: Stanton, Mike Trout (twice), Yoenis Cespedes, Carlos Gomez, Jayson Werth. Tampa Bay’s Brad Boxberger hit Derek Jeter in the elbow. Had that pitch ended Jeter’s farewell tour, I really think it would’ve created an issue of rising HBP rates. Fortunately for Jeter and purveyors of Jeter memorabilia, it didn’t. But taking the 15 hit batters together, plus Stanton, and excluding two obvious retaliation jobs (Anthony DeSclafani hitting Gomez after Stanton got hit, Joe Smith hitting Tomas Telis after Trout got hit a second time), the fourteen hit batsmen occurred on six 0-1 counts (including Stanton and Jeter), three 1-2 counts, two 1-1 counts, and one count each of 0-0, 2-1, and 2-2. There was only one HBP with the batter ahead on the count, and ten occurred on the four counts identified here as the most dangerous for batters.